Home > Comparison > Utilities > EXC vs PCG
The strategic rivalry between Exelon Corporation and Pacific Gas & Electric Co. shapes the utilities sector’s evolution in the U.S. Exelon operates a diversified energy portfolio spanning nuclear to renewables, blending generation with marketing and support services. In contrast, PG&E focuses on regulated electric and natural gas distribution in California, innovating with smart grid technologies. This analysis will assess which company’s operational model presents a superior risk-adjusted opportunity for a balanced investment portfolio.
Table of contents
Companies Overview
Exelon Corporation and Pacific Gas & Electric Co. stand as key pillars in the regulated electric utility sector in the US.
Exelon Corporation: Versatile Energy Giant
Exelon dominates as a regulated electric utility with a diversified generation portfolio spanning nuclear, wind, hydroelectric, and solar. It generates revenue by selling electricity and natural gas to wholesale and retail customers across the US and Canada. In 2026, Exelon focuses on expanding its renewable assets and optimizing its transmission and distribution networks to strengthen its competitive advantage.
Pacific Gas & Electric Co.: California’s Utility Innovator
Pacific Gas & Electric Co. operates as a regulated electric and natural gas utility serving northern and central California. Its revenue stems from electricity generation through nuclear, fossil fuel, hydroelectric, and photovoltaic sources, along with natural gas sales. The company emphasizes smart grid innovation, notably integrating personal microgrid backup power devices with its SmartMeter system to enhance grid reliability in 2026.
Strategic Collision: Similarities & Divergences
Both companies operate in regulated electric utilities with a focus on nuclear and renewable energy generation. Exelon pursues a broad geographic footprint and diversified energy sources, while PG&E centers on regional dominance with smart grid technology. The primary battleground is grid modernization and renewable integration. Exelon appeals as a diversified energy play; PG&E offers a more specialized, innovation-driven utility profile.
Income Statement Comparison
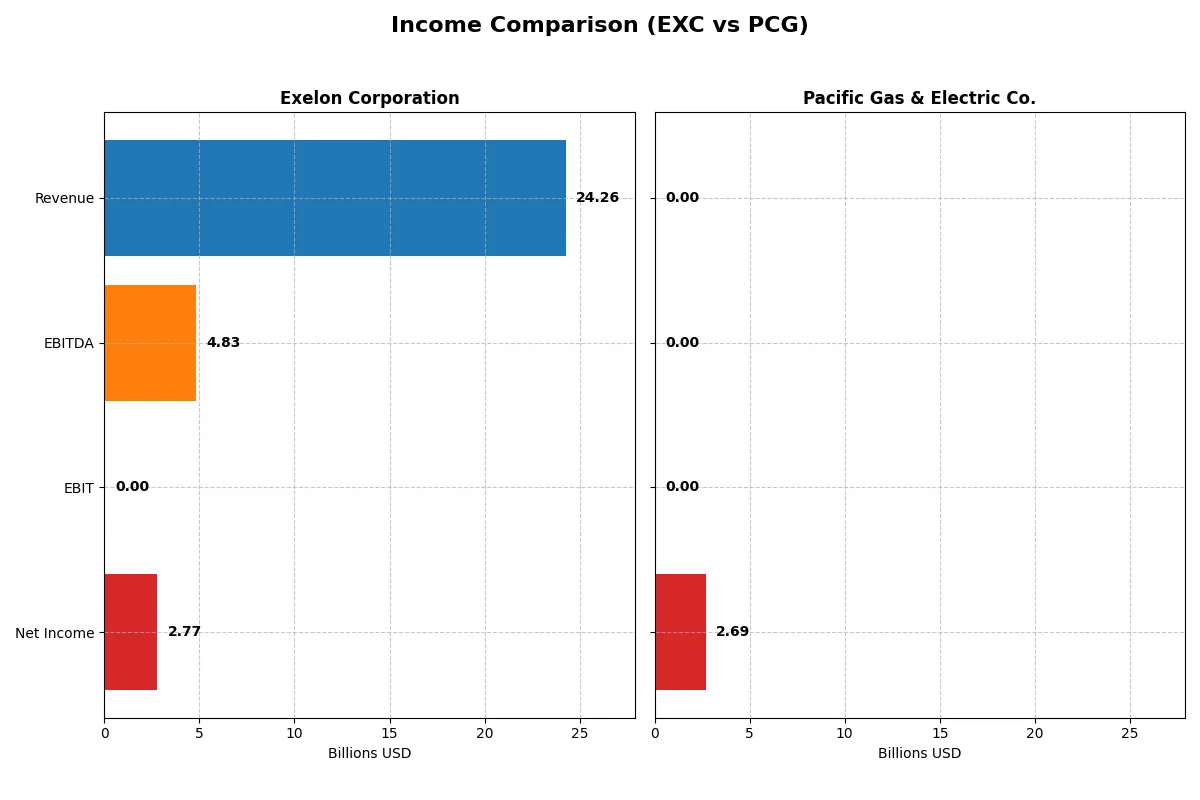
This data dissects the core profitability and scalability of both corporate engines to reveal who dominates the bottom line:
| Metric | Exelon Corporation (EXC) | Pacific Gas & Electric Co. (PCG) |
|---|---|---|
| Revenue | 24.3B | 0 |
| Cost of Revenue | 13.1B | 0 |
| Operating Expenses | 19.1B | -207M |
| Gross Profit | 11.1B | 0 |
| EBITDA | 4.8B | 0 |
| EBIT | 0 | 0 |
| Interest Expense | -2.1B | -315M |
| Net Income | 2.8B | 2.7B |
| EPS | 2.74 | 1.18 |
| Fiscal Year | 2025 | 2025 |
Income Statement Analysis: The Bottom-Line Duel
This income statement comparison reveals the true efficiency and profitability engines driving each company’s financial performance.
Exelon Corporation Analysis
Exelon’s revenue grew steadily from 17.9B in 2021 to 24.3B in 2025, with net income rising 62% to 2.8B. Its gross margin remains robust at 45.9%, while net margin improved to 11.4%. Despite a 100% drop in EBIT growth last year, Exelon shows strong momentum in profitability and EPS, signaling efficient cost management.
Pacific Gas & Electric Co. Analysis
Pacific Gas & Electric’s revenue collapsed to zero in 2025 from 24.4B in 2024, causing gross profit and EBIT margins to vanish. Yet net income surged to 2.7B, supported by non-operating items. EPS grew modestly despite a sharp revenue decline, reflecting unusual income sources rather than operational strength or margin health.
Operational Resilience vs. Accounting Anomaly
Exelon demonstrates consistent revenue growth with solid margins and improving net income, reflecting operational resilience. PG&E’s numbers highlight a structural revenue collapse but a spike in net income due to non-operating factors. For investors, Exelon’s profile is more attractive due to sustainable earnings and proven profitability.
Financial Ratios Comparison
These vital ratios act as a diagnostic tool to expose the underlying fiscal health, valuation premiums, and capital efficiency of the companies compared below:
| Ratios | Exelon Corporation (EXC) | Pacific Gas & Electric Co. (PCG) |
|---|---|---|
| ROE | 17.7% | 8.3% |
| ROIC | -53.8% | 0% |
| P/E | 15.9 | 13.1 |
| P/B | 2.82 | 1.08 |
| Current Ratio | 0.00 | 0.03 |
| Quick Ratio | 0.00 | 0.03 |
| D/E (Debt-to-Equity) | 3.18 | 0.27 |
| Debt-to-Assets | 0.00 | 0.19 |
| Interest Coverage | -2.45 | 0.00 |
| Asset Turnover | 0.00 | 0.00 |
| Fixed Asset Turnover | 0.00 | 0.00 |
| Payout ratio | 58.4% | 8.2% |
| Dividend yield | 3.67% | 0.62% |
| Fiscal Year | 2025 | 2025 |
Efficiency & Valuation Duel: The Vital Signs
Financial ratios act as the company’s DNA, unveiling hidden risks and operational excellence crucial for sound investment decisions.
Exelon Corporation
Exelon delivers a strong 17.7% ROE and an 11.4% net margin, signaling operational efficiency. Its P/E of 15.9 and P/B of 2.8 show a fairly valued stock. The 3.7% dividend yield rewards shareholders steadily, reflecting a balanced capital allocation between payouts and reinvestment.
Pacific Gas & Electric Co.
Pacific Gas posts a weaker 8.3% ROE with no net margin, indicating profitability challenges. Its valuation is more attractive, with a P/E of 13.1 and P/B of 1.1, suggesting undervaluation. The low 0.6% dividend yield points to limited shareholder returns amid ongoing operational risks.
Premium Valuation vs. Operational Safety
Exelon offers superior profitability and a healthier dividend, though at a slightly stretched valuation. Pacific Gas trades cheaper but struggles with profitability and minimal dividends. Investors seeking operational resilience may favor Exelon; value seekers with higher risk tolerance might lean toward Pacific Gas.
Which one offers the Superior Shareholder Reward?
I compare Exelon Corporation (EXC) and Pacific Gas & Electric Co. (PCG) based on their dividend yields, payout ratios, and share buyback intensity. EXC yields 3.7% with a 58% payout ratio, supported by moderate free cash flow despite negative FCF per share. Its buybacks are steady, enhancing shareholder value while maintaining capex and dividends coverage near 62%. PCG offers a minimal 0.6% yield with an 8% payout ratio, indicating a cautious dividend approach. PCG’s free cash flow is also negative but with lower debt leverage and a modest buyback program. Historically, EXC’s balanced dividend and buyback policy better aligns with sustainable shareholder rewards in this capital-intensive sector. I find EXC offers a superior total return profile for investors in 2026.
Comparative Score Analysis: The Strategic Profile
The radar chart reveals the fundamental DNA and trade-offs of Exelon Corporation and Pacific Gas & Electric Co.:
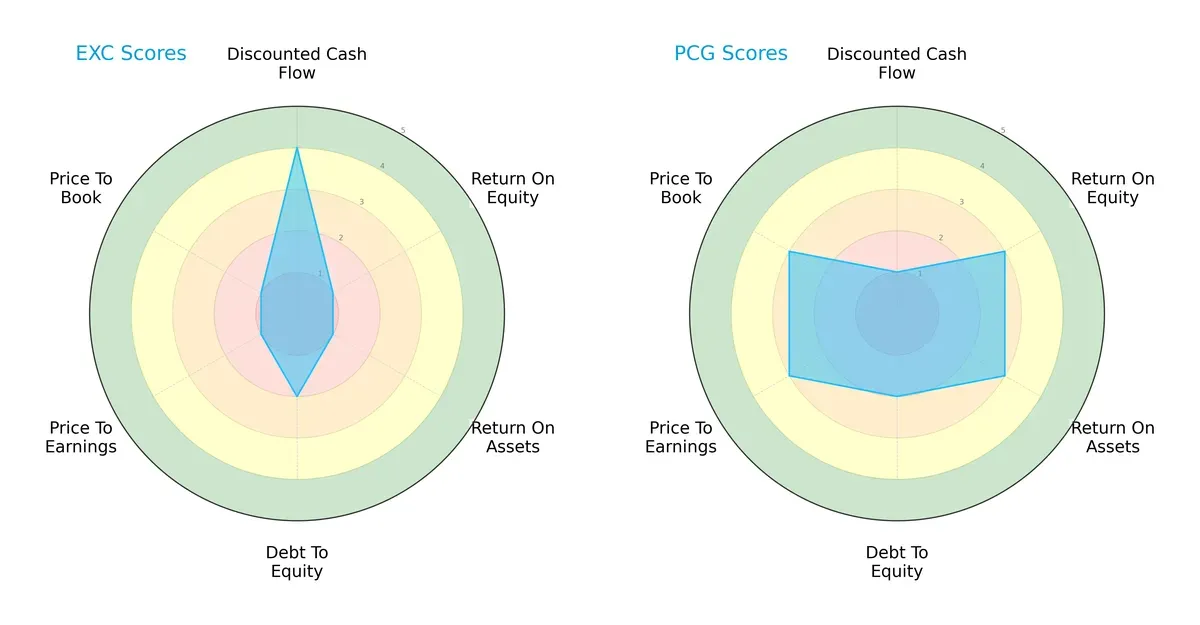
Exelon leans heavily on a favorable discounted cash flow score (4) but struggles with profitability metrics (ROE and ROA both at 1) and valuation scores (P/E and P/B at 1, very unfavorable). In contrast, Pacific Gas & Electric shows a more balanced profile, with moderate scores across profitability (ROE and ROA at 3) and valuation (P/E and P/B at 3), despite a weak DCF score (1). Pacific Gas & Electric’s diversified strengths suggest steadier operational efficiency, while Exelon relies on cash flow optimism amid weaker returns and valuation risks.
—
Financial Health: Quality of Operations
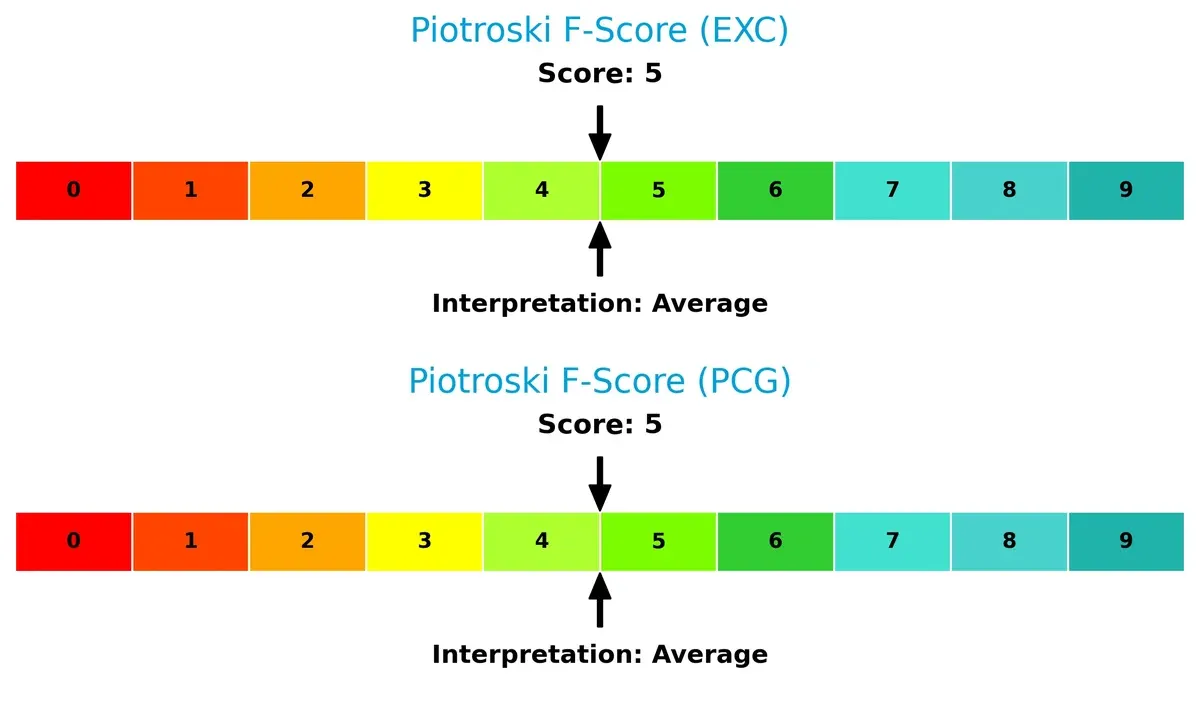
Both Exelon Corporation and Pacific Gas & Electric Co. share an average Piotroski F-Score of 5, indicating moderate financial health without clear red flags or strengths:
How are the two companies positioned?
This section dissects the operational DNA of EXC and PCG by comparing their revenue distribution by segment and internal dynamics. The goal is to confront their economic moats to identify the more resilient and sustainable competitive advantage today.
Revenue Segmentation: The Strategic Mix
This visual comparison dissects how Exelon Corporation and Pacific Gas & Electric Co. diversify their income streams and where their primary sector bets lie:
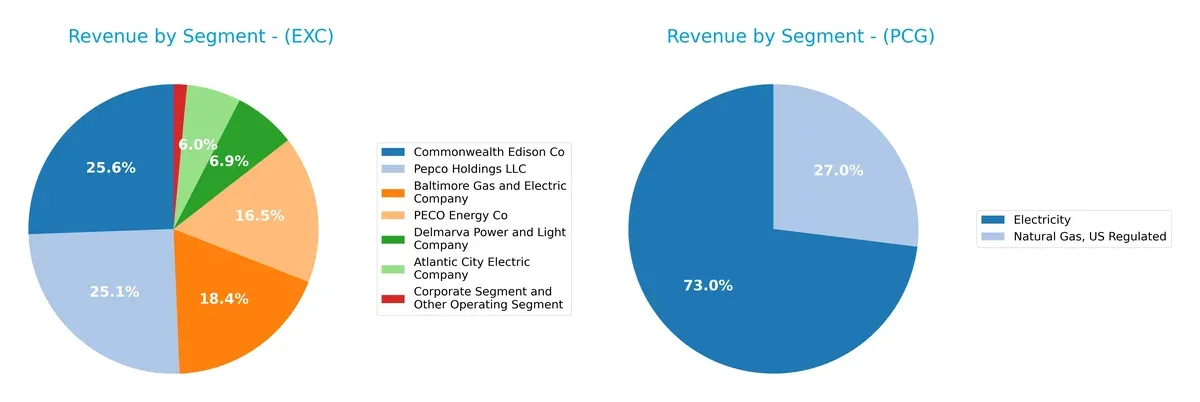
Exelon leans on multiple regulated utility segments, with Pepco Holdings LLC anchoring at $7.1B and Commonwealth Edison Co close behind at $7.3B in 2025. This mix spreads concentration risk across regional utilities. In contrast, PG&E pivots heavily on electricity generation at $18.3B, nearly tripling its natural gas segment of $6.8B, revealing a strong infrastructure dominance but also higher exposure to electricity market cycles.
Strengths and Weaknesses Comparison
This table compares the strengths and weaknesses of Exelon Corporation (EXC) and Pacific Gas & Electric Co. (PCG) based on diversification, profitability, financial statements, innovation, global presence, and market share:
EXC Strengths
- Diversified revenue streams across multiple operating segments
- Favorable net margin of 11.41%
- Strong return on equity at 17.74%
- Favorable WACC at 4.47%
- Solid dividend yield of 3.67%
PCG Strengths
- Favorable price-to-earnings ratio at 13.13
- Low debt-to-equity ratio of 0.27
- Favorable price-to-book ratio of 1.08
- Favorable debt-to-assets at 18.84%
- WACC slightly higher but still favorable at 4.93%
EXC Weaknesses
- Negative return on invested capital at -53.76%
- Zero current and quick ratios indicate liquidity concerns
- High debt-to-equity ratio of 3.18
- Negative interest coverage ratio
- Poor asset turnover metrics
- Neutral valuation multiples
PCG Weaknesses
- Zero net margin and unfavorable profitability metrics
- Low return on equity at 8.26%
- Negative interest coverage ratio
- Low dividend yield of 0.62%
- Very low current and quick ratios
- Unfavorable asset turnover ratios
Exelon shows strengths in profitability and diversified revenue but suffers from liquidity and capital efficiency issues. PCG benefits from conservative leverage and valuation metrics but faces challenges in profitability and cash flow generation. Both companies exhibit areas requiring strategic focus for financial health.
The Moat Duel: Analyzing Competitive Defensibility
A structural moat alone shields long-term profits from relentless competitive erosion in regulated utilities. Let’s dissect how Exelon and PG&E defend their turf:
Exelon Corporation: Legacy Infrastructure Under Pressure
Exelon’s moat stems from its extensive generation assets, including nuclear and renewables, creating high switching costs. Yet, declining ROIC signals weakening capital efficiency. New green tech investments may deepen the moat if execution improves.
Pacific Gas & Electric Co.: Emerging Profitability Amid Recovery
PG&E’s moat relies on regulated distribution and emerging smart grid tech. Unlike Exelon, PG&E shows improving ROIC trends despite no excess returns yet. Its microgrid innovation could disrupt and expand market control in 2026.
Legacy Assets vs. Innovation Edge: The Moat Battle
Exelon’s entrenched asset base offers a wider moat but suffers from eroding profitability. PG&E’s narrower moat shows promise with rising ROIC and innovation. I see PG&E better positioned to defend market share through operational turnaround and tech adoption.
Which stock offers better returns?
Over the past year, Exelon Corporation’s stock surged sharply with accelerating gains, while Pacific Gas & Electric Co. also posted solid growth but with lower volatility and steadier momentum.
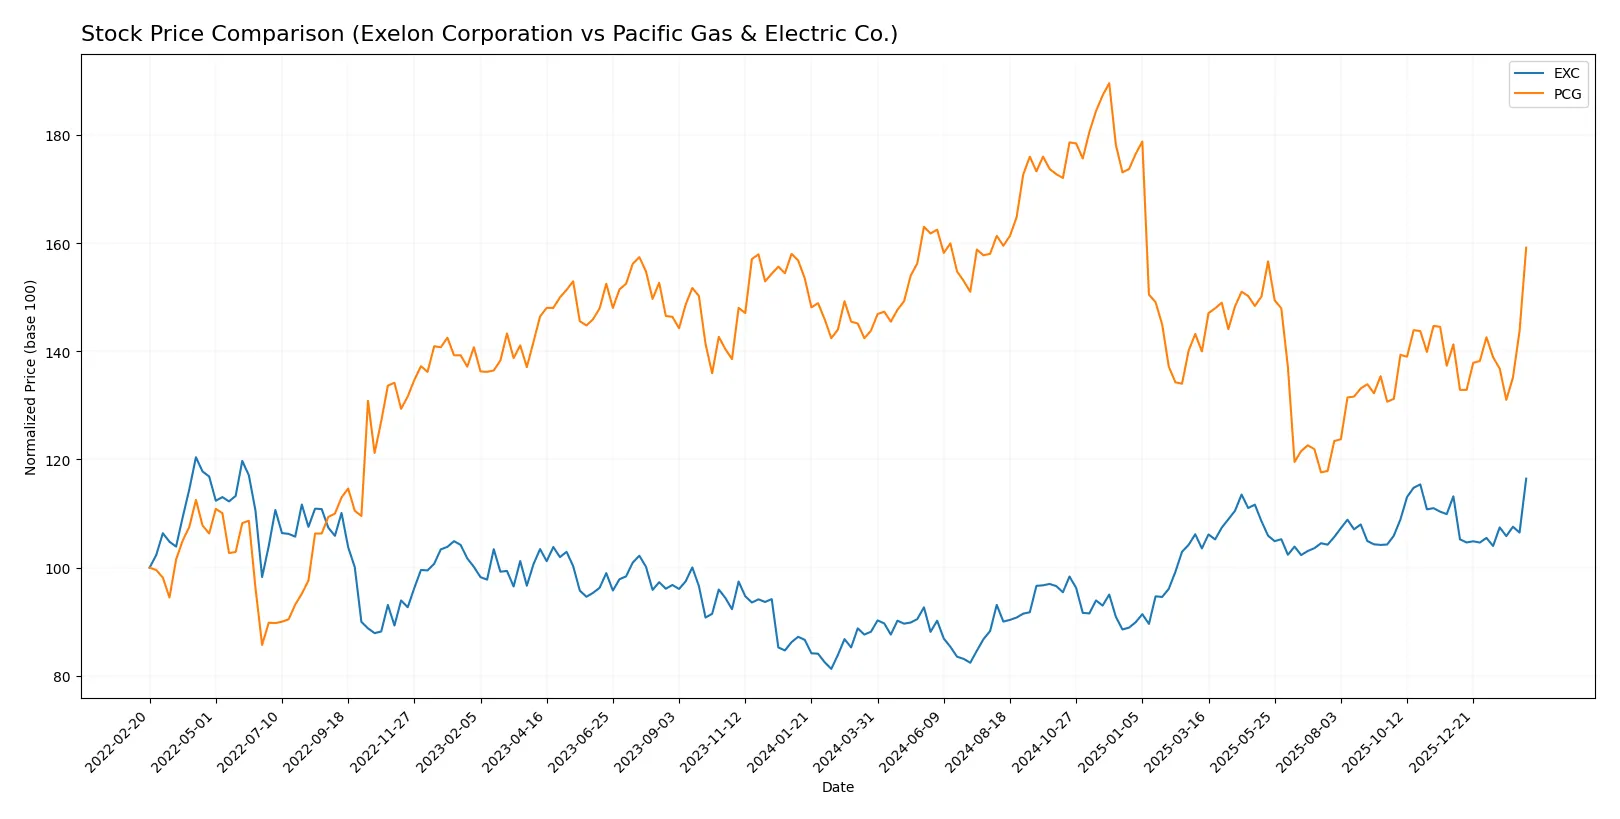
Trend Comparison
Exelon Corporation’s stock rose 32.1% over the past 12 months, showing a bullish trend with accelerating momentum. It reached a high of 48.48 and a low of 34.31, reflecting notable price expansion.
Pacific Gas & Electric Co.’s stock gained 10.66% over the same period, also bullish with accelerating trend but lower volatility. It traded between 13.42 and 21.63, indicating moderate price appreciation.
Exelon outperformed Pacific Gas & Electric by delivering more than triple the percentage gain, confirming it as the stronger market performer over the last year.
Target Prices
Analysts present a moderate upside potential based on consensus target prices for these regulated electric utilities.
| Company | Target Low | Target High | Consensus |
|---|---|---|---|
| Exelon Corporation | 39 | 57 | 50.27 |
| Pacific Gas & Electric Co. | 18 | 25 | 21.43 |
Exelon’s consensus target of 50.27 suggests slight appreciation from its current 48.48 price, indicating steady confidence. Pacific Gas & Electric’s consensus target of 21.43 exceeds its current 18.16 price, signaling potential upside according to analysts.

Don’t Let Luck Decide Your Entry Point
Optimize your entry points with our advanced ProRealTime indicators. You’ll get efficient buy signals with precise price targets for maximum performance. Start outperforming now!
How do institutions grade them?
Here is a summary of recent institutional grades for Exelon Corporation and Pacific Gas & Electric Co.:
Exelon Corporation Grades
The table below lists recent grades from major grading companies for Exelon Corporation.
| Grading Company | Action | New Grade | Date |
|---|---|---|---|
| Scotiabank | Maintain | Sector Perform | 2026-02-13 |
| BMO Capital | Maintain | Outperform | 2026-02-13 |
| Wells Fargo | Maintain | Overweight | 2026-02-13 |
| Mizuho | Maintain | Outperform | 2026-02-13 |
| Jefferies | Maintain | Buy | 2026-01-27 |
| Barclays | Maintain | Overweight | 2026-01-22 |
| Wells Fargo | Maintain | Overweight | 2026-01-20 |
| UBS | Maintain | Neutral | 2025-12-17 |
| JP Morgan | Maintain | Neutral | 2025-12-12 |
| Morgan Stanley | Maintain | Equal Weight | 2025-10-22 |
Pacific Gas & Electric Co. Grades
The table below shows recent grades from major grading companies for Pacific Gas & Electric Co.
| Grading Company | Action | New Grade | Date |
|---|---|---|---|
| Jefferies | Maintain | Buy | 2026-01-28 |
| Wells Fargo | Maintain | Overweight | 2026-01-20 |
| JP Morgan | Maintain | Overweight | 2025-12-12 |
| UBS | Maintain | Neutral | 2025-10-24 |
| Jefferies | Maintain | Buy | 2025-10-22 |
| BMO Capital | Maintain | Outperform | 2025-10-14 |
| Jefferies | Maintain | Buy | 2025-10-03 |
| Barclays | Maintain | Overweight | 2025-10-01 |
| Morgan Stanley | Maintain | Equal Weight | 2025-09-25 |
| Morgan Stanley | Upgrade | Equal Weight | 2025-09-18 |
Which company has the best grades?
Exelon Corporation and Pacific Gas & Electric Co. both receive strong institutional support with multiple “Buy,” “Outperform,” and “Overweight” ratings. Exelon shows a slightly broader range of positive grades, which may indicate marginally stronger analyst confidence. Investors might interpret this as a subtle signal of relative stability or growth potential.
Risks specific to each company
The following categories identify the critical pressure points and systemic threats facing both firms in the 2026 market environment:
1. Market & Competition
Exelon Corporation (EXC)
- Stable market presence with diversified energy sources, but faces sector-wide regulatory cost pressures.
Pacific Gas & Electric Co. (PCG)
- Concentrated California market exposure increases vulnerability to local competition and regulatory shifts.
2. Capital Structure & Debt
Exelon Corporation (EXC)
- High debt-to-equity ratio (3.18) signals elevated financial risk and weak interest coverage.
Pacific Gas & Electric Co. (PCG)
- Maintains conservative leverage (D/E 0.27) and better debt-to-assets profile, lowering solvency risk.
3. Stock Volatility
Exelon Corporation (EXC)
- Beta of 0.44 indicates low stock volatility, appealing for risk-averse investors.
Pacific Gas & Electric Co. (PCG)
- Even lower beta at 0.37 suggests marginally less price fluctuation and steadier investor sentiment.
4. Regulatory & Legal
Exelon Corporation (EXC)
- Faces evolving federal and state regulations on emissions and nuclear safety.
Pacific Gas & Electric Co. (PCG)
- High regulatory and legal risks linked to wildfire liabilities and stringent California policies.
5. Supply Chain & Operations
Exelon Corporation (EXC)
- Broad asset base with nuclear, fossil, and renewables reduces operational disruption risk.
Pacific Gas & Electric Co. (PCG)
- Operational complexity and aging infrastructure increase risks of outages and costly maintenance.
6. ESG & Climate Transition
Exelon Corporation (EXC)
- Progressing on renewables integration but still reliant on fossil fuels, raising transition risks.
Pacific Gas & Electric Co. (PCG)
- Intense focus on climate transition with investments in microgrid tech, but fire risk undermines ESG profile.
7. Geopolitical Exposure
Exelon Corporation (EXC)
- Primarily U.S. and Canada operations, limiting geopolitical volatility exposure.
Pacific Gas & Electric Co. (PCG)
- Operations confined to California expose PCG to regional political and environmental risks.
Which company shows a better risk-adjusted profile?
Exelon’s largest risk is its stretched capital structure and poor interest coverage, threatening financial flexibility. PCG faces its most severe risk from regulatory and legal pressures tied to wildfire liabilities. Despite PCG’s regulatory headwinds, its stronger balance sheet and lower leverage offer a better risk-adjusted profile. Notably, PCG’s Altman Z-score signals distress, but its debt management and market position mitigate some financial risks. Investors should weigh Exelon’s financial strain against PCG’s operational and regulatory challenges cautiously.
Final Verdict: Which stock to choose?
Exelon Corporation’s superpower lies in its strong income growth and robust net margin, reflecting operational strength despite capital allocation challenges. Its key point of vigilance is a declining ROIC, signaling value destruction risks. EXC suits portfolios chasing aggressive growth with tolerance for financial leverage.
Pacific Gas & Electric’s strategic moat stems from improving ROIC trends and a conservative debt profile, offering relative safety over EXC. Its valuation metrics suggest a margin of safety for value-conscious investors. PCG fits well in GARP portfolios seeking stable, improving profitability.
If you prioritize aggressive growth and can accept elevated financial risk, Exelon outshines with superior income growth momentum. However, if you seek better stability and gradual profitability improvement, Pacific Gas & Electric offers a more measured path, albeit with less compelling growth dynamics. Both stocks pose distinct analytical scenarios based on investor risk appetite and time horizon.
Disclaimer: Investment carries a risk of loss of initial capital. The past performance is not a reliable indicator of future results. Be sure to understand risks before making an investment decision.
Go Further
I encourage you to read the complete analyses of Exelon Corporation and Pacific Gas & Electric Co. to enhance your investment decisions: