In the evolving utilities sector, Exelon Corporation and Oklo Inc. stand out as key players shaping the future of energy. Exelon, a well-established giant with diverse energy assets, contrasts with Oklo’s innovative approach to advanced nuclear technology. Both operate in regulated electric markets but differ vastly in scale and strategy. This article will help you decide which company offers the most compelling investment opportunity today.
Table of contents
Companies Overview
I will begin the comparison between Exelon Corporation and Oklo Inc. by providing an overview of these two companies and their main differences.
Exelon Corporation Overview
Exelon Corporation is a utility services holding company operating in the United States and Canada. It focuses on energy generation, delivery, and marketing, owning diverse facilities including nuclear, fossil, wind, hydroelectric, biomass, and solar. The company also provides electricity and natural gas sales, transmission, distribution, and a range of support services to various customer segments. Exelon is headquartered in Chicago and employs about 20,000 people.
Oklo Inc. Overview
Oklo Inc. is a developer of fission power plants aimed at providing reliable, commercial-scale energy in the United States. Founded in 2013 and based in Santa Clara, California, Oklo also handles used nuclear fuel recycling. The company operates with a much smaller workforce of approximately 120 employees and has been publicly traded since 2021. It focuses primarily on innovative nuclear energy solutions within the regulated electric sector.
Key similarities and differences
Both Exelon and Oklo operate within the regulated electric utilities sector in the US, targeting energy generation and delivery. While Exelon maintains a broad portfolio spanning multiple energy sources and extensive infrastructure, Oklo specializes narrowly in nuclear fission technology and recycling. Exelon’s larger scale and diversified operations contrast with Oklo’s focused, innovative approach to nuclear power, reflecting distinct business models within the same industry.
Income Statement Comparison
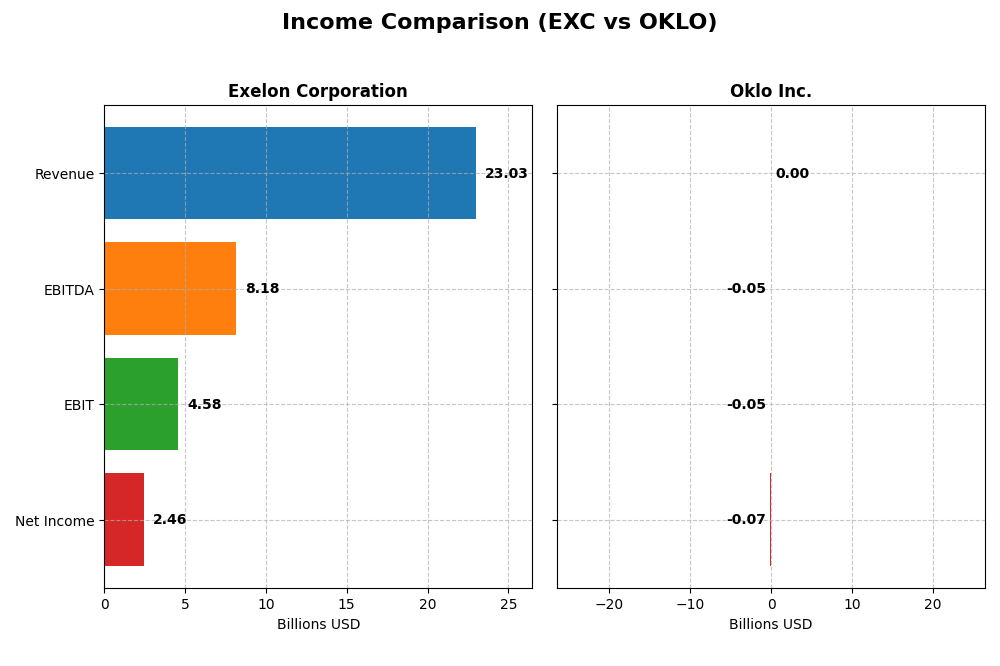
Below is a side-by-side comparison of the latest annual income statement metrics for Exelon Corporation and Oklo Inc., providing a snapshot of their financial performance in 2024.
| Metric | Exelon Corporation (EXC) | Oklo Inc. (OKLO) |
|---|---|---|
| Market Cap | 43.8B | 16.5B |
| Revenue | 23.0B | 0 |
| EBITDA | 8.18B | -52.5M |
| EBIT | 4.58B | -52.8M |
| Net Income | 2.46B | -73.6M |
| EPS | 2.45 | -0.7443 |
| Fiscal Year | 2024 | 2024 |
Income Statement Interpretations
Exelon Corporation
Exelon exhibited revenue growth from $17.9B in 2021 to $23B in 2024, although revenue declined sharply from $33B in 2020. Net income rose steadily from $1.7B in 2021 to $2.46B in 2024. Margins improved overall, with a gross margin near 41% and net margin at 10.7% in 2024. The latest year saw revenue growth moderate to 6%, with net margin slightly down by 0.3%, reflecting stable profitability.
Oklo Inc.
Oklo reported zero revenue throughout 2021-2024, consistent with its early-stage development status. Net losses widened from -$5.2M in 2021 to -$73.6M in 2024. Margins remain unfavorable due to lack of revenue and ongoing high operating expenses. The recent year showed a significant increase in expenses and net loss, with no improvements in gross or net margins, indicating continued investment phase without profitability.
Which one has the stronger fundamentals?
Exelon demonstrates stronger fundamentals with consistent revenue and net income growth, favorable gross and net margins, and a positive income statement outlook despite some recent margin pressure. Conversely, Oklo’s income statement is characterized by persistent losses, no revenue, and unfavorable margin trends, reflecting high risk and early-stage development challenges over the analyzed period.
Financial Ratios Comparison
The table below presents the key financial ratios for Exelon Corporation and Oklo Inc. based on their latest reported fiscal year 2024 data, facilitating a direct comparison.
| Ratios | Exelon Corporation (EXC) | Oklo Inc. (OKLO) |
|---|---|---|
| ROE | 9.14% | -29.35% |
| ROIC | 3.93% | -19.23% |
| P/E | 15.35 | -28.52 |
| P/B | 1.40 | 8.37 |
| Current Ratio | 0.87 | 43.47 |
| Quick Ratio | 0.78 | 43.47 |
| D/E | 1.73 | 0.005 |
| Debt-to-Assets | 43.28% | 0.46% |
| Interest Coverage | 2.26 | 0 |
| Asset Turnover | 0.21 | 0 |
| Fixed Asset Turnover | 0.29 | 0 |
| Payout Ratio | 61.95% | 0 |
| Dividend Yield | 4.04% | 0 |
Interpretation of the Ratios
Exelon Corporation
Exelon shows a mixed ratio profile with strengths in net margin (10.68%, favorable) and dividend yield (4.04%, favorable), but weaknesses in return on equity (9.14%, unfavorable) and liquidity ratios below 1, indicating potential short-term financial stress. The payout appears supported by solid free cash flow coverage, but the firm maintains a cautious stance due to high debt levels (D/E 1.73, unfavorable). Dividend payments remain consistent.
Oklo Inc.
Oklo exhibits predominantly unfavorable profitability ratios, with negative return on equity (-29.35%) and return on invested capital (-19.23%), reflecting operational challenges. Liquidity is exceptionally high (current ratio 43.47), possibly indicating inefficient capital use. The company does not pay dividends, likely due to its high growth and reinvestment phase, prioritizing R&D and acquisitions over shareholder returns. Debt levels are low (D/E 0.01, favorable).
Which one has the best ratios?
Exelon presents a slightly unfavorable overall ratio profile with better profitability and dividend yield, despite liquidity concerns and moderate debt. Oklo’s ratios are generally unfavorable, marked by losses and no dividend returns, though it benefits from low debt and strong liquidity. From a risk perspective, Exelon’s more balanced ratios contrast with Oklo’s early-stage financial challenges and reinvestment focus.
Strategic Positioning
This section compares the strategic positioning of Exelon Corporation and Oklo Inc., focusing on Market position, Key segments, and Exposure to technological disruption:
Exelon Corporation
- Large market cap with established utilities, facing moderate competitive pressure.
- Diverse energy generation including nuclear, fossil, wind, hydro, solar, plus energy sales and services.
- Operates in regulated electric utilities with traditional and renewable energy assets, moderate technological changes.
Oklo Inc.
- Smaller market cap, emerging player in fission power with higher competitive risk.
- Specialized in fission power plants and nuclear fuel recycling services.
- Focused on innovative nuclear technology, higher exposure to technological disruption.
Exelon Corporation vs Oklo Inc. Positioning
Exelon follows a diversified, large-scale utility model with multiple energy sources and stable regulated segments, while Oklo concentrates on niche nuclear technologies with a smaller scale, implying differing risk and growth profiles based solely on their provided business scope.
Which has the best competitive advantage?
Exelon shows a slightly unfavorable moat with growing ROIC but still shedding value, whereas Oklo has a very unfavorable moat with declining ROIC, indicating Exelon currently maintains a relatively stronger competitive advantage.
Stock Comparison
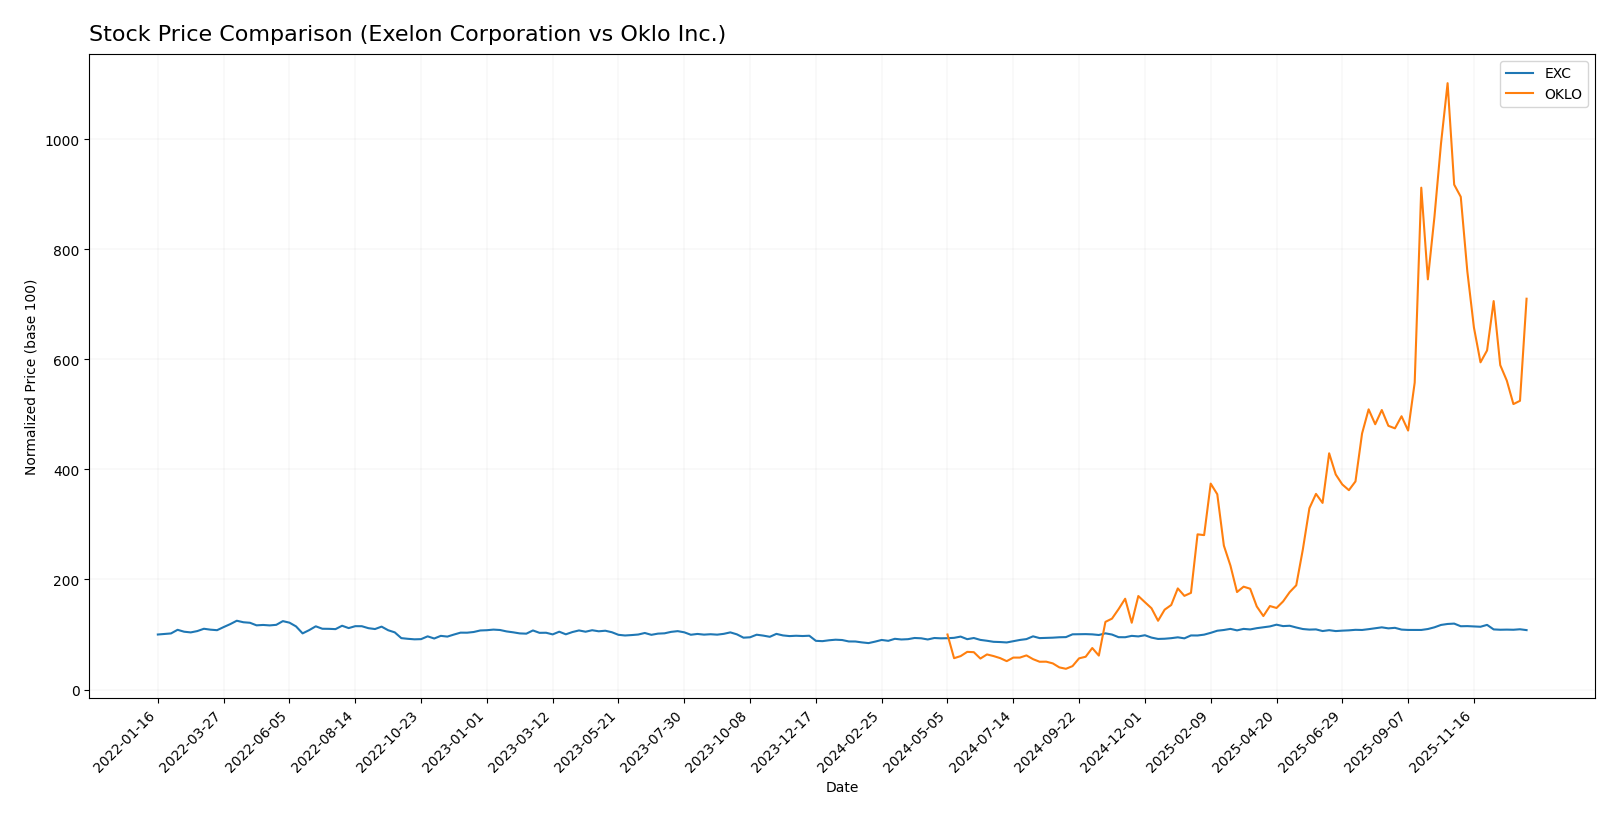
The stock price movements of Exelon Corporation (EXC) and Oklo Inc. (OKLO) over the past 12 months reveal strong bullish trends with notable deceleration, alongside recent downward corrections reflecting changing trading dynamics.
Trend Analysis
Exelon Corporation (EXC) showed a bullish trend over the past 12 months with a 24.03% price increase and deceleration in growth. The stock ranged between $34.31 and $48.04, with recent weeks showing a -9.87% decline and a slight seller dominance in volume.
Oklo Inc. (OKLO) exhibited a significant bullish trend with a 610.11% price increase over the same period, despite decelerating momentum. The price fluctuated between $5.59 and $163.39, but recent trading saw a sharp -22.59% drop and pronounced seller dominance in volume.
Comparing both, Oklo delivered the highest market performance with a markedly larger overall price gain, although both stocks faced recent downward trends and increased selling pressure.
Target Prices
Analysts provide a clear consensus on target prices for both Exelon Corporation and Oklo Inc., indicating potential upside from current levels.
| Company | Target High | Target Low | Consensus |
|---|---|---|---|
| Exelon Corporation | 57 | 39 | 50.86 |
| Oklo Inc. | 150 | 95 | 125.67 |
Exelon’s target consensus of 50.86 suggests moderate upside from its current price of 43.3 USD. Oklo’s consensus target of 125.67 indicates strong growth expectations above its current 105.31 USD share price.
Analyst Opinions Comparison
This section compares analysts’ ratings and financial scores for Exelon Corporation and Oklo Inc.:
Rating Comparison
EXC Rating
- Rating: B, considered Very Favorable overall.
- Discounted Cash Flow Score: 3, indicating moderate valuation based on cash flow.
- ROE Score: 3, showing moderate efficiency in generating profit from equity.
- ROA Score: 3, reflecting moderate asset utilization effectiveness.
- Debt To Equity Score: 2, moderately managing financial risk with debt levels.
- Overall Score: 3, moderate overall financial standing.
OKLO Rating
- Rating: C+, also considered Very Favorable overall.
- Discounted Cash Flow Score: 3, indicating moderate valuation based on cash flow.
- ROE Score: 1, indicating very unfavorable efficiency in profit generation.
- ROA Score: 1, reflecting very unfavorable asset utilization effectiveness.
- Debt To Equity Score: 5, very favorable, indicating strong balance sheet.
- Overall Score: 2, moderate overall financial standing.
Which one is the best rated?
Based strictly on the provided data, Exelon Corporation holds a higher overall rating (B) and better ROE and ROA scores than Oklo Inc., which is rated C+. However, Oklo shows a stronger debt-to-equity score, indicating a more favorable balance sheet.
Scores Comparison
Here is a comparison of the Altman Z-Score and Piotroski Score for Exelon Corporation and Oklo Inc.:
EXC Scores
- Altman Z-Score: 0.78, indicating financial distress risk.
- Piotroski Score: 5, reflecting average financial strength.
OKLO Scores
- Altman Z-Score: 339.43, indicating a very strong safe zone.
- Piotroski Score: 2, reflecting very weak financial strength.
Which company has the best scores?
Based on the provided scores, Oklo has a significantly higher Altman Z-Score indicating strong financial stability. However, Exelon has a higher Piotroski Score, suggesting better overall financial health. Each score highlights different strengths.
Grades Comparison
The grades from multiple reputable grading companies for Exelon Corporation and Oklo Inc. are as follows:
Exelon Corporation Grades
This table summarizes the recent grades assigned to Exelon Corporation by established grading firms.
| Grading Company | Action | New Grade | Date |
|---|---|---|---|
| UBS | Maintain | Neutral | 2025-12-17 |
| JP Morgan | Maintain | Neutral | 2025-12-12 |
| Morgan Stanley | Maintain | Equal Weight | 2025-10-22 |
| Keybanc | Maintain | Underweight | 2025-10-15 |
| Jefferies | Maintain | Buy | 2025-10-15 |
| Barclays | Maintain | Overweight | 2025-10-14 |
| UBS | Maintain | Neutral | 2025-10-10 |
| Morgan Stanley | Maintain | Equal Weight | 2025-09-25 |
| Keybanc | Maintain | Underweight | 2025-07-16 |
| UBS | Maintain | Neutral | 2025-07-11 |
Exelon’s grades predominantly indicate a neutral to hold stance, with occasional buy and overweight ratings, showing a generally cautious but balanced outlook.
Oklo Inc. Grades
This table displays the latest grades assigned to Oklo Inc. by recognized grading companies.
| Grading Company | Action | New Grade | Date |
|---|---|---|---|
| Seaport Global | Upgrade | Buy | 2025-12-08 |
| UBS | Maintain | Neutral | 2025-12-03 |
| B of A Securities | Maintain | Neutral | 2025-11-12 |
| B. Riley Securities | Maintain | Buy | 2025-11-12 |
| Wedbush | Maintain | Outperform | 2025-11-12 |
| B of A Securities | Downgrade | Neutral | 2025-09-30 |
| Seaport Global | Downgrade | Neutral | 2025-09-23 |
| Wedbush | Maintain | Outperform | 2025-09-22 |
| Wedbush | Maintain | Outperform | 2025-08-14 |
| Wedbush | Maintain | Outperform | 2025-08-12 |
Oklo’s grades trend toward buy and outperform ratings with some recent neutral downgrades, indicating a generally positive but somewhat volatile sentiment.
Which company has the best grades?
Oklo Inc. has received more buy and outperform ratings compared to Exelon Corporation’s predominantly neutral and hold consensus. For investors, this suggests Oklo is viewed with relatively higher growth expectations, while Exelon is considered more stable with moderate risk and return potential.
Strengths and Weaknesses
Below is a comparative overview of key strengths and weaknesses for Exelon Corporation (EXC) and Oklo Inc. (OKLO) based on the latest financial and operational data.
| Criterion | Exelon Corporation (EXC) | Oklo Inc. (OKLO) |
|---|---|---|
| Diversification | Highly diversified across multiple regulated utility segments with stable revenue streams totaling over $34B in 2024 | Limited diversification; early-stage with no significant revenue reported |
| Profitability | Moderate profitability with 10.7% net margin but ROIC (3.9%) below WACC (5%), indicating slight value destruction | Negative profitability; net margin 0%, ROIC -19.2%, shedding value with declining ROIC |
| Innovation | Moderate innovation focus; steady operational improvements but no significant tech breakthroughs reported | High innovation potential in advanced nuclear technology but currently no commercial revenue |
| Global presence | Primarily US-focused with large regulated utility operations in several states | Very limited or no global presence, focused on technology development |
| Market Share | Strong market share in US regulated electricity and gas markets | No market share yet, pre-commercial phase |
Key takeaways: Exelon offers a stable, diversified business with moderate profitability but faces challenges in efficient capital use. Oklo represents a high-risk, high-innovation opportunity with current value destruction and no revenues, suitable only for risk-tolerant investors seeking exposure to nuclear tech innovation.
Risk Analysis
The table below summarizes key risks for Exelon Corporation (EXC) and Oklo Inc. (OKLO) based on the most recent 2024 data:
| Metric | Exelon Corporation (EXC) | Oklo Inc. (OKLO) |
|---|---|---|
| Market Risk | Moderate (Beta 0.556) | Moderate (Beta 0.773) |
| Debt level | High (D/E 1.73, 43% assets) | Very Low (D/E 0.01, 0.46% assets) |
| Regulatory Risk | Elevated (Utility sector, nuclear/fossil exposure) | Elevated (Nuclear technology, regulatory approvals) |
| Operational Risk | Moderate (Large asset base, aging infrastructure) | High (Small scale, new technology deployment) |
| Environmental Risk | High (Fossil and nuclear emissions, climate policies) | Moderate (Nuclear fuel recycling, innovative reactors) |
| Geopolitical Risk | Low (US and Canada focused) | Low (US based, emerging tech) |
Exelon faces significant debt and environmental risks due to its large regulated utility operations and fossil/nuclear assets. Oklo’s biggest concerns lie in operational and regulatory risks as a small, innovative nuclear tech company with weak profitability and financial stability despite low debt. Exelon’s financial distress signal and Oklo’s very weak Piotroski score highlight caution for investors.
Which Stock to Choose?
Exelon Corporation (EXC) shows a generally favorable income evolution with a 25.32% net income growth over 2020-2024 and solid profitability indicators such as a 10.68% net margin, despite some unfavorable financial ratios including a 1.73 debt-to-equity ratio and a current ratio below 1. Its rating is very favorable with a “B” grade, though the company is slightly unfavorable on overall financial ratios and is currently shedding value as ROIC remains below WACC, albeit with improving profitability.
Oklo Inc. (OKLO) reveals an unfavorable income statement performance marked by negative net income growth (-1327.63%) and zero net margin, paired with mostly unfavorable financial ratios except for low debt levels and a very high current ratio. Its rating is also very favorable with a “C+” grade, but the company is considered very unfavorable in value creation due to a declining ROIC well below its WACC and weak profitability metrics.
Investors focused on income stability and moderate growth might find Exelon’s financial profile more aligned with their preferences, given its favorable income trends and improving profitability despite some leverage concerns. Conversely, those with a higher risk tolerance seeking growth potential could interpret Oklo’s rapid but volatile stock price appreciation and low debt as indicative of speculative opportunity, though financial fundamentals remain weak.
Disclaimer: Investment carries a risk of loss of initial capital. The past performance is not a reliable indicator of future results. Be sure to understand risks before making an investment decision.
Go Further
I encourage you to read the complete analyses of Exelon Corporation and Oklo Inc. to enhance your investment decisions: