In the evolving energy sector, Exelon Corporation (EXC) and NuScale Power Corporation (SMR) stand out as key players shaping the future of utilities. Exelon, a seasoned giant in regulated electric and diverse energy sources, contrasts sharply with NuScale’s innovative approach in modular nuclear technology. Their overlapping focus on clean, reliable energy and differing innovation strategies make this comparison crucial. Join me as we explore which company offers the most compelling opportunity for investors today.

Table of contents
Companies Overview
I will begin the comparison between Exelon Corporation and NuScale Power Corporation by providing an overview of these two companies and their main differences.
Exelon Corporation Overview
Exelon Corporation is a utility services holding company operating in the regulated electric industry in the US and Canada. It owns diverse energy generation assets including nuclear, fossil, wind, hydroelectric, biomass, and solar facilities. The company also engages in electricity and natural gas sales, transmission, and distribution, serving a broad range of customers from residential to governmental. Headquartered in Chicago, Exelon employs around 20,000 people.
NuScale Power Corporation Overview
NuScale Power Corporation specializes in developing and selling modular light water nuclear reactors for electricity generation and other applications like district heating and hydrogen production. Founded in 2007 and based in Portland, Oregon, NuScale offers scalable nuclear power plants such as the NuScale Power Module and VOYGR series. It operates as a subsidiary of Fluor Enterprises, with a workforce of approximately 330 employees focused on renewable utilities.
Key similarities and differences
Both companies operate within the utilities sector but differ significantly in scale and focus. Exelon is a large, diversified utility provider with a market cap of about 44.4B and a broad energy portfolio, including renewable and traditional sources. NuScale, with a smaller market cap near 4.9B, concentrates on innovative nuclear technology and modular reactors. While Exelon’s business model includes energy generation, delivery, and retail sales, NuScale’s model centers on nuclear power plant development and sales.
Income Statement Comparison
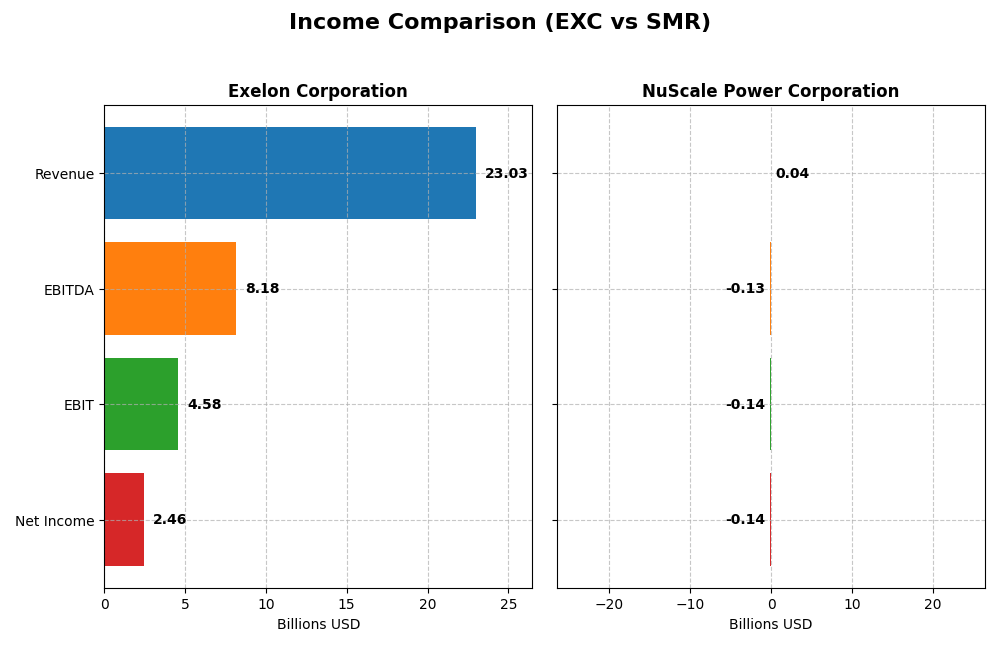
The table below presents a side-by-side comparison of key income statement metrics for Exelon Corporation and NuScale Power Corporation for fiscal year 2024.
| Metric | Exelon Corporation (EXC) | NuScale Power Corporation (SMR) |
|---|---|---|
| Market Cap | 44.4B | 4.87B |
| Revenue | 23.0B | 37.0M |
| EBITDA | 8.18B | -134M |
| EBIT | 4.58B | -135M |
| Net Income | 2.46B | -137M |
| EPS | 2.45 | -1.47 |
| Fiscal Year | 2024 | 2024 |
Income Statement Interpretations
Exelon Corporation
Exelon has shown a generally positive trend in revenue and net income from 2020 to 2024, with revenue rising from $17.9B in 2021 to $23B in 2024, despite a dip in 2020. Margins remained favorable, with a gross margin of 40.8% and a net margin of 10.7% in 2024. The latest year saw moderate revenue growth of 6% and a slight decline in net margin, signaling stable but cautious expansion.
NuScale Power Corporation
NuScale’s revenue surged from $600K in 2020 to $37M in 2024, reflecting rapid growth typical of a developing company. However, it reported consistent net losses, with a net margin of -368.8% in 2024. Gross margin is strong at 86.7%, but EBIT and net income margins remain deeply negative. The latest year showed significant revenue and EBIT growth, yet net margin and EPS deteriorated further.
Which one has the stronger fundamentals?
Exelon demonstrates healthier fundamentals with consistent profitability, positive net income growth, and stable margins, reflecting a mature business with controlled expenses. NuScale, despite strong revenue growth and gross margin, continues to incur losses with negative EBIT and net margins, indicating higher risk typical of early-stage companies. Exelon’s financials suggest stronger income statement stability.
Financial Ratios Comparison
The table below presents a side-by-side comparison of key financial ratios for Exelon Corporation and NuScale Power Corporation based on their most recent fiscal year data (2024).
| Ratios | Exelon Corporation (EXC) | NuScale Power Corporation (SMR) |
|---|---|---|
| ROE | 9.14% | -22.08% |
| ROIC | 3.93% | -30.66% |
| P/E | 15.35 | -12.24 |
| P/B | 1.40 | 2.70 |
| Current Ratio | 0.87 | 5.25 |
| Quick Ratio | 0.78 | 5.25 |
| D/E | 1.73 | 0 |
| Debt-to-Assets | 43.28% | 0 |
| Interest Coverage | 2.26 | 0 |
| Asset Turnover | 0.21 | 0.07 |
| Fixed Asset Turnover | 0.29 | 15.30 |
| Payout ratio | 61.95% | 0 |
| Dividend yield | 4.04% | 0% |
Interpretation of the Ratios
Exelon Corporation
Exelon exhibits a mixed ratio profile with favorable net margin (10.68%) and dividend yield (4.04%), but unfavorable returns on equity (9.14%) and invested capital (3.93%). Liquidity ratios are below 1, signaling potential short-term stress. The company pays dividends with a stable yield, but free cash flow coverage is weak, raising concerns about sustainability.
NuScale Power Corporation
NuScale shows overall unfavorable ratios, including a deeply negative net margin (-368.8%) and return on equity (-22.08%), reflecting operational losses. Liquidity ratios are strong, with a current ratio above 5, and no debt reported. The company does not pay dividends, consistent with its negative earnings and heavy investment in R&D and growth.
Which one has the best ratios?
Exelon’s ratios are slightly unfavorable but show stable profitability and dividend returns, contrasting with NuScale’s broadly unfavorable financial metrics and ongoing losses. While Exelon faces liquidity and leverage challenges, NuScale’s high investment and negative returns underline higher risk. Overall, Exelon presents a more balanced ratio profile.
Strategic Positioning
This section compares the strategic positioning of Exelon Corporation and NuScale Power Corporation, focusing on Market position, Key segments, and Exposure to technological disruption:
Exelon Corporation
- Large market cap of 44B in regulated electric utilities, facing moderate competitive pressure.
- Diverse segments including nuclear, fossil, wind, hydroelectric, biomass, solar, and energy services.
- Operates established generation and distribution assets, less prone to rapid technological shifts.
NuScale Power Corporation
- Smaller market cap of 4.9B in renewable utilities, with high market volatility.
- Focused on modular light water reactor nuclear plants for power and industrial applications.
- Innovates in modular nuclear technology, exposed to potential disruption in energy generation.
Exelon Corporation vs NuScale Power Corporation Positioning
Exelon is diversified across multiple energy sources and services, providing stability but with moderate competitive pressure. NuScale is concentrated on advanced nuclear technology, offering innovation potential but with higher market and technological risks.
Which has the best competitive advantage?
Both companies show growing ROIC trends but are currently shedding value. Exelon’s broader asset base and regulated market offer steadier returns, while NuScale’s niche innovation faces higher uncertainty despite profitability improvements.
Stock Comparison
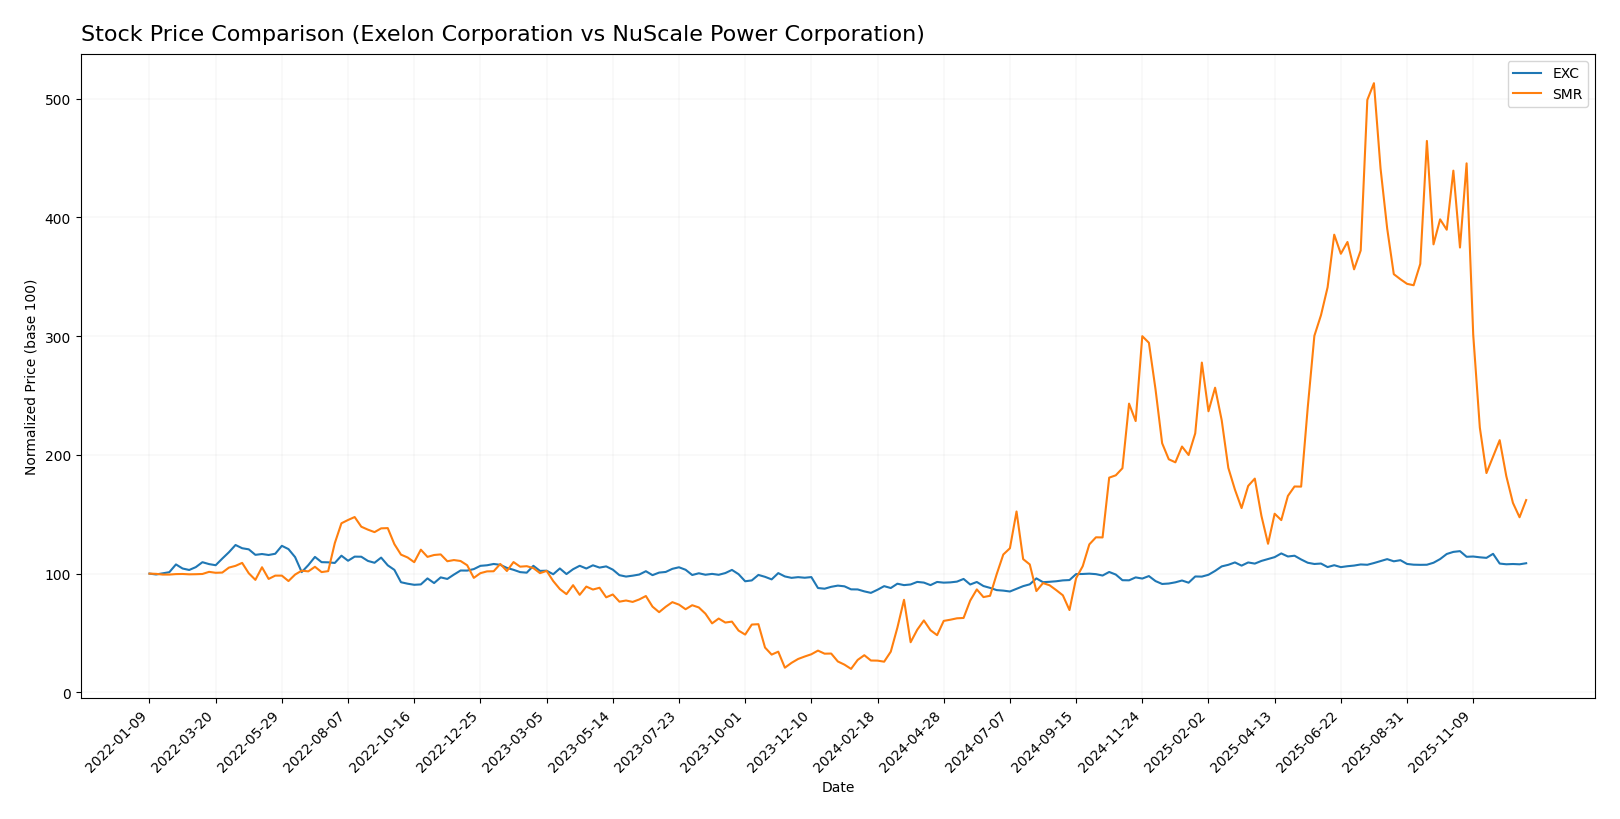
The stock prices of Exelon Corporation (EXC) and NuScale Power Corporation (SMR) have exhibited significant bullish trends over the past 12 months, with recent periods showing notable declines and shifts in trading dynamics.
Trend Analysis
Exelon Corporation’s stock rose 29.79% over the past year, indicating a bullish trend with decelerating momentum. The price ranged between 33.84 and 48.04, with recent weeks showing an 8.08% decline and neutral buyer behavior.
NuScale Power Corporation’s stock surged 504.07% over the same period, also bullish but with decelerating acceleration. The price fluctuated from 2.6 to 51.67, followed by a sharp 63.14% drop recently, alongside increased volatility and slight seller dominance.
Comparing both stocks, NuScale Power delivered substantially higher market performance than Exelon over the past year, despite its recent steep decline and elevated volatility.
Target Prices
Analysts present a balanced target price consensus for Exelon Corporation and NuScale Power Corporation, reflecting moderate upside potential.
| Company | Target High | Target Low | Consensus |
|---|---|---|---|
| Exelon Corporation | 57 | 39 | 50.83 |
| NuScale Power Corporation | 55 | 20 | 33.83 |
Exelon’s consensus target of 50.83 suggests a roughly 16% upside from its current price of 43.92 USD. NuScale’s consensus target of 33.83 implies significant potential upside from the current price of 16.32 USD, but with higher volatility reflected in the broad target range.
Analyst Opinions Comparison
This section compares analysts’ ratings and grades for Exelon Corporation and NuScale Power Corporation:
Rating Comparison
EXC Rating
- Rating: B, indicating a very favorable status.
- Discounted Cash Flow Score: 3, moderate rating.
- ROE Score: 3, moderate efficiency in profit generation from equity.
- ROA Score: 3, moderate asset utilization.
- Debt To Equity Score: 2, moderate financial risk.
- Overall Score: 3, moderate overall financial standing.
SMR Rating
- Rating: D+, also noted as very favorable.
- Discounted Cash Flow Score: 1, very unfavorable.
- ROE Score: 1, very unfavorable efficiency.
- ROA Score: 1, very unfavorable asset utilization.
- Debt To Equity Score: 1, very unfavorable risk.
- Overall Score: 1, very unfavorable financial standing.
Which one is the best rated?
Based strictly on the provided data, Exelon Corporation is better rated than NuScale Power Corporation, with consistently higher scores across all financial metrics, indicating stronger overall financial health.
Scores Comparison
The comparison of Exelon Corporation and NuScale Power Corporation scores is as follows:
EXC Scores
- Altman Z-Score: 0.78, in distress zone indicating high bankruptcy risk
- Piotroski Score: 5, average financial strength
SMR Scores
- Altman Z-Score: 7.92, in safe zone indicating low bankruptcy risk
- Piotroski Score: 2, very weak financial strength
Which company has the best scores?
Based on the provided data, SMR shows a much stronger Altman Z-Score indicating financial safety, while EXC has a higher Piotroski Score reflecting better average financial health. Each score favors a different company.
Grades Comparison
Here is a comparison of the recent grades given to Exelon Corporation and NuScale Power Corporation by recognized grading companies:
Exelon Corporation Grades
The following table summarizes the latest grades and actions by reputable firms for Exelon Corporation:
| Grading Company | Action | New Grade | Date |
|---|---|---|---|
| UBS | maintain | Neutral | 2025-12-17 |
| JP Morgan | maintain | Neutral | 2025-12-12 |
| Morgan Stanley | maintain | Equal Weight | 2025-10-22 |
| Keybanc | maintain | Underweight | 2025-10-15 |
| Jefferies | maintain | Buy | 2025-10-15 |
| Barclays | maintain | Overweight | 2025-10-14 |
| UBS | maintain | Neutral | 2025-10-10 |
| Morgan Stanley | maintain | Equal Weight | 2025-09-25 |
| Keybanc | maintain | Underweight | 2025-07-16 |
| UBS | maintain | Neutral | 2025-07-11 |
Exelon’s grades mainly range from Underweight to Buy, with several Neutral and Equal Weight ratings, indicating mixed but generally moderate confidence from analysts.
NuScale Power Corporation Grades
The following table outlines recent grades and updates for NuScale Power Corporation from established grading companies:
| Grading Company | Action | New Grade | Date |
|---|---|---|---|
| B. Riley Securities | maintain | Buy | 2025-12-22 |
| Goldman Sachs | maintain | Neutral | 2025-12-12 |
| UBS | maintain | Neutral | 2025-11-25 |
| RBC Capital | maintain | Sector Perform | 2025-11-10 |
| Citigroup | downgrade | Sell | 2025-10-21 |
| B of A Securities | downgrade | Underperform | 2025-09-30 |
| Canaccord Genuity | maintain | Buy | 2025-09-03 |
| UBS | maintain | Neutral | 2025-08-11 |
| Canaccord Genuity | maintain | Buy | 2025-08-11 |
| BTIG | downgrade | Neutral | 2025-06-25 |
NuScale’s grades include notable downgrades to Sell and Underperform, offset by several Buy and Neutral ratings, reflecting a more volatile analyst sentiment.
Which company has the best grades?
Exelon Corporation generally holds steadier and moderately positive grades, whereas NuScale Power shows a wider spread from Buy to Sell, reflecting greater analyst uncertainty. This variation may affect investor confidence and perceived risk differently for each company.
Strengths and Weaknesses
Below is a comparison of key strengths and weaknesses for Exelon Corporation (EXC) and NuScale Power Corporation (SMR) based on the latest financial and operational data.
| Criterion | Exelon Corporation (EXC) | NuScale Power Corporation (SMR) |
|---|---|---|
| Diversification | Highly diversified with multiple utility segments generating multi-billion USD revenues | Limited diversification; revenues largely from “Other” segment with minimal scale (411K USD in 2024) |
| Profitability | Moderate net margin (10.68%), positive dividend yield (4.04%), but ROIC (3.93%) below WACC | Negative profitability metrics: net margin (-369%), ROIC (-30.66%), no dividends; high WACC (13.65%) |
| Innovation | Stable but traditional utility operations; limited data on breakthrough innovation | Strong innovation potential in small modular reactors but currently in investment phase with losses |
| Global presence | Primarily US-focused utilities with large customer base | Primarily US-focused with emerging nuclear technology; global presence limited |
| Market Share | Large market share in regional utilities with steady revenue growth | Emerging player in nuclear tech; market share currently negligible |
Key takeaways: Exelon offers a stable, diversified utility business with moderate profitability and a solid dividend, though its returns on invested capital are slightly below cost. NuScale Power is an innovative but early-stage company facing significant losses and limited revenue, implying higher risk for investors.
Risk Analysis
Below is a comparative table of key risks for Exelon Corporation (EXC) and NuScale Power Corporation (SMR) based on the most recent data from 2024.
| Metric | Exelon Corporation (EXC) | NuScale Power Corporation (SMR) |
|---|---|---|
| Market Risk | Moderate (Beta 0.55) | High (Beta 2.10) |
| Debt level | High (Debt/Equity 1.73) | Low (Debt/Equity 0) |
| Regulatory Risk | Significant (Utility sector heavily regulated) | Elevated (Nuclear tech, evolving regulations) |
| Operational Risk | Moderate (Diverse energy sources, aging infrastructure) | High (Emerging tech and scale-up challenges) |
| Environmental Risk | Medium (Nuclear and fossil operations impact) | Medium to High (Nuclear energy development) |
| Geopolitical Risk | Low (Primarily US/Canada operations) | Moderate (Supply chain and tech dependencies) |
Exelon’s primary risks stem from its significant debt load and regulatory environment, balanced by a stable beta indicating lower market volatility. NuScale faces higher market volatility and operational risks due to its early-stage nuclear power tech, despite having no debt. Both companies face environmental scrutiny, with NuScale’s innovative technology posing unique regulatory and operational challenges.
Which Stock to Choose?
Exelon Corporation (EXC) shows a stable income evolution with favorable net margin and gross margin, though revenue has declined over the overall period. Financial ratios reveal a slightly unfavorable profile with moderate profitability, elevated debt levels, and a current ratio below 1. The company’s rating is very favorable with a “B” grade, supported by moderate scores in key areas.
NuScale Power Corporation (SMR) exhibits strong revenue growth but negative net income trends and significant losses. Its financial ratios are mostly unfavorable, reflecting poor profitability and high operational expenses, despite zero debt and a strong quick ratio. The rating stands at “D+” with very unfavorable scores, indicating financial instability despite some favorable ratio aspects.
Investors seeking stability and value creation might find EXC’s favorable rating and improving profitability more aligned with a risk-averse or quality-focused profile. Conversely, risk-tolerant investors aiming for growth could interpret SMR’s rapid revenue expansion and safe debt position as potential, albeit with caution due to significant losses and financial weakness.
Disclaimer: Investment carries a risk of loss of initial capital. The past performance is not a reliable indicator of future results. Be sure to understand risks before making an investment decision.
Go Further
I encourage you to read the complete analyses of Exelon Corporation and NuScale Power Corporation to enhance your investment decisions: