Home > Comparison > Utilities > NEE vs EXC
The strategic rivalry between NextEra Energy, Inc. and Exelon Corporation shapes the future of the regulated electric utilities sector. NextEra operates as a capital-intensive clean energy pioneer, focusing on renewable generation and long-term contracted assets. In contrast, Exelon emphasizes a diversified energy portfolio with extensive utility services across North America. This analysis aims to determine which company offers the superior risk-adjusted outlook for investors seeking durable exposure to evolving energy markets.
Table of contents
Companies Overview
NextEra Energy and Exelon Corporation are major players in the North American regulated electric market. Both companies focus on power generation and distribution but differ in scale and strategic emphasis. Their competition shapes the evolving utilities landscape amid rising clean energy demands.
NextEra Energy, Inc.: A Clean Energy Pioneer
NextEra Energy dominates the regulated electric sector with a 28,564 MW net generating capacity. Its revenue stems from electricity generation via wind, solar, nuclear, coal, and natural gas. In 2021, the company emphasized expanding clean energy assets, including renewable facilities and battery storage, leveraging its vast transmission network to serve 11 million customers primarily in Florida.
Exelon Corporation: Integrated Utility Services Leader
Exelon Corporation operates as a diversified utility holding company with a broad portfolio of nuclear, fossil, wind, hydroelectric, biomass, and solar facilities. It generates revenue through wholesale and retail electricity sales, natural gas, and energy services. In 2021, Exelon focused on integrated energy delivery and customer support services, targeting utilities, municipalities, and commercial clients across the U.S. and Canada.
Strategic Collision: Similarities & Divergences
Both companies pursue regulated electric generation and distribution, yet NextEra prioritizes clean energy expansion while Exelon emphasizes integrated utility services and customer solutions. Their primary battleground is clean power generation capacity and reliability. NextEra offers a growth-oriented profile centered on renewables; Exelon presents a stable, diversified utility model with broad service offerings.
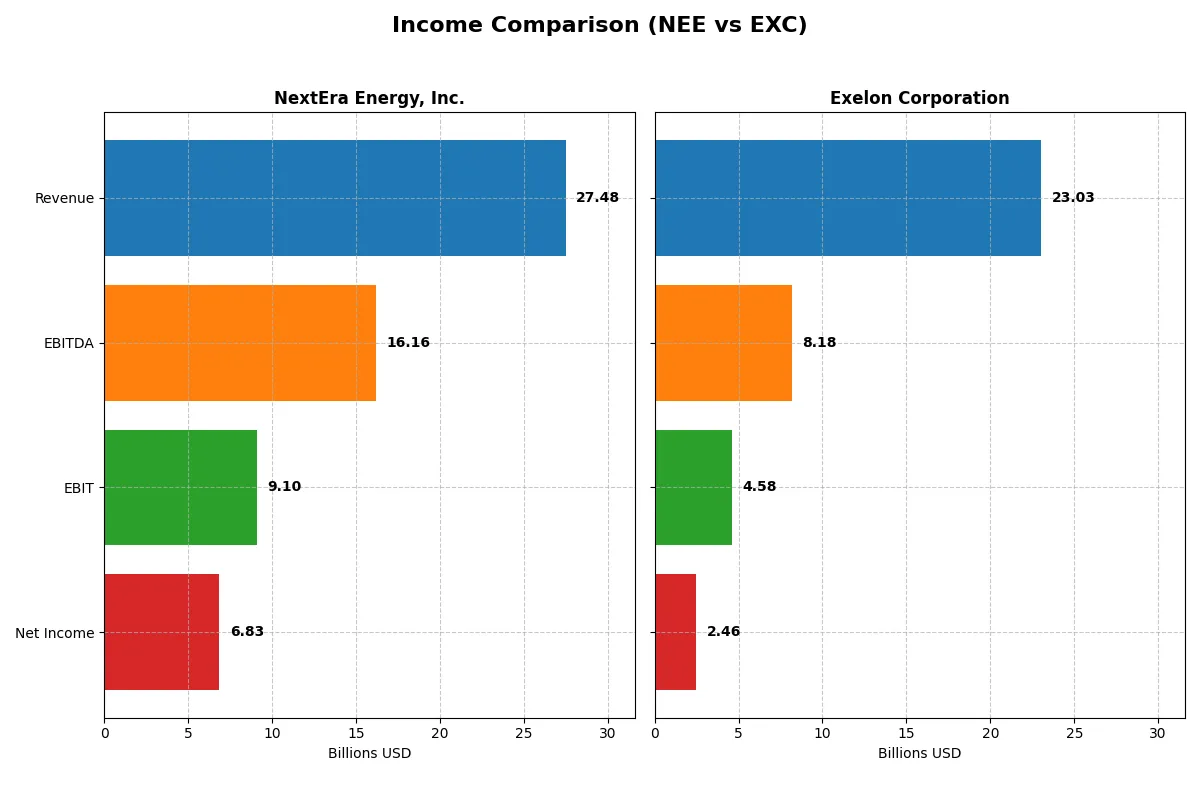
Income Statement Comparison
This data dissects the core profitability and scalability of both corporate engines to reveal who dominates the bottom line:
| Metric | NextEra Energy, Inc. (NEE) | Exelon Corporation (EXC) |
|---|---|---|
| Revenue | 27.5B | 23.0B |
| Cost of Revenue | 10.2B | 13.6B |
| Operating Expenses | 8.98B | 5.09B |
| Gross Profit | 17.3B | 9.41B |
| EBITDA | 16.2B | 8.18B |
| EBIT | 9.10B | 4.58B |
| Interest Expense | 4.57B | 1.91B |
| Net Income | 6.83B | 2.46B |
| EPS | 3.31 | 2.45 |
| Fiscal Year | 2025 | 2024 |
Income Statement Analysis: The Bottom-Line Duel
This income statement comparison reveals which company runs a more efficient and profitable business engine in the evolving energy sector.
NextEra Energy, Inc. Analysis
NextEra Energy’s revenue climbed steadily from $17.1B in 2021 to $27.5B in 2025, with net income nearly doubling to $6.8B. Its gross margin holds strong at 62.8%, while net margin remains robust at 24.9%. Despite rising interest expenses, operating income surged to $8.3B in 2025, reflecting solid momentum and operational efficiency.
Exelon Corporation Analysis
Exelon’s revenue peaked at $33B in 2020 but settled around $23B by 2024, showing mixed growth. Net income grew moderately to $2.46B in 2024, supported by a gross margin of 40.8% and a net margin of 10.7%. EBIT margin at 19.9% marks operational strength, though slower revenue growth and fluctuating expenses suggest cautious momentum.
Margin Dominance vs. Scale Resilience
NextEra Energy outperforms with superior margins and consistent revenue growth, translating into stronger bottom-line expansion. Exelon, while maintaining respectable profitability, lags in revenue scale and margin efficiency. Investors seeking growth and margin resilience may find NextEra’s profile more compelling in this competitive energy landscape.
Financial Ratios Comparison
These vital ratios act as a diagnostic tool to expose the underlying fiscal health, valuation premiums, and capital efficiency of the companies compared below:
| Ratios | NextEra Energy, Inc. (NEE) | Exelon Corporation (EXC) |
|---|---|---|
| ROE | 13.9% | 9.1% |
| ROIC | 4.0% | 3.9% |
| P/E | 21.2 | 15.3 |
| P/B | 2.94 | 1.40 |
| Current Ratio | 0.47 | 0.87 |
| Quick Ratio | 0.38 | 0.78 |
| D/E (Debt-to-Equity) | 1.64 | 1.73 |
| Debt-to-Assets | 43.3% | 43.3% |
| Interest Coverage | 3.35 | 2.26 |
| Asset Turnover | 0.13 | 0.21 |
| Fixed Asset Turnover | 0.18 | 0.29 |
| Payout ratio | 61.0% | 61.9% |
| Dividend yield | 2.87% | 4.04% |
| Fiscal Year | 2024 | 2024 |
Efficiency & Valuation Duel: The Vital Signs
Financial ratios serve as a company’s DNA, uncovering hidden risks and operational strengths essential for informed investment decisions.
NextEra Energy, Inc.
NextEra posts a strong net margin of 28%, signaling operational efficiency. Its ROE of 13.9% appears adequate, but a ROIC of 4.0% below WACC of 6.4% raises concerns about capital returns. Valuation ratios (P/E 21.2, P/B 2.94) are neutral, while a 2.87% dividend yield rewards shareholders amid modest buyback activity.
Exelon Corporation
Exelon’s net margin of 10.7% is respectable but trails NextEra. ROE at 9.1% and ROIC at 3.9%, both below NextEra’s, highlight weaker profitability. The stock’s valuation is more attractive with P/E 15.4 and P/B 1.4. A higher dividend yield of 4.04% offers stronger income, despite a slightly higher debt ratio and similar operational challenges.
Premium Valuation vs. Income Stability
NextEra’s higher profitability contrasts with Exelon’s cheaper valuation and superior dividend yield. NextEra excels in operational margins but struggles with capital efficiency. Exelon offers income-focused investors a better yield and lower valuation, fitting a more conservative profile seeking steady cash flow.
Which one offers the Superior Shareholder Reward?
I compare NextEra Energy (NEE) and Exelon Corporation (EXC) on their shareholder distributions. NEE yields 2.87% with a high 61% payout ratio, showing solid free cash flow (FCF) coverage. EXC pays a higher 4.04% yield but with a similar 62% payout ratio and weaker FCF, negative in recent years. NEE’s buybacks are moderate but consistent, enhancing total return sustainably. EXC’s buybacks lag, constrained by negative FCF and heavy capex. I view NEE’s balanced dividends and buybacks as more sustainable. Thus, NEE offers a superior total return profile in 2026.
Comparative Score Analysis: The Strategic Profile
The radar chart reveals the fundamental DNA and trade-offs of NextEra Energy, Inc. and Exelon Corporation, highlighting their financial strengths and vulnerabilities:
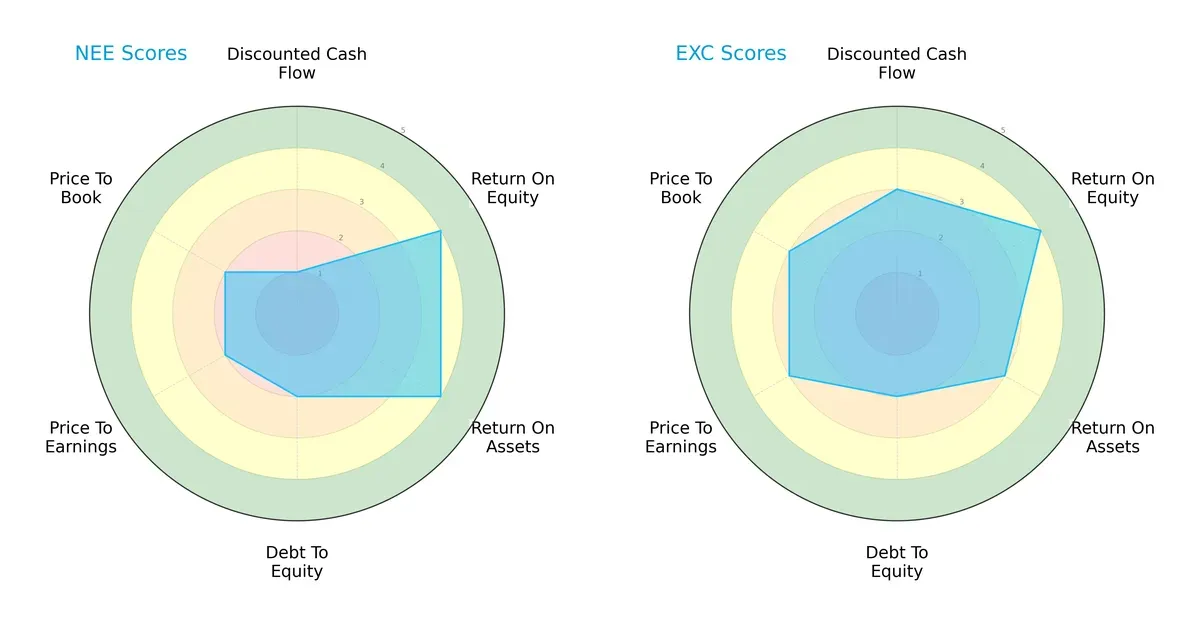
NextEra Energy leans heavily on strong ROE and ROA scores (4 each) but suffers a very unfavorable discounted cash flow score (1), signaling potential overvaluation risks. Exelon shows a more balanced profile with moderate DCF (3), ROA (3), and valuation metrics (P/E and P/B scores of 3), suggesting steadier financial footing without overreliance on a single advantage. Both have moderate debt-to-equity risk (2), but Exelon’s valuation scores indicate a slightly more attractive price point.
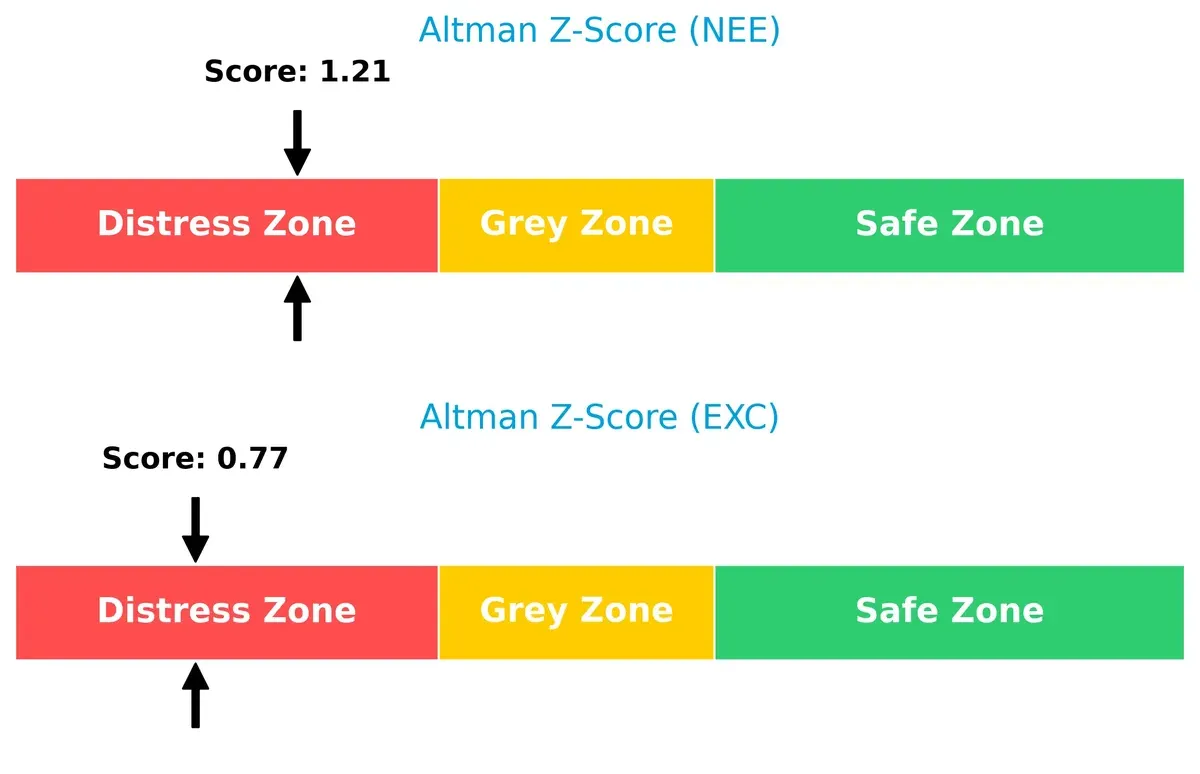
Bankruptcy Risk: Solvency Showdown
NextEra’s Altman Z-Score of 1.21 slightly outperforms Exelon’s 0.77, though both reside in the distress zone, signaling elevated bankruptcy risk amid current market volatility:
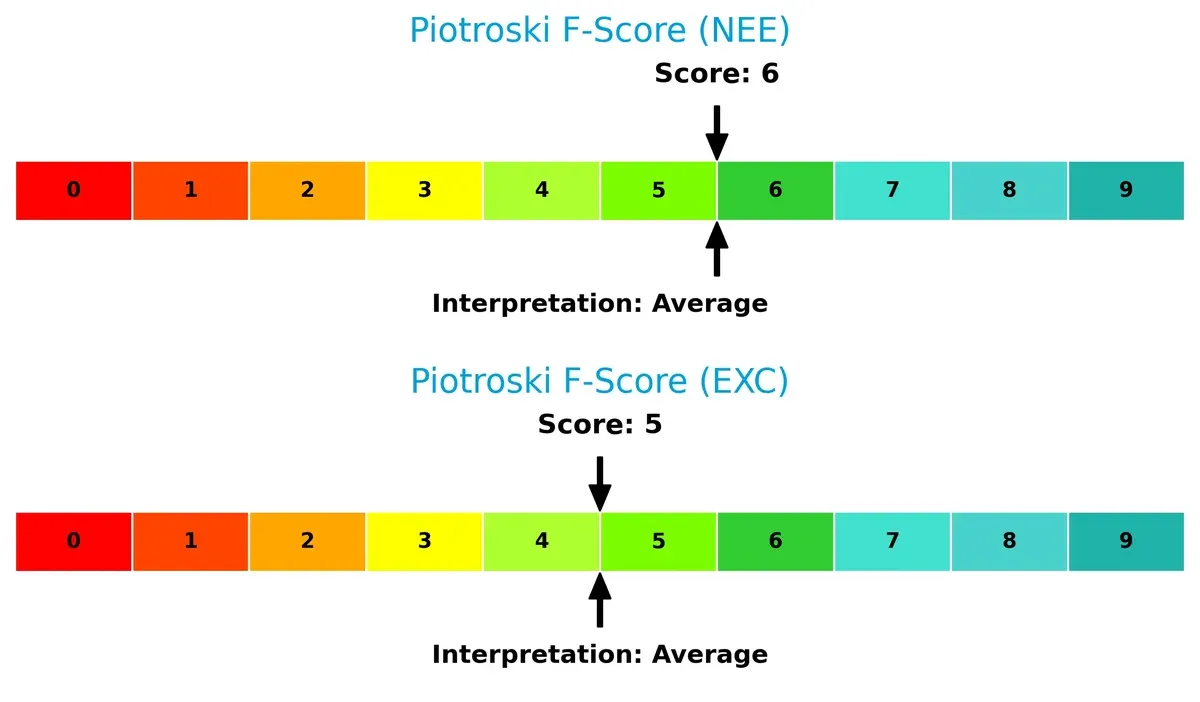
Financial Health: Quality of Operations
NextEra scores a 6 on the Piotroski F-Score, marginally better than Exelon’s 5, indicating slightly stronger operational health but still only average financial quality. Neither firm shows red flags, but both require caution:
How are the two companies positioned?
This section dissects the operational DNA of NextEra Energy and Exelon by comparing their revenue distribution and internal strengths and weaknesses. The goal is to confront their economic moats and reveal which business model delivers the most resilient competitive advantage today.
Revenue Segmentation: The Strategic Mix
The following visual comparison dissects how NextEra Energy, Inc. and Exelon Corporation diversify their income streams and where their primary sector bets lie:
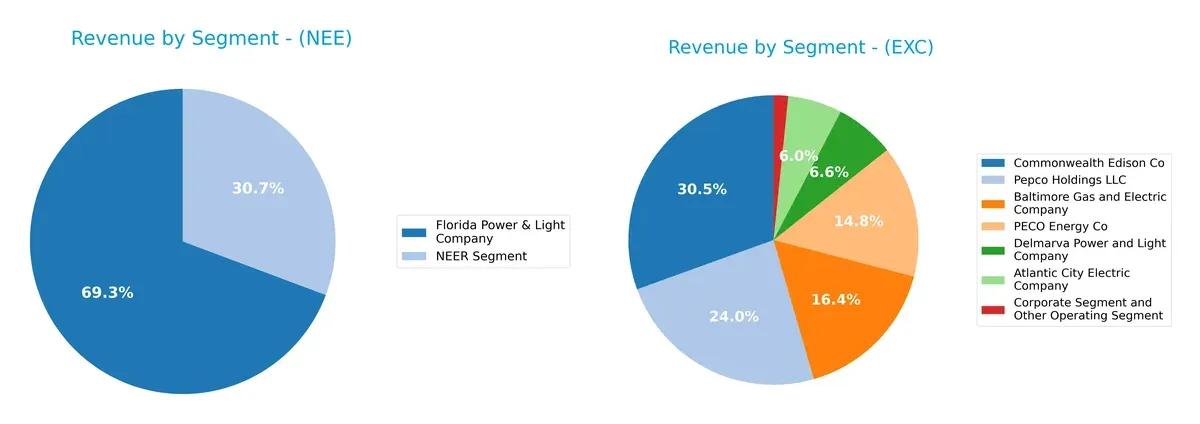
NextEra Energy anchors its revenue in Florida Power & Light Company at $17B, with a significant $7.5B from NEER Segment. Exelon diversifies more broadly, with no single segment surpassing $8.2B. Its largest is Commonwealth Edison at $8.2B, followed by Pepco Holdings at $6.4B. NextEra’s concentration in a few core segments signals strong regional dominance but risks tied to Florida’s market. Exelon’s spread across multiple utilities reduces concentration risk and emphasizes infrastructure breadth.
Strengths and Weaknesses Comparison
This table compares the Strengths and Weaknesses of NextEra Energy, Inc. and Exelon Corporation:
NextEra Energy, Inc. Strengths
- High net margin at 28.06%
- Favorable WACC at 6.4%
- Strong dividend yield of 2.87%
- Significant revenue from Florida Power & Light, a major segment
- Neutral ROE at 13.86%
- Diverse energy segments including renewable resources
Exelon Corporation Strengths
- Favorable net margin at 10.68%
- Favorable WACC at 5.04%
- Higher dividend yield of 4.04%
- Favorable price-to-book ratio at 1.4
- Diverse revenue streams across multiple utilities
- Neutral interest coverage ratio at 2.39
NextEra Energy, Inc. Weaknesses
- Unfavorable ROIC at 4.04% below WACC
- Low current ratio at 0.47 and quick ratio at 0.38 indicate liquidity risk
- High debt-to-equity ratio at 1.64
- Unfavorable interest coverage at 1.99
- Low asset and fixed asset turnover ratios
- Slightly unfavorable overall financial ratios
Exelon Corporation Weaknesses
- Unfavorable ROE at 9.14% and ROIC at 3.93%
- Low current ratio at 0.87 and quick ratio at 0.78 suggest liquidity concerns
- High debt-to-equity ratio at 1.73
- Unfavorable asset and fixed asset turnover ratios
- Slightly unfavorable overall financial ratios
Both companies show strengths in profitability and dividend yield but face liquidity and asset efficiency challenges. Their capital structures carry risk, influencing strategic focus on improving operational efficiency and balance sheet health.
The Moat Duel: Analyzing Competitive Defensibility
A structural moat shields long-term profits from relentless competition and market pressures. Here’s how NextEra Energy and Exelon Corporation stack up:
NextEra Energy, Inc.: Capital Intensity with Declining Efficiency
NextEra’s primary moat lies in its capital-intensive renewable infrastructure, supporting high gross margins (63%) and stable net margins (25%). Yet, its ROIC fell below WACC by 2.4%, signaling shrinking value creation in 2020-24. New clean energy projects could deepen the moat if operational efficiency improves.
Exelon Corporation: Improving Operational Efficiency Amid Legacy Assets
Exelon leverages a diversified generation portfolio with nuclear and renewables, showing a modest moat via rising ROIC (+100% trend) despite still trailing WACC by 1.1%. Its gross margin (41%) and net margin (11%) are lower than NextEra’s, but growing profitability suggests a strengthening moat, supported by operational improvements and market expansion.
Capital Efficiency vs. Growth Trajectory: Who Defends Better?
NextEra’s wider moat rests on scale and margin dominance but suffers from declining capital efficiency. Exelon’s narrower moat is shallower but improving through rising ROIC and operational gains. I believe Exelon is better positioned to defend market share as it reverses value destruction trends more convincingly.
Which stock offers better returns?
The past year shows strong price gains for both stocks, with NextEra Energy displaying a notably higher appreciation, while recent trading reveals a mild slowdown and shifting buyer-seller dynamics.
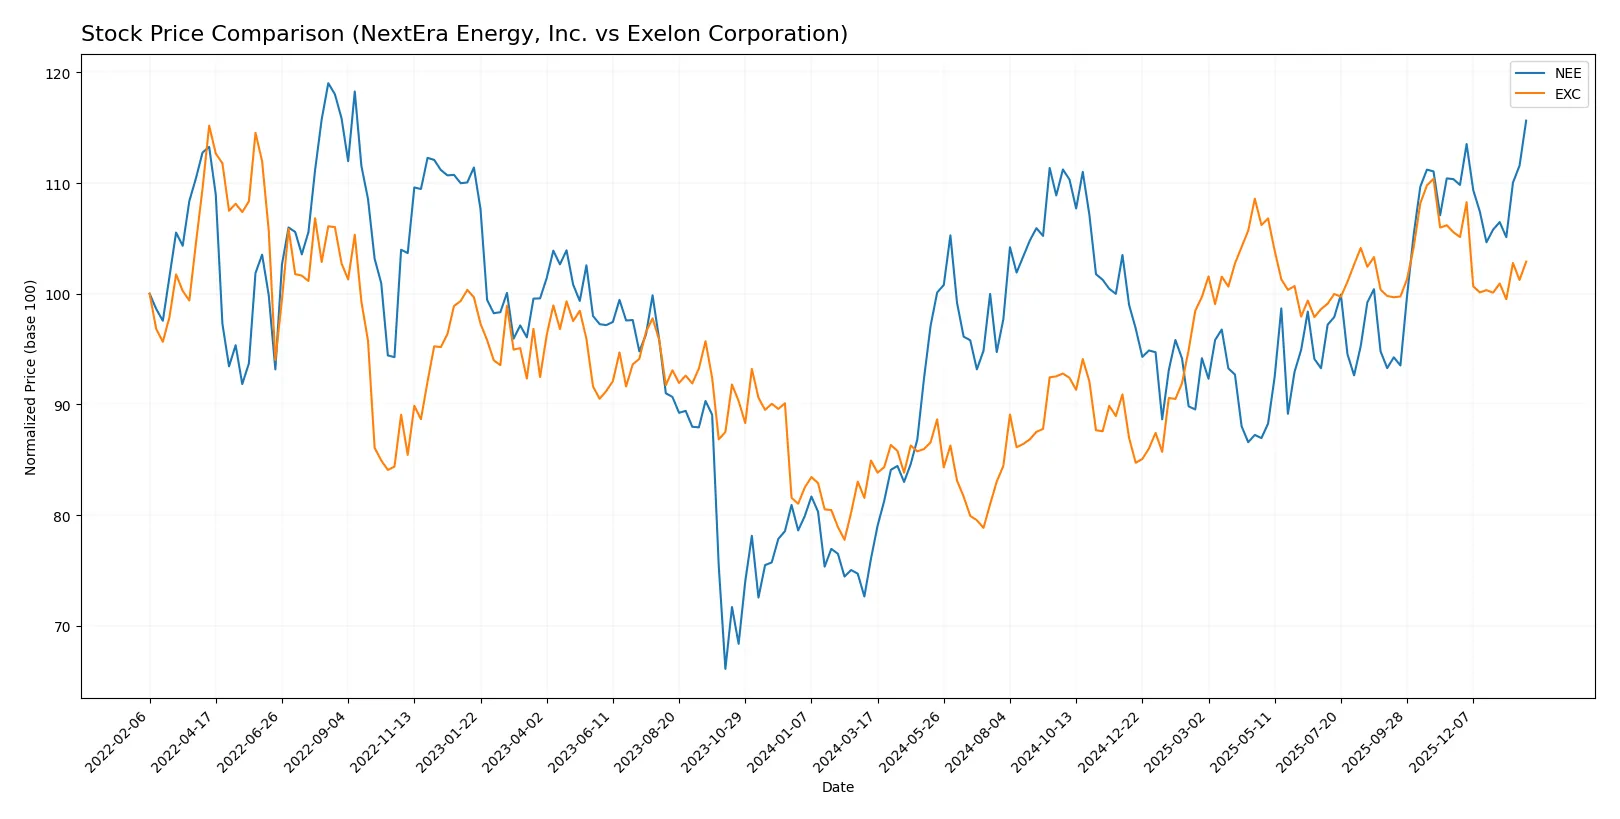
Trend Comparison
NextEra Energy’s stock rose 52.05% over the last 12 months, marking a bullish trend with decelerating momentum. It peaked at 87.9 and bottomed at 57.81, showing moderate volatility (6.42 std deviation).
Exelon’s stock gained 21.16% over the same period, also bullish but with deceleration. Its price ranged between 34.31 and 48.04, exhibiting lower volatility (3.67 std deviation). Recent months show a slight bearish pullback.
NextEra outperformed Exelon by delivering the highest total return despite decelerating momentum, while Exelon’s trend is less robust and recently turned negative.
Target Prices
Analysts present a balanced target price consensus for both NextEra Energy and Exelon, reflecting moderate upside potential.
| Company | Target Low | Target High | Consensus |
|---|---|---|---|
| NextEra Energy, Inc. | 84 | 104 | 93.09 |
| Exelon Corporation | 39 | 57 | 50.5 |
NextEra’s consensus target of 93.09 suggests a modest 6% upside from the current 87.9 price. Exelon’s 50.5 target implies about 13% potential gain versus its 44.78 price.

Don’t Let Luck Decide Your Entry Point
Optimize your entry points with our advanced ProRealTime indicators. You’ll get efficient buy signals with precise price targets for maximum performance. Start outperforming now!
How do institutions grade them?
The following summarizes institutional grades for NextEra Energy, Inc. and Exelon Corporation:
NextEra Energy, Inc. Grades
This table shows recent grades from recognized financial institutions for NextEra Energy, Inc.:
| Grading Company | Action | New Grade | Date |
|---|---|---|---|
| Mizuho | Maintain | Neutral | 2026-01-28 |
| Argus Research | Maintain | Buy | 2026-01-28 |
| BMO Capital | Maintain | Outperform | 2026-01-27 |
| Wells Fargo | Maintain | Overweight | 2026-01-20 |
| Barclays | Maintain | Equal Weight | 2026-01-15 |
| Jefferies | Maintain | Hold | 2025-12-31 |
| UBS | Maintain | Buy | 2025-12-17 |
| JP Morgan | Maintain | Overweight | 2025-12-11 |
| BMO Capital | Maintain | Outperform | 2025-12-10 |
| UBS | Maintain | Buy | 2025-12-10 |
Exelon Corporation Grades
This table shows recent grades from recognized financial institutions for Exelon Corporation:
| Grading Company | Action | New Grade | Date |
|---|---|---|---|
| Jefferies | Maintain | Buy | 2026-01-27 |
| Barclays | Maintain | Overweight | 2026-01-22 |
| Wells Fargo | Maintain | Overweight | 2026-01-20 |
| UBS | Maintain | Neutral | 2025-12-17 |
| JP Morgan | Maintain | Neutral | 2025-12-12 |
| Morgan Stanley | Maintain | Equal Weight | 2025-10-22 |
| Keybanc | Maintain | Underweight | 2025-10-15 |
| Jefferies | Maintain | Buy | 2025-10-15 |
| Barclays | Maintain | Overweight | 2025-10-14 |
| UBS | Maintain | Neutral | 2025-10-10 |
Which company has the best grades?
NextEra Energy consistently receives stronger grades, including multiple “Buy,” “Outperform,” and “Overweight” ratings. Exelon shows more neutral and mixed ratings, which may signal less enthusiasm from analysts. Investors might interpret NextEra as having a more favorable outlook.
Risks specific to each company
The following categories identify the critical pressure points and systemic threats facing both firms in the 2026 market environment:
1. Market & Competition
NextEra Energy, Inc.
- Dominates with a large clean energy portfolio and long-term contracted assets, but faces intense renewable competition.
Exelon Corporation
- Diverse generation mix including nuclear and fossil fuels, exposed to shifting energy demands and competitive wholesale markets.
2. Capital Structure & Debt
NextEra Energy, Inc.
- High debt-to-equity ratio (1.64) and low interest coverage (1.99) indicate financial leverage risks.
Exelon Corporation
- Slightly higher debt-to-equity (1.73) but better interest coverage (2.39) suggests moderate financial risk.
3. Stock Volatility
NextEra Energy, Inc.
- Beta at 0.733 shows moderate sensitivity to market swings, offering some defensive qualities.
Exelon Corporation
- Lower beta of 0.556 reflects more stable price movements amid market fluctuations.
4. Regulatory & Legal
NextEra Energy, Inc.
- Faces regulatory pressure on fossil fuel assets and renewable integration mandates.
Exelon Corporation
- Nuclear operations expose it to stringent regulatory oversight and potential legal liabilities.
5. Supply Chain & Operations
NextEra Energy, Inc.
- Complex supply chain for renewables and battery storage may pose operational risks.
Exelon Corporation
- Diverse fuel sources increase supply chain complexity but benefit from integrated utility operations.
6. ESG & Climate Transition
NextEra Energy, Inc.
- Leading in clean energy investments but must manage transition risks from legacy fossil assets.
Exelon Corporation
- Strong nuclear presence aids low-carbon profile but faces public and regulatory scrutiny on safety.
7. Geopolitical Exposure
NextEra Energy, Inc.
- Primarily US-focused with limited international exposure, reducing geopolitical risk.
Exelon Corporation
- Operates in US and Canada, moderately increasing exposure to cross-border regulatory dynamics.
Which company shows a better risk-adjusted profile?
NextEra’s biggest risk lies in its stretched capital structure and low liquidity ratios, raising solvency concerns. Exelon faces significant regulatory and operational risks from its nuclear fleet but benefits from a slightly better financial cushion. Despite both showing signs of financial distress (Altman Z-scores in distress zone), Exelon’s superior interest coverage and lower stock volatility suggest a marginally better risk-adjusted profile. I note Exelon’s improved interest coverage (2.39 vs. 1.99) as a decisive factor easing debt servicing pressures.
Final Verdict: Which stock to choose?
NextEra Energy, Inc. (NEE) excels as a cash-generating powerhouse with robust income growth and a strong dividend yield. Its main point of vigilance is a stretched liquidity position, signaling potential operational risks. It suits investors seeking aggressive growth with a tolerance for balance sheet pressure.
Exelon Corporation (EXC) offers a strategic moat through its steady cash flow and more conservative capital structure. Compared to NEE, it provides a safer profile with a higher dividend yield and moderate valuation. This stock fits well in a GARP (Growth at a Reasonable Price) portfolio aiming for balanced risk and reward.
If you prioritize aggressive growth and cash flow expansion, NextEra Energy outshines due to its superior income momentum despite liquidity concerns. However, if you seek better stability and a safer balance sheet, Exelon offers a more measured approach with a growing profitability trend. Both present analytical scenarios tailored to distinct investor risk appetites.
Disclaimer: Investment carries a risk of loss of initial capital. The past performance is not a reliable indicator of future results. Be sure to understand risks before making an investment decision.
Go Further
I encourage you to read the complete analyses of NextEra Energy, Inc. and Exelon Corporation to enhance your investment decisions: