Home > Comparison > Utilities > XEL vs ES
The strategic rivalry between Xcel Energy Inc. and Eversource Energy shapes the regulated electric utility landscape in the U.S. Xcel operates a diversified generation portfolio across multiple states, combining traditional and renewable assets. Eversource focuses on electric and natural gas distribution in the Northeast, with integrated water services. This analysis contrasts their operational models to identify which offers the superior risk-adjusted return potential for a diversified utility portfolio.
Table of contents
Companies Overview
Xcel Energy and Eversource Energy stand as key players in the regulated electric utility market, shaping regional energy landscapes.
Xcel Energy Inc.: Diversified Power Producer
Xcel Energy operates as a regulated electric utility with a diverse energy portfolio including coal, nuclear, natural gas, and renewables. Its core revenue comes from generating and distributing electricity and natural gas to over 5.8M customers across eight states. In 2026, the company focuses on expanding renewable generation facilities while maintaining stable utility operations.
Eversource Energy: Regional Energy Delivery Leader
Eversource Energy is a public utility holding company primarily engaged in electricity and natural gas transmission and distribution. It serves residential and commercial clients in three northeastern states, also operating regulated water utilities. Its 2026 strategy centers on enhancing grid reliability and integrating solar power facilities to support sustainable energy delivery.
Strategic Collision: Similarities & Divergences
Both firms compete within regulated electric utilities, yet Xcel embraces a broader energy mix including renewables, while Eversource concentrates on regional infrastructure and water services. Their battle for market share unfolds over grid modernization and renewable integration. Xcel’s diversified energy base contrasts with Eversource’s focused regional delivery, crafting distinct risk and growth profiles for investors.
Income Statement Comparison
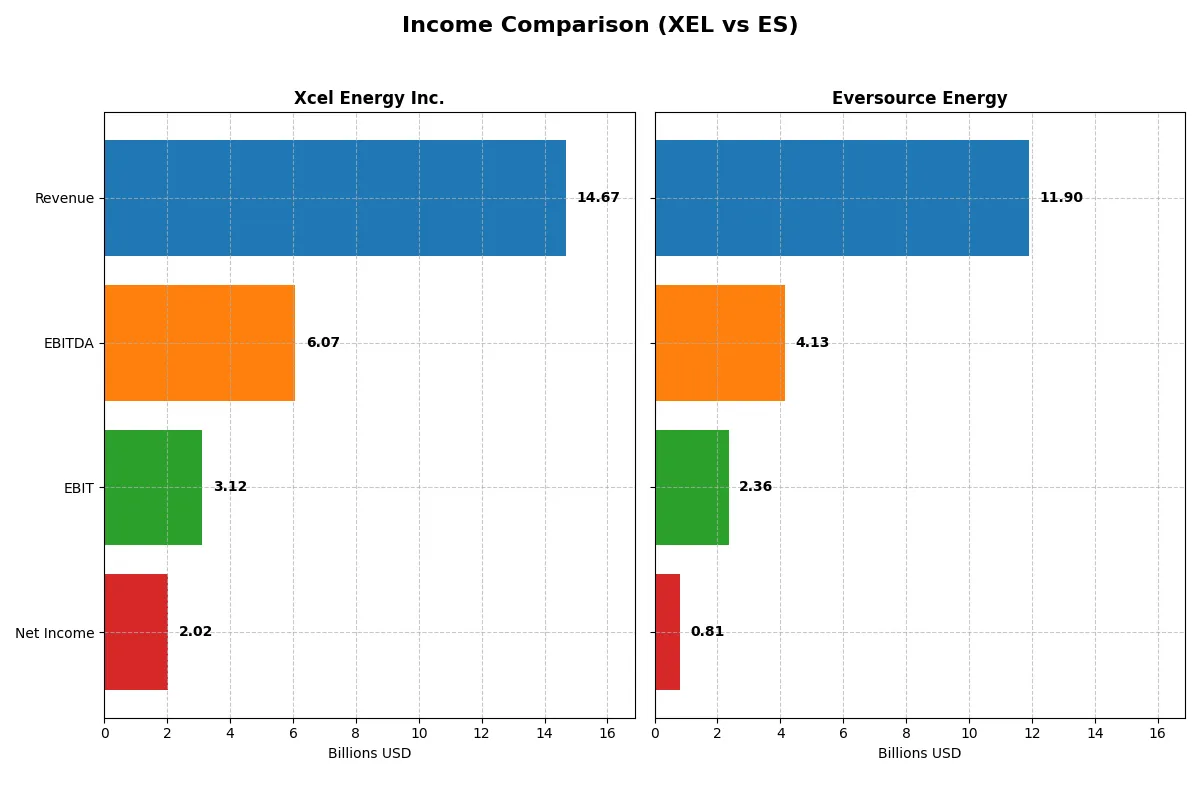
This data dissects the core profitability and scalability of both corporate engines to reveal who dominates the bottom line:
| Metric | Xcel Energy Inc. (XEL) | Eversource Energy (ES) |
|---|---|---|
| Revenue | 14.67B | 11.90B |
| Cost of Revenue | 11.10B | 8.20B |
| Operating Expenses | 686M | 998M |
| Gross Profit | 3.57B | 3.70B |
| EBITDA | 6.07B | 4.13B |
| EBIT | 3.12B | 2.36B |
| Interest Expense | 1.34B | 1.11B |
| Net Income | 2.02B | 812M |
| EPS | 3.44 | 2.27 |
| Fiscal Year | 2025 | 2024 |
Income Statement Analysis: The Bottom-Line Duel
This income statement comparison reveals which company operates with superior efficiency and delivers stronger profitability through its core business engine.
Xcel Energy Inc. Analysis
Xcel Energy’s revenue grew steadily to $14.7B in 2025, with net income rising to $2.02B. Its gross margin contracted sharply in 2025 but remains solid at 24.3%, supporting a healthy net margin of 13.8%. The company’s EBIT margin of 21.2% signals robust operational efficiency and sustained momentum in profitability.
Eversource Energy Analysis
Eversource’s revenue hovered around $11.9B in 2024 with net income rebounding to $812M after a prior loss. Its gross margin of 31.1% outshines Xcel’s, though the net margin lags at 6.8%. Despite a volatile recent year, Eversource’s EBIT margin of 19.8% and strong EBIT growth demonstrate improving operational leverage.
Margin Strength vs. Earnings Scale
Xcel Energy clearly leads in net income scale and margin consistency, delivering stronger overall profitability and margin expansion over five years. Eversource shows higher gross margin and recent earnings recovery but struggles with net margin stability. For investors prioritizing steady earnings and margin resilience, Xcel’s profile offers greater fundamental strength.
Financial Ratios Comparison
These vital ratios act as a diagnostic tool to expose the underlying fiscal health, valuation premiums, and capital efficiency of the companies analyzed below:
| Ratios | Xcel Energy Inc. (XEL) | Eversource Energy (ES) |
|---|---|---|
| ROE | 9.9% (2024) | 5.4% (2024) |
| ROIC | 3.6% (2024) | 3.2% (2024) |
| P/E | 19.6 (2024) | 25.3 (2024) |
| P/B | 1.95 (2024) | 1.37 (2024) |
| Current Ratio | 0.67 (2024) | 0.76 (2024) |
| Quick Ratio | 0.57 (2024) | 0.67 (2024) |
| D/E | 1.55 (2024) | 1.94 (2024) |
| Debt-to-Assets | 43.1% (2024) | 48.9% (2024) |
| Interest Coverage | 2.02 (2024) | 2.43 (2024) |
| Asset Turnover | 0.19 (2024) | 0.20 (2024) |
| Fixed Asset Turnover | 0.23 (2024) | 0.29 (2024) |
| Payout Ratio | 61% (2024) | 124% (2024) |
| Dividend Yield | 3.1% (2024) | 4.9% (2024) |
| Fiscal Year | 2024 | 2024 |
Efficiency & Valuation Duel: The Vital Signs
Financial ratios act as a company’s DNA, exposing hidden risks and operational strengths that shape investor decisions.
Xcel Energy Inc.
Xcel Energy shows a solid net margin of 13.76%, indicating efficient core profitability. Its P/E ratio of 21.48 suggests a fairly valued stock, neither too expensive nor cheap. The company returns value through a 3.83% dividend yield, signaling steady shareholder rewards rather than aggressive reinvestment strategies.
Eversource Energy
Eversource posts a lower net margin at 6.82%, reflecting weaker profitability. Its P/E ratio of 25.29 flags a stretched valuation, demanding caution. The firm offers a higher dividend yield of 4.91%, which compensates investors amid less efficient returns and elevated debt levels, as indicated by a debt-to-equity ratio of 1.94.
Valuation Balance vs. Profitability Edge
Xcel Energy balances valuation and profitability better, with stronger margins and a reasonable P/E ratio. Eversource’s higher dividend yield comes with greater risk due to stretched valuation and weaker returns. Investors favoring operational efficiency may prefer Xcel, while income seekers might lean toward Eversource.
Which one offers the Superior Shareholder Reward?
I compare Xcel Energy Inc. (XEL) and Eversource Energy (ES) on dividends, payout ratios, and buybacks. XEL yields 3.8% with a 82% payout ratio, signaling a strong but stretched dividend, while ES pays 4.9% with a 124% payout, risking sustainability. Both report negative free cash flow, but XEL’s payout aligns better with cash flow. Buybacks are more aggressive at XEL, enhancing total returns. Historically, utilities with balanced payouts and buybacks outperform peers over cycles. I conclude XEL offers a more sustainable, attractive total return profile in 2026.
Comparative Score Analysis: The Strategic Profile
The radar chart reveals the fundamental DNA and trade-offs of Xcel Energy Inc. and Eversource Energy, highlighting their financial strengths and weaknesses across key metrics:
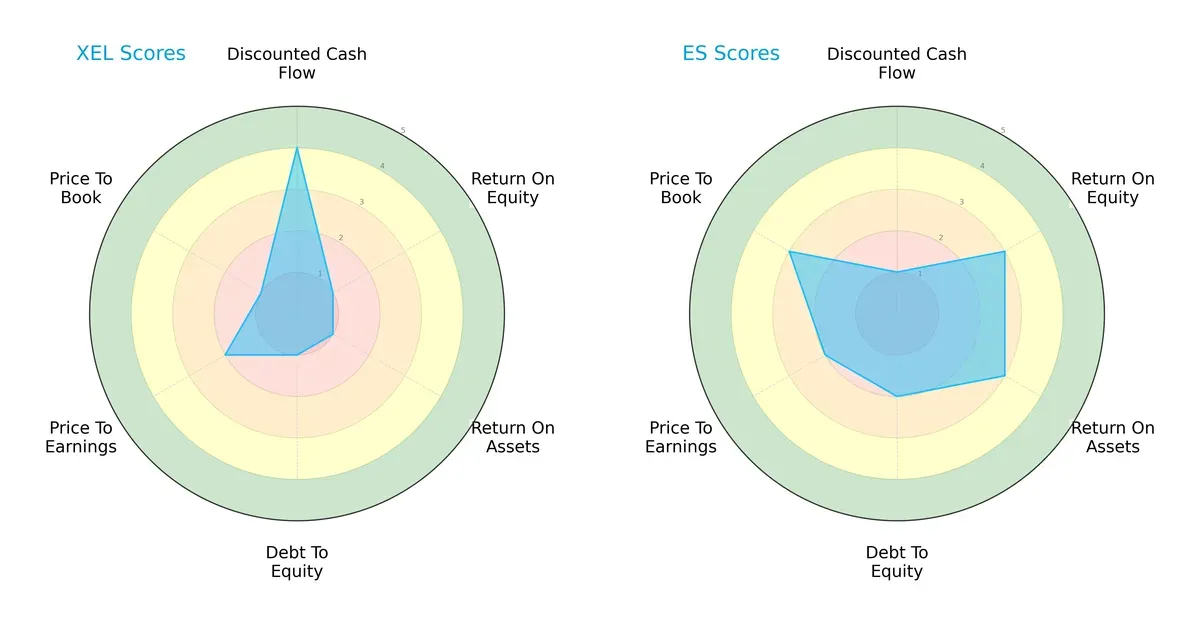
Xcel Energy leads in discounted cash flow with a favorable score of 4, signaling strong future cash generation potential. However, it struggles significantly with profitability and leverage, posting very unfavorable scores in ROE (1), ROA (1), and debt-to-equity (1). Eversource Energy presents a more balanced profile, with moderate scores in ROE (3), ROA (3), and a slightly better debt-to-equity score (2). Both companies have unfavorable overall scores (2) and price-to-earnings scores (2), though Eversource’s valuation metrics (price-to-book 3) outshine Xcel’s (1). Overall, Eversource displays a steadier financial footing, while Xcel relies heavily on its discounted cash flow strength.
—
Financial Health: Quality of Operations
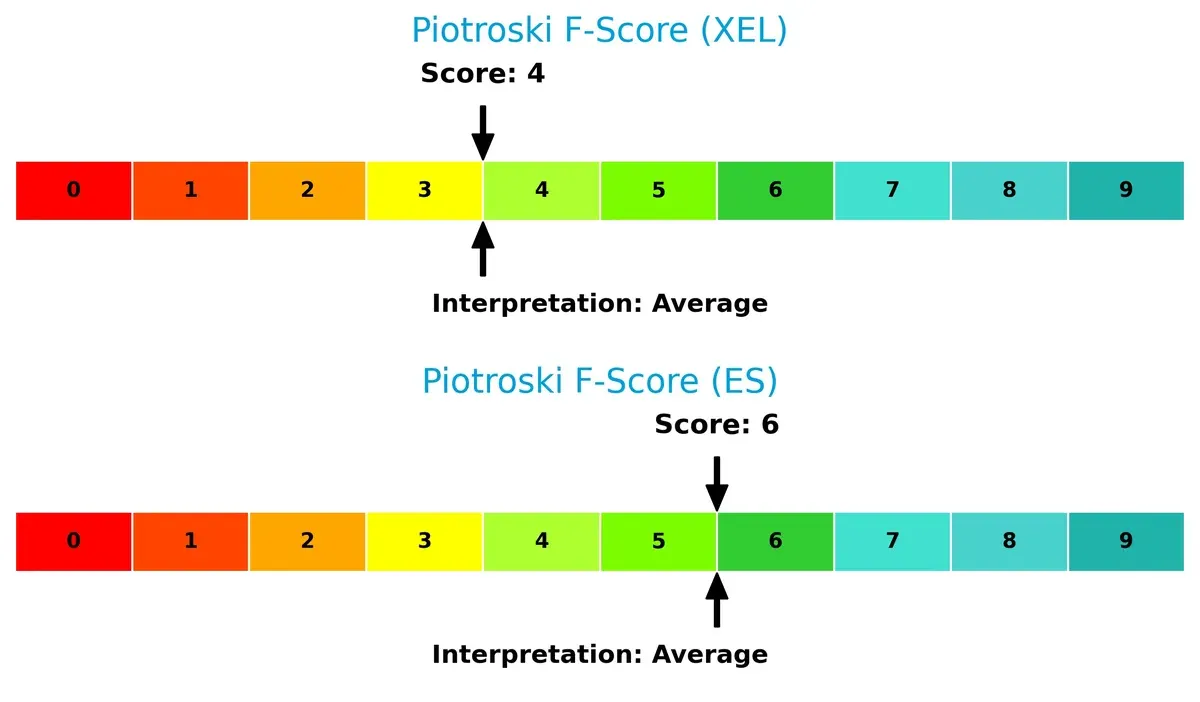
Eversource Energy’s Piotroski F-Score of 6 indicates solid financial health, outperforming Xcel Energy’s average score of 4. This suggests Eversource maintains better profitability, liquidity, and operational efficiency. Xcel’s lower score raises caution flags about internal financial metrics compared to Eversource:
How are the two companies positioned?
This section dissects Xcel Energy and Eversource’s operational DNA by comparing revenue distribution and internal dynamics. The goal: confront their economic moats to reveal the more resilient, sustainable competitive advantage.
Revenue Segmentation: The Strategic Mix
This visual comparison dissects how Xcel Energy Inc. and Eversource Energy diversify their income streams and reveals where their primary sector bets lie:
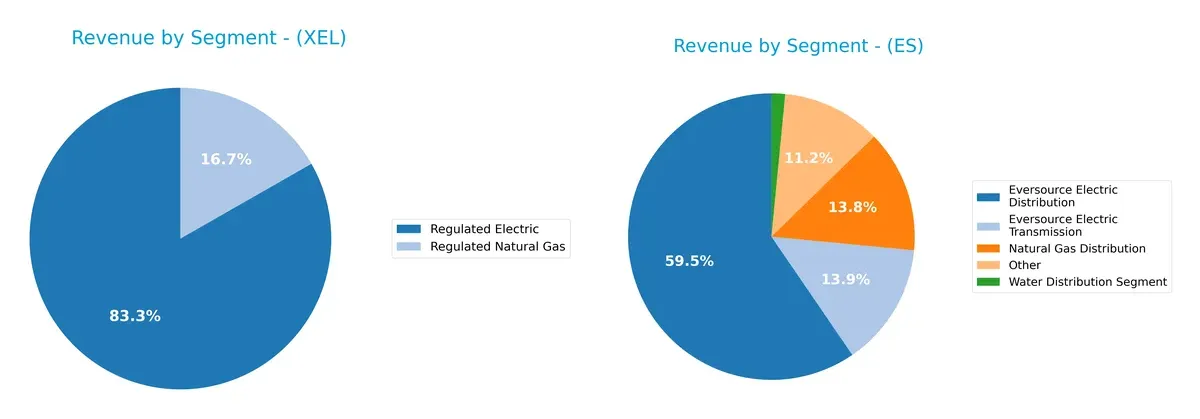
Xcel Energy anchors revenue in Regulated Electric at $22.3B, with a smaller $4.5B from Regulated Natural Gas, showing moderate diversification. Eversource spreads income more evenly across Electric Distribution ($9.1B), Electric Transmission ($2.1B), and Natural Gas Distribution ($2.1B), reducing concentration risk. Eversource’s broader base signals infrastructure dominance, while Xcel’s reliance on one segment poses potential vulnerability to sector shifts.
Strengths and Weaknesses Comparison
This table compares the Strengths and Weaknesses of Xcel Energy Inc. and Eversource Energy:
Xcel Energy Inc. Strengths
- Strong regulated electric and natural gas revenue base
- Favorable net margin of 13.76%
- Low debt-to-assets ratio
- Favorable dividend yield of 3.83%
- Neutral interest coverage ratio
Eversource Energy Strengths
- Diverse revenue segments including electric distribution, transmission, gas, and water
- Favorable WACC of 5.05% supports capital efficiency
- Positive PB ratio of 1.37 indicates market confidence
- Higher dividend yield of 4.91%
- Neutral interest coverage ratio
Xcel Energy Inc. Weaknesses
- Unfavorable ROE and ROIC at 0% indicate weak profitability returns
- Unavailable WACC complicates cost of capital assessment
- Poor liquidity ratios (current and quick ratio at 0)
- Unfavorable asset and fixed asset turnover ratios
- Slightly unfavorable overall ratio profile
Eversource Energy Weaknesses
- Unfavorable ROE (5.4%) and ROIC (3.18%) below cost of capital
- High debt-to-equity ratio of 1.94 signals leverage risk
- Unfavorable P/E ratio of 25.29 may indicate overvaluation
- Low liquidity ratios below 1 (current 0.76, quick 0.67)
- Unfavorable asset turnover ratios
- Overall unfavorable global ratio profile
Xcel Energy excels with a stronger profit margin and conservative leverage but suffers from weak returns and liquidity concerns. Eversource shows broader revenue diversification and efficient capital costs yet faces higher leverage, weaker profitability, and valuation risks. Both companies reveal areas for strategic focus on operational efficiency and balance sheet strength.
The Moat Duel: Analyzing Competitive Defensibility
A structural moat is the only thing protecting long-term profits from the erosion of competition. Let’s dissect how two utilities defend their turf:
Xcel Energy Inc.: Diversified Energy Asset Base
Xcel’s moat stems from its diverse generation mix and regulated customer base. It shows stable margins and solid revenue growth, though its ROIC trend is declining. Expansion in renewables could bolster its moat in 2026.
Eversource Energy: Regional Regulatory Insulation
Eversource relies on regulatory frameworks across New England, creating switching costs unlike Xcel’s broader footprint. Despite recent value destruction and falling ROIC, aggressive transmission upgrades offer potential market disruption.
Regulated Utility Footprint vs. Regional Regulation Lock-in
Xcel’s broader asset diversification grants it a wider moat than Eversource’s more concentrated regulatory protection. I believe Xcel is better positioned to sustain and grow profits amid evolving energy landscapes.
Which stock offers better returns?
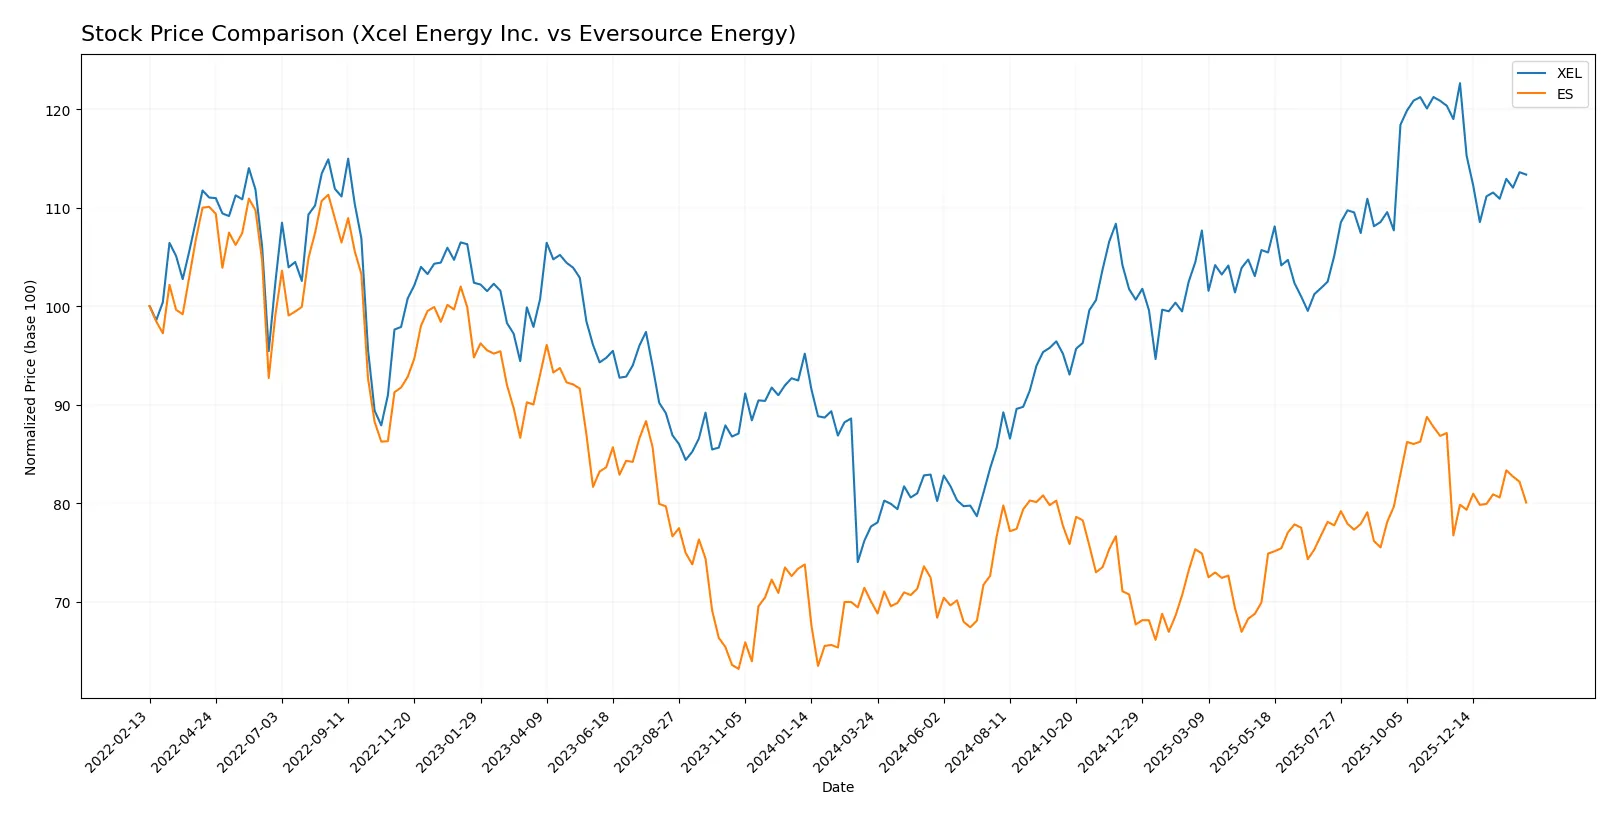
Over the past 12 months, Xcel Energy Inc. and Eversource Energy exhibited distinct price dynamics, with Xcel showing strong gains that decelerated recently, while Eversource’s growth accelerated steadily.
Trend Comparison
Xcel Energy Inc. posted a 46.0% price increase over the past year, indicating a bullish trend with decelerating momentum. Its price fluctuated between $52 and $82, showing substantial volatility (8.24 std deviation).
Eversource Energy gained 14.3% over the same period, maintaining a bullish trend with accelerating momentum. Its price ranged from $56 to $75, with moderate volatility (4.57 std deviation).
Xcel Energy delivered the highest market performance, outperforming Eversource by a wide margin despite recent short-term weakness.
Target Prices
Analysts present a moderately bullish consensus for Xcel Energy Inc. and Eversource Energy.
| Company | Target Low | Target High | Consensus |
|---|---|---|---|
| Xcel Energy Inc. | 81 | 95 | 88 |
| Eversource Energy | 60 | 81 | 69.6 |
Xcel Energy’s consensus target of 88 exceeds its current price of 75.9, implying upside potential. Eversource Energy’s consensus at 69.6 slightly surpasses its 67.36 market price, indicating modest expected gains.

Don’t Let Luck Decide Your Entry Point
Optimize your entry points with our advanced ProRealTime indicators. You’ll get efficient buy signals with precise price targets for maximum performance. Start outperforming now!
How do institutions grade them?
The following tables summarize recent institutional grades for both companies:
Xcel Energy Inc. Grades
Here are the latest grades assigned by reputable financial institutions for Xcel Energy Inc.:
| Grading Company | Action | New Grade | Date |
|---|---|---|---|
| Barclays | maintain | Overweight | 2026-01-15 |
| UBS | maintain | Neutral | 2025-12-17 |
| Keybanc | maintain | Overweight | 2025-12-12 |
| JP Morgan | maintain | Overweight | 2025-12-11 |
| Barclays | maintain | Overweight | 2025-11-05 |
| Citigroup | maintain | Buy | 2025-11-03 |
| UBS | maintain | Neutral | 2025-10-31 |
| Mizuho | maintain | Outperform | 2025-10-27 |
| Jefferies | maintain | Buy | 2025-10-16 |
| Keybanc | maintain | Overweight | 2025-10-15 |
Eversource Energy Grades
Below are recent institutional grades for Eversource Energy from recognized firms:
| Grading Company | Action | New Grade | Date |
|---|---|---|---|
| UBS | maintain | Neutral | 2025-12-17 |
| JP Morgan | maintain | Underweight | 2025-12-12 |
| Janney Montgomery Scott | upgrade | Buy | 2025-11-24 |
| Scotiabank | maintain | Sector Underperform | 2025-11-20 |
| Mizuho | downgrade | Neutral | 2025-11-20 |
| Wells Fargo | downgrade | Equal Weight | 2025-11-20 |
| Scotiabank | maintain | Sector Underperform | 2025-11-06 |
| BMO Capital | maintain | Market Perform | 2025-11-06 |
| UBS | downgrade | Neutral | 2025-11-06 |
| Mizuho | maintain | Outperform | 2025-10-27 |
Which company has the best grades?
Xcel Energy consistently receives favorable grades such as Overweight, Buy, and Outperform. Eversource Energy’s ratings are more mixed, with notable downgrades and several Neutral or Underweight assessments. Investors may view Xcel Energy’s stronger grades as a sign of greater institutional confidence.
Risks specific to each company
The following categories identify critical pressure points and systemic threats facing Xcel Energy Inc. and Eversource Energy in the 2026 market environment:
1. Market & Competition
Xcel Energy Inc.
- Serves 3.7M electricity and 2.1M natural gas customers across multiple states, diversifying market risk.
Eversource Energy
- Focused on Northeast markets with 226K water customers, limiting geographic diversification but strong regional presence.
2. Capital Structure & Debt
Xcel Energy Inc.
- Favorable debt-to-equity stance; low leverage reduces financial risk.
Eversource Energy
- High debt-to-equity ratio (1.94) signals elevated leverage and refinancing risk.
3. Stock Volatility
Xcel Energy Inc.
- Beta of 0.48 indicates low stock volatility, appealing for risk-averse investors.
Eversource Energy
- Beta of 0.79 suggests moderate volatility, exposing shareholders to higher market swings.
4. Regulatory & Legal
Xcel Energy Inc.
- Operates in multiple regulated states, increasing regulatory complexity but reducing dependency on one jurisdiction.
Eversource Energy
- Concentrated in three states, regulatory changes could disproportionately impact earnings.
5. Supply Chain & Operations
Xcel Energy Inc.
- Diverse energy sources (coal, nuclear, renewables) mitigate operational disruptions.
Eversource Energy
- Heavy reliance on regulated distribution networks may limit operational flexibility.
6. ESG & Climate Transition
Xcel Energy Inc.
- Invests in renewables and pipelines, balancing legacy assets with green transition risks.
Eversource Energy
- Operates solar facilities but faces pressure to accelerate decarbonization amid Northeast climate policies.
7. Geopolitical Exposure
Xcel Energy Inc.
- Primarily U.S.-based with exposure to regional economic cycles; limited international risk.
Eversource Energy
- Also U.S.-centric with regional economic risk concentrated in New England states.
Which company shows a better risk-adjusted profile?
Xcel Energy’s strongest risk lies in regulatory complexity across many states, demanding agile compliance. Eversource’s biggest threat is its heavy debt load, increasing financial vulnerability. Xcel’s lower leverage and stock volatility give it a superior risk-adjusted profile. Notably, Eversource’s distress-zone Altman Z-score signals heightened bankruptcy risk, justifying investor caution.
Final Verdict: Which stock to choose?
Xcel Energy Inc. (XEL) stands out with its superpower of consistent income growth and a strong dividend yield, making it a reliable cash generator. However, its declining ROIC and tight liquidity ratios signal a point of vigilance. XEL suits portfolios aiming for stable income with moderate growth exposure.
Eversource Energy (ES) leverages a strategic moat rooted in steady operating returns and a solid capital structure, despite a higher debt load. Compared to XEL, ES shows more recent price acceleration but carries more financial risk. It fits well within GARP portfolios seeking measured growth with some defensive cushioning.
If you prioritize steady income and a proven track record of value creation, XEL is the compelling choice due to its favorable income growth and dividend profile. However, if you seek growth with some margin of safety and can tolerate financial leverage, ES offers better stability through operational efficiency and recent price momentum. Both require close monitoring of their leverage and cash flow trends.
Disclaimer: Investment carries a risk of loss of initial capital. The past performance is not a reliable indicator of future results. Be sure to understand risks before making an investment decision.
Go Further
I encourage you to read the complete analyses of Xcel Energy Inc. and Eversource Energy to enhance your investment decisions: