WEC Energy Group, Inc. and Eversource Energy are two prominent players in the regulated electric utility sector in the United States. Both companies focus on electricity and natural gas distribution while actively incorporating renewable energy sources into their portfolios. Their overlapping markets and commitment to innovation make them ideal candidates for comparison. In this article, I will analyze which company presents the most compelling investment opportunity for your portfolio.
Table of contents
Companies Overview
I will begin the comparison between WEC Energy Group and Eversource Energy by providing an overview of these two companies and their main differences.
WEC Overview
WEC Energy Group, Inc. operates in the regulated electric industry, providing natural gas and electricity, along with renewable and nonregulated renewable energy services in the US. The company manages extensive infrastructure, including overhead and underground distribution lines, substations, and natural gas storage. Headquartered in Milwaukee, Wisconsin, WEC focuses on a diversified energy mix including coal, natural gas, hydroelectric, wind, solar, and biomass.
ES Overview
Eversource Energy is a public utility holding company engaged in energy delivery, offering electric distribution and transmission, natural gas distribution, and water services. It serves residential, commercial, and municipal customers primarily in Connecticut, Massachusetts, and New Hampshire. Based in Springfield, Massachusetts, Eversource also operates solar power facilities and regulated water utilities, emphasizing regional energy and water distribution.
Key similarities and differences
Both WEC and Eversource operate in the regulated electric sector with integrated electric and natural gas services, focusing on energy delivery to diverse customer bases. WEC has a broader renewable energy portfolio and extensive infrastructure across multiple states, while Eversource includes water distribution services and operates primarily in three Northeastern states. Each company emphasizes regulated utility operations but differs in geographic focus and service diversification.
Income Statement Comparison
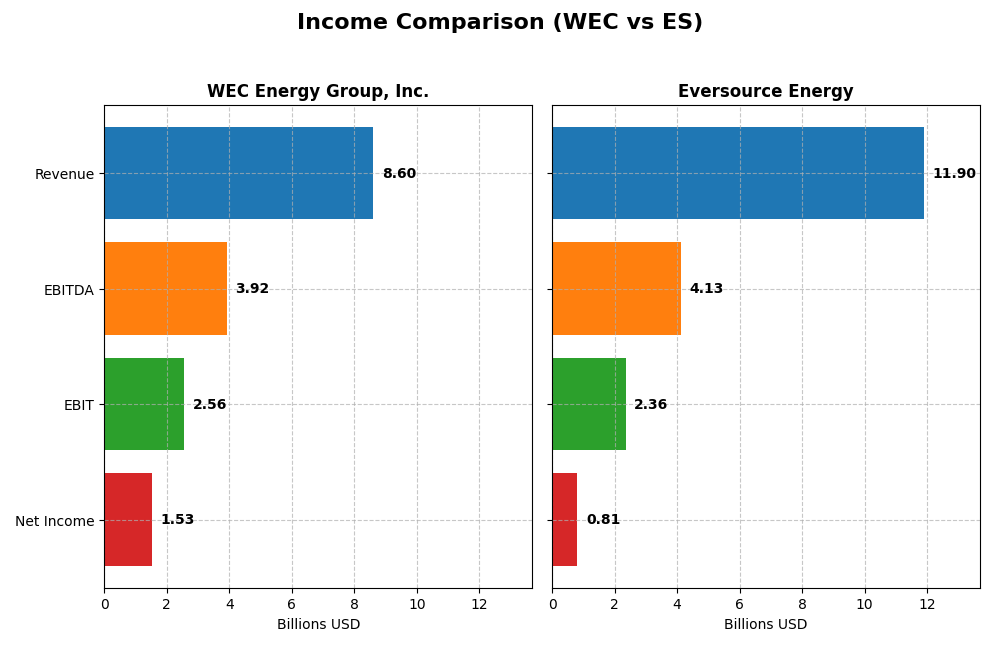
This table presents the key income statement metrics for WEC Energy Group, Inc. and Eversource Energy, reflecting their most recent fiscal year performance for 2024.
| Metric | WEC Energy Group, Inc. | Eversource Energy |
|---|---|---|
| Market Cap | 33.5B | 25.0B |
| Revenue | 8.60B | 11.90B |
| EBITDA | 3.92B | 4.13B |
| EBIT | 2.56B | 2.36B |
| Net Income | 1.53B | 812M |
| EPS | 4.81 | 2.27 |
| Fiscal Year | 2024 | 2024 |
Income Statement Interpretations
WEC Energy Group, Inc.
WEC Energy Group showed overall revenue growth of 18.76% from 2020 to 2024, despite a slight 3.3% revenue decline in 2024. Net income grew by 27.25% overall, with a net margin increase of 7.15%. The 2024 year featured improved gross profit (+5.13%) and EBIT (+13.18%), indicating margin expansion and operating efficiency gains despite the revenue dip.
Eversource Energy
Eversource Energy experienced a 33.65% revenue increase over the five-year span but saw a marginal 0.08% revenue decline in 2024. Net income trends were negative overall, down 32.65%, with a significant net margin contraction of 49.61%. However, 2024 showed strong EBIT growth (+305.78%) and net margin improvement (+283.68%), driven by cost controls and operational adjustments.
Which one has the stronger fundamentals?
WEC Energy Group exhibits more consistent profitability improvements with favorable margin growth and stable net income increases over the period. Eversource’s revenue growth contrasts with its declining net income and margin erosion long term, despite a strong rebound in 2024. WEC’s balanced margin expansion and earnings growth suggest comparatively stronger fundamentals.
Financial Ratios Comparison
The table below presents a side-by-side comparison of key financial ratios for WEC Energy Group, Inc. and Eversource Energy, based on their most recent fiscal year 2024 data.
| Ratios | WEC Energy Group, Inc. | Eversource Energy |
|---|---|---|
| ROE | 12.3% | 5.4% |
| ROIC | 4.1% | 3.2% |
| P/E | 19.5 | 25.3 |
| P/B | 2.39 | 1.37 |
| Current Ratio | 0.60 | 0.76 |
| Quick Ratio | 0.43 | 0.67 |
| D/E | 1.64 | 1.94 |
| Debt-to-Assets | 42.9% | 48.9% |
| Interest Coverage | 2.64 | 2.43 |
| Asset Turnover | 0.18 | 0.20 |
| Fixed Asset Turnover | 0.25 | 0.29 |
| Payout ratio | 69.1% | 124.3% |
| Dividend yield | 3.55% | 4.91% |
Interpretation of the Ratios
WEC Energy Group, Inc.
WEC shows a mixed ratio profile with strengths in net margin (17.77%, favorable) and dividend yield (3.55%, favorable), but weaknesses in liquidity (current ratio 0.6, unfavorable) and asset turnover (0.18, unfavorable). The debt-to-equity ratio is elevated at 1.64 (unfavorable), suggesting leverage concerns. Dividend payouts appear sustainable given the positive yield and stable coverage, but free cash flow to equity is negative, indicating caution.
Eversource Energy
Eversource presents several unfavorable ratios, including return on equity (5.4%) and price-to-earnings at 25.29 (both unfavorable), indicating lower profitability and higher valuation risk. Liquidity ratios remain below 1.0, reflecting potential short-term constraints. Dividend yield is higher at 4.91%, favorable, but free cash flow to equity is negative, suggesting dividends may rely on funding sources beyond operational cash flow.
Which one has the best ratios?
WEC Energy Group exhibits a slightly unfavorable overall ratio profile but has more favorable profitability and dividend metrics than Eversource. Eversource’s higher proportion of unfavorable ratios, including weaker returns and cash flow challenges, weighs against it. Based solely on ratio evaluations, WEC appears to maintain a relatively stronger financial position.
Strategic Positioning
This section compares the strategic positioning of WEC Energy Group and Eversource Energy, focusing on market position, key segments, and exposure to technological disruption:
WEC Energy Group, Inc.
- Leading regulated electric utility with strong presence in Wisconsin and Illinois, facing moderate competition.
- Diversified segments: Wisconsin, Illinois, Other States, Non-Utility Energy Infrastructure driving revenue growth.
- Operating with traditional and renewable energy sources including hydroelectric, wind, solar, biomass; no explicit disruption risk detailed.
Eversource Energy
- Regulated utility serving Connecticut, Massachusetts, New Hampshire with competitive pressures in multiple states.
- Concentrated on electric distribution, transmission, natural gas, and water distribution segments.
- Involved in solar power facilities and regulated water utilities; technological disruption exposure not specified.
WEC Energy Group, Inc. vs Eversource Energy Positioning
WEC exhibits a diversified geographic and business segment approach with multiple states and energy infrastructure, while Eversource has a more concentrated regional focus with integrated electric, gas, and water services. WEC’s broader footprint contrasts with Eversource’s specialization.
Which has the best competitive advantage?
Based on MOAT evaluation, WEC shows a slightly unfavorable moat with growing profitability, while Eversource has a very unfavorable moat with declining profitability. WEC currently holds a more favorable competitive advantage despite value destruction.
Stock Comparison
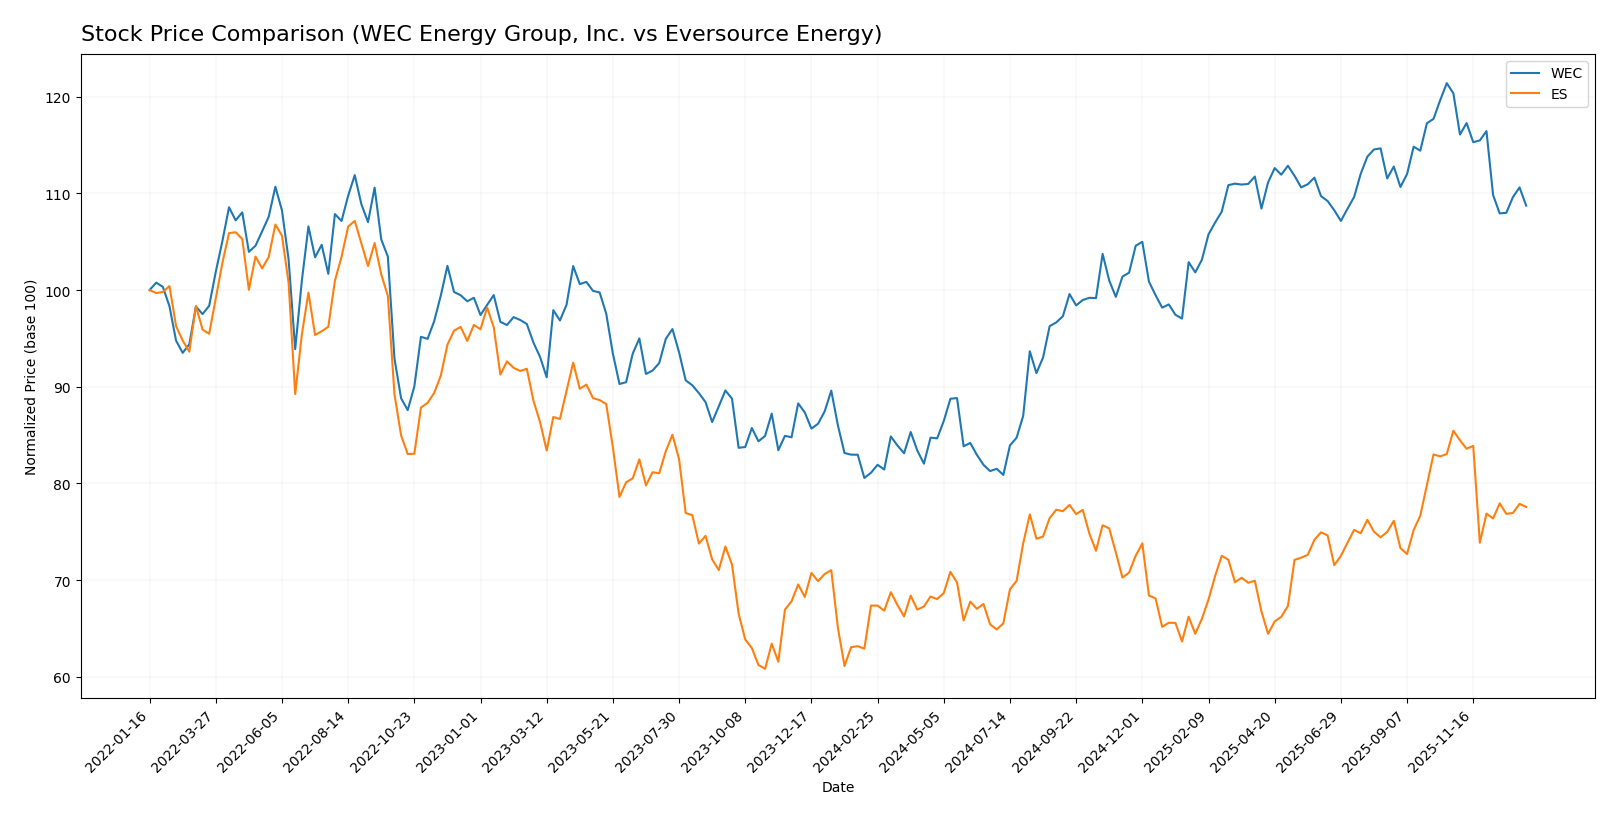
The stock price movements for WEC Energy Group, Inc. and Eversource Energy over the past 12 months reveal notable bullish trends with decelerating momentum, despite recent downward pressure from October 2025 to January 2026.
Trend Analysis
WEC Energy Group, Inc. experienced a 34.05% price increase over the past year, indicating a bullish trend with decelerating momentum and a high volatility level (std deviation 11.44). The stock peaked at 116.84 and hit a low of 77.85 during this period.
Eversource Energy showed a 15.15% price rise over the same 12-month span, also bullish with deceleration and moderate volatility (std deviation 4.5). Its highest and lowest prices were 74.67 and 55.63 respectively.
Comparing both, WEC outperformed Eversource Energy with a stronger overall market gain, despite both stocks facing recent declines of around 9% from late 2025 into early 2026.
Target Prices
Analysts present a positive outlook for WEC Energy Group, Inc. and Eversource Energy with clear target price ranges.
| Company | Target High | Target Low | Consensus |
|---|---|---|---|
| WEC Energy Group, Inc. | 136 | 105 | 122.67 |
| Eversource Energy | 81 | 60 | 68 |
The consensus target prices for WEC and Eversource are above their current prices of 104.65 and 67.79 respectively, indicating moderate upside potential according to analysts.
Analyst Opinions Comparison
This section compares analysts’ ratings and grades for WEC Energy Group, Inc. (WEC) and Eversource Energy (ES):
Rating Comparison
WEC Rating
- Rating: B- indicating a very favorable overall rating.
- Discounted Cash Flow Score: 1, considered very unfavorable.
- ROE Score: 4, categorized as favorable, showing efficient profit generation from equity.
- ROA Score: 4, favorable, indicating effective asset utilization.
- Debt To Equity Score: 2, moderate financial risk with a balanced debt level.
- Overall Score: 3, classified as moderate overall financial standing.
ES Rating
- Rating: C+ indicating a very favorable overall rating.
- Discounted Cash Flow Score: 1, considered very unfavorable.
- ROE Score: 3, moderate efficiency in profit generation from equity.
- ROA Score: 3, moderate effectiveness in asset utilization.
- Debt To Equity Score: 1, very unfavorable, indicating higher financial risk.
- Overall Score: 2, moderate overall financial standing.
Which one is the best rated?
Based strictly on the provided data, WEC holds a higher overall rating (B-) and better scores in ROE, ROA, and debt management than ES, which has a lower overall rating (C+) and weaker debt-to-equity and profitability scores.
Scores Comparison
The comparison of Altman Z-Score and Piotroski Score for WEC and ES is as follows:
WEC Scores
- Altman Z-Score: 1.14, indicating financial distress zone.
- Piotroski Score: 6, reflecting average financial strength.
ES Scores
- Altman Z-Score: 0.75, also in the financial distress zone.
- Piotroski Score: 6, reflecting average financial strength.
Which company has the best scores?
Both WEC and ES are in the Altman Z-Score distress zone, indicating financial risk, and share the same Piotroski Score of 6, reflecting average financial strength. Neither shows a clear advantage based on these scores alone.
Grades Comparison
Here is a detailed comparison of the latest reliable grades assigned to the two companies:
WEC Energy Group, Inc. Grades
The following table shows recent grades and actions from well-known grading companies for WEC Energy Group, Inc.:
| Grading Company | Action | New Grade | Date |
|---|---|---|---|
| B of A Securities | Maintain | Neutral | 2025-12-31 |
| UBS | Maintain | Neutral | 2025-12-17 |
| Barclays | Maintain | Underweight | 2025-12-16 |
| Keybanc | Maintain | Overweight | 2025-12-12 |
| JP Morgan | Maintain | Neutral | 2025-12-11 |
| Scotiabank | Maintain | Sector Outperform | 2025-10-31 |
| BMO Capital | Maintain | Market Perform | 2025-10-21 |
| Barclays | Maintain | Equal Weight | 2025-10-21 |
| Keybanc | Maintain | Overweight | 2025-10-15 |
| UBS | Maintain | Neutral | 2025-10-10 |
Grades for WEC Energy Group, Inc. mostly indicate a neutral to moderate positive outlook, with a few overweight and sector outperform ratings, reflecting a balanced consensus on the stock’s prospects.
Eversource Energy Grades
The following table summarizes recent grades and actions from recognized grading companies for Eversource Energy:
| Grading Company | Action | New Grade | Date |
|---|---|---|---|
| UBS | Maintain | Neutral | 2025-12-17 |
| JP Morgan | Maintain | Underweight | 2025-12-12 |
| Janney Montgomery Scott | Upgrade | Buy | 2025-11-24 |
| Scotiabank | Maintain | Sector Underperform | 2025-11-20 |
| Mizuho | Downgrade | Neutral | 2025-11-20 |
| Wells Fargo | Downgrade | Equal Weight | 2025-11-20 |
| UBS | Downgrade | Neutral | 2025-11-06 |
| BMO Capital | Maintain | Market Perform | 2025-11-06 |
| Scotiabank | Maintain | Sector Underperform | 2025-11-06 |
| Mizuho | Maintain | Outperform | 2025-10-27 |
Eversource Energy’s grades reveal a more mixed outlook with recent downgrades and a sector underperform rating, although there is a notable buy upgrade by Janney Montgomery Scott.
Which company has the best grades?
Both companies hold a consensus rating of “Hold,” but WEC Energy Group, Inc. displays a more consistently neutral to slightly positive grading trend, including overweight and sector outperform ratings. In contrast, Eversource Energy’s grades are more varied, featuring multiple downgrades and sector underperform assessments. This divergence may influence investor perspectives on stability and growth potential.
Strengths and Weaknesses
Below is a comparison table highlighting the key strengths and weaknesses of WEC Energy Group, Inc. and Eversource Energy based on recent financial and strategic data:
| Criterion | WEC Energy Group, Inc. (WEC) | Eversource Energy (ES) |
|---|---|---|
| Diversification | Moderate geographic diversification across Illinois, Wisconsin, and other states; strong utility and non-utility segments | Broad utility services including electric, natural gas, and water distribution; more diversified service portfolio |
| Profitability | Net margin 17.77% (favorable); ROIC 4.14% (unfavorable); slightly unfavorable overall ratios | Net margin 6.82% (neutral); ROIC 3.18% (unfavorable); unfavorable overall ratios |
| Innovation | Limited data on innovation; non-utility energy infrastructure growing but ROIC below WACC suggests cautious outlook | Innovation not highlighted; declining ROIC and unfavorable profitability trend raise concerns |
| Global presence | Primarily regional U.S. presence in Midwest states | Regional U.S. presence in Northeast with varied utility services |
| Market Share | Strong foothold in Wisconsin and Illinois with steady revenue growth | Large market share in electric and natural gas distribution but facing profitability challenges |
Key takeaways: WEC Energy shows improving profitability trends despite value destruction, with a solid regional presence and moderate diversification. Eversource Energy offers broader utility services but suffers from declining profitability and value destruction, signaling higher investment risk. Both companies present challenges in innovation and financial efficiency that investors should carefully monitor.
Risk Analysis
Below is a comparison table highlighting key risks for WEC Energy Group, Inc. and Eversource Energy based on the most recent 2024 data.
| Metric | WEC Energy Group, Inc. | Eversource Energy |
|---|---|---|
| Market Risk | Beta 0.57 (lower volatility) | Beta 0.77 (moderate volatility) |
| Debt Level | Debt-to-Equity 1.64 (high) | Debt-to-Equity 1.94 (very high) |
| Regulatory Risk | Moderate (regulated electric sector) | Moderate (regulated electric & water) |
| Operational Risk | Infrastructure complexity, aging assets | Diverse operations including water distribution |
| Environmental Risk | Exposure to fossil fuels, transition challenges | Similar fossil fuel exposure, renewable investments |
| Geopolitical Risk | Low (US-focused operations) | Low (US-focused operations) |
The most impactful risks are the high debt levels and operational challenges related to aging infrastructure for both companies. Additionally, environmental transition risks remain significant as the utilities balance fossil fuels and renewable energy investments. Both firms fall within the regulated electric sector, which mitigates some regulatory risk but also limits pricing flexibility.
Which Stock to Choose?
WEC Energy Group, Inc. shows a generally favorable income statement with a 17.77% net margin and positive growth in earnings and revenue over 2020-2024. Despite a slightly unfavorable financial ratios profile and a high net debt to EBITDA of 5.19, its rating is very favorable (B-) and it displays a growing but still slightly unfavorable economic moat.
Eversource Energy exhibits a more mixed income profile with a lower 6.82% net margin, uneven growth including a significant net income decline over the period, and unfavorable financial ratios dominated by high debt levels (net debt to EBITDA 7.04). Its rating is also very favorable (C+), though the company faces a very unfavorable moat with declining ROIC.
Which stock is the most favorable for an investor could depend on the investment profile: those seeking stable profitability and improving returns might find WEC’s consistent income growth and moat trend more appealing, whereas investors tolerant of higher risk and focused on value could consider ES’s lower price-to-book ratio despite its weaker profitability and financial health signals.
Disclaimer: Investment carries a risk of loss of initial capital. The past performance is not a reliable indicator of future results. Be sure to understand risks before making an investment decision.
Go Further
I encourage you to read the complete analyses of WEC Energy Group, Inc. and Eversource Energy to enhance your investment decisions: