Investors often seek stability and growth in the regulated electric utility sector, where reliable dividends and innovation intersect. The Southern Company (SO) and Eversource Energy (ES) stand as prominent players, both operating extensively in electricity and natural gas distribution across different U.S. regions. Their shared focus on renewable energy and infrastructure modernization makes them ideal candidates for comparison. In this article, I will help you determine which company offers the most compelling investment opportunity.
Table of contents
Companies Overview
I will begin the comparison between The Southern Company and Eversource Energy by providing an overview of these two companies and their main differences.
The Southern Company Overview
The Southern Company operates in the regulated electric industry, focusing on electricity generation, transmission, and distribution. It manages diverse power generation assets including fossil fuel, nuclear, hydroelectric, solar, wind, and battery storage facilities. Serving approximately 8.7M electric and gas customers mainly in the southeastern US, it also provides natural gas services and digital wireless communications. Headquartered in Atlanta, it employs over 28K people.
Eversource Energy Overview
Eversource Energy is a public utility holding company engaged in energy delivery through electric and natural gas distribution and transmission, as well as water distribution services. It serves residential, commercial, industrial, and municipal customers in the northeastern US states of Connecticut, Massachusetts, and New Hampshire. Formerly Northeast Utilities, it operates regulated water utilities and solar power facilities, employing around 10K staff from its base in Springfield, Massachusetts.
Key similarities and differences
Both companies operate in the regulated electric utilities sector, focusing on electricity and natural gas distribution. The Southern Company has a broader geographic footprint and a larger workforce, with a more diverse energy portfolio including nuclear and battery storage. Eversource Energy integrates water distribution and solar power in its service offerings, concentrating on the northeastern US. Their business models emphasize regulated utility services but differ in scale and regional focus.
Income Statement Comparison
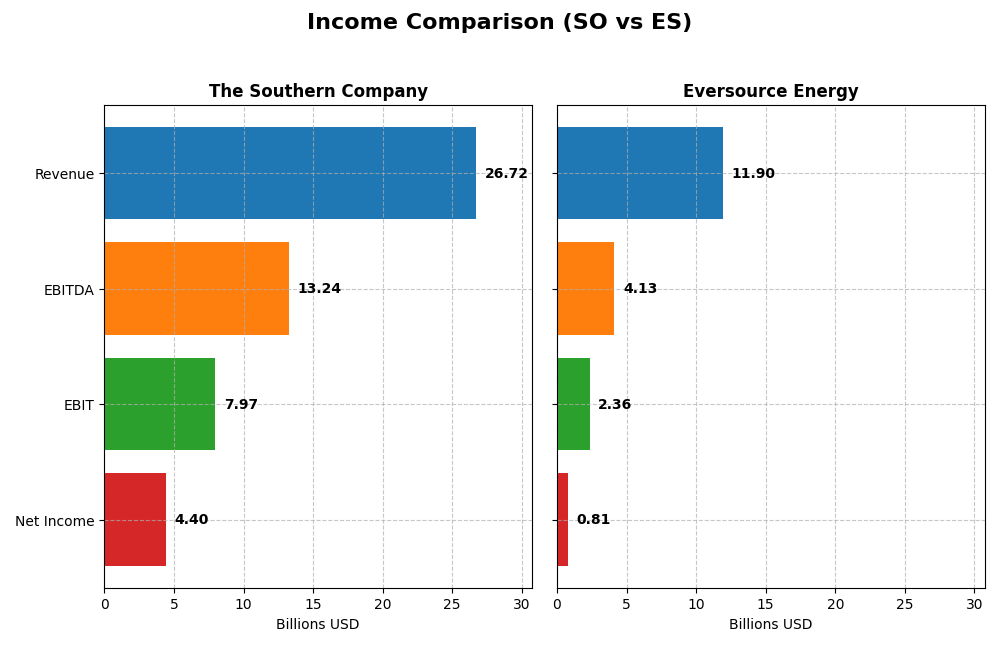
This table compares the key income statement metrics for The Southern Company and Eversource Energy for the fiscal year 2024, providing a snapshot of their financial performance.
| Metric | The Southern Company (SO) | Eversource Energy (ES) |
|---|---|---|
| Market Cap | 95.7B | 25.0B |
| Revenue | 26.7B | 11.9B |
| EBITDA | 13.2B | 4.1B |
| EBIT | 7.97B | 2.36B |
| Net Income | 4.40B | 812M |
| EPS | 4.02 | 2.27 |
| Fiscal Year | 2024 | 2024 |
Income Statement Interpretations
The Southern Company
The Southern Company showed overall revenue growth of 31.16% from 2020 to 2024, with net income increasing by 40.43% over the same period. Margins remained strong, with a gross margin near 50% and an EBIT margin close to 30%, both favorable. In 2024, revenue grew moderately by 5.83%, while EBIT expanded by 17.39%, reflecting improving operational efficiency despite rising operating expenses.
Eversource Energy
Eversource Energy experienced a 33.65% increase in revenue from 2020 to 2024 but saw net income decline by 32.65%, signaling margin pressure. The gross margin stood at 31.12%, and the EBIT margin at 19.79%, both favorable but lower than its peer. In 2024, revenue slightly declined by 0.08%, while EBIT surged by 305.78%, driven by non-operating income fluctuations and improved net margin growth.
Which one has the stronger fundamentals?
The Southern Company demonstrates stronger fundamentals with consistent revenue and net income growth alongside high and stable margins, despite some unfavorable interest expenses. Eversource Energy shows mixed signals: solid revenue growth but declining net income and margin deterioration over the longer term, although recent EBIT and net margin improvements are notable. Overall, The Southern Company’s income statement indicators appear more robust.
Financial Ratios Comparison
The following table compares key financial ratios for The Southern Company and Eversource Energy based on their most recent fiscal year data (2024). These ratios provide insights into profitability, valuation, liquidity, leverage, and operational efficiency.
| Ratios | The Southern Company (SO) | Eversource Energy (ES) |
|---|---|---|
| ROE | 13.25% | 5.40% |
| ROIC | 4.25% | 3.18% |
| P/E | 20.5 | 25.3 |
| P/B | 2.72 | 1.37 |
| Current Ratio | 0.67 | 0.76 |
| Quick Ratio | 0.46 | 0.67 |
| D/E (Debt to Equity) | 2.00 | 1.94 |
| Debt-to-Assets | 45.7% | 48.9% |
| Interest Coverage | 2.58 | 2.43 |
| Asset Turnover | 0.18 | 0.20 |
| Fixed Asset Turnover | 0.25 | 0.29 |
| Payout ratio | 67.1% | 124.3% |
| Dividend yield | 3.27% | 4.91% |
Interpretation of the Ratios
The Southern Company
The Southern Company shows a mixed ratio profile with strengths in net margin (16.47%, favorable) and dividend yield (3.27%, favorable), but concerns arise from low current (0.67) and quick ratios (0.46), and high debt-to-equity (2.0). Return on equity is neutral at 13.25%, while return on invested capital is unfavorable at 4.25%. The company pays dividends, supported by a stable payout, but free cash flow coverage is weak, posing potential sustainability risks.
Eversource Energy
Eversource Energy exhibits generally weaker profitability ratios, with a neutral net margin of 6.82% but unfavorable return on equity (5.4%) and return on invested capital (3.18%). Liquidity ratios remain below one, indicating potential short-term risk, and debt levels are somewhat high. The dividend yield is attractive at 4.91%, yet the company faces challenges in cash flow, which could affect dividend sustainability and capital structure balance.
Which one has the best ratios?
The Southern Company presents a slightly unfavorable overall ratio evaluation but benefits from stronger profitability and a more stable dividend yield. Eversource Energy holds a less favorable ratio profile, with more pronounced weaknesses in profitability and liquidity. Therefore, The Southern Company currently shows relatively better financial health and dividend metrics compared to Eversource Energy.
Strategic Positioning
This section compares the strategic positioning of The Southern Company and Eversource Energy, focusing on market position, key segments, and exposure to technological disruption:
The Southern Company
- Large market cap of 95.7B in regulated electric utilities, facing typical industry competition.
- Diversified segments including electric utilities, gas distribution, marketing, pipelines, and renewables.
- Operates multiple renewable energy assets, including solar, wind, hydro, nuclear, and battery storage.
Eversource Energy
- Smaller market cap of 25B with regulated electric utility focus in Northeast US states.
- Concentrated on electric distribution, transmission, natural gas, and water services.
- Engages in solar power facilities but fewer renewable asset types mentioned.
The Southern Company vs Eversource Energy Positioning
The Southern Company adopts a diversified approach across multiple energy and gas segments with significant renewable investments. Eversource Energy maintains a more concentrated regional utility focus including electric, gas, and water distribution. Diversification offers broad revenue streams, while concentration may enable operational focus.
Which has the best competitive advantage?
Both companies are shedding value as ROIC falls below WACC. However, Southern Company shows a growing ROIC trend, indicating improving profitability, whereas Eversource Energy’s ROIC is declining, suggesting a weaker competitive advantage.
Stock Comparison
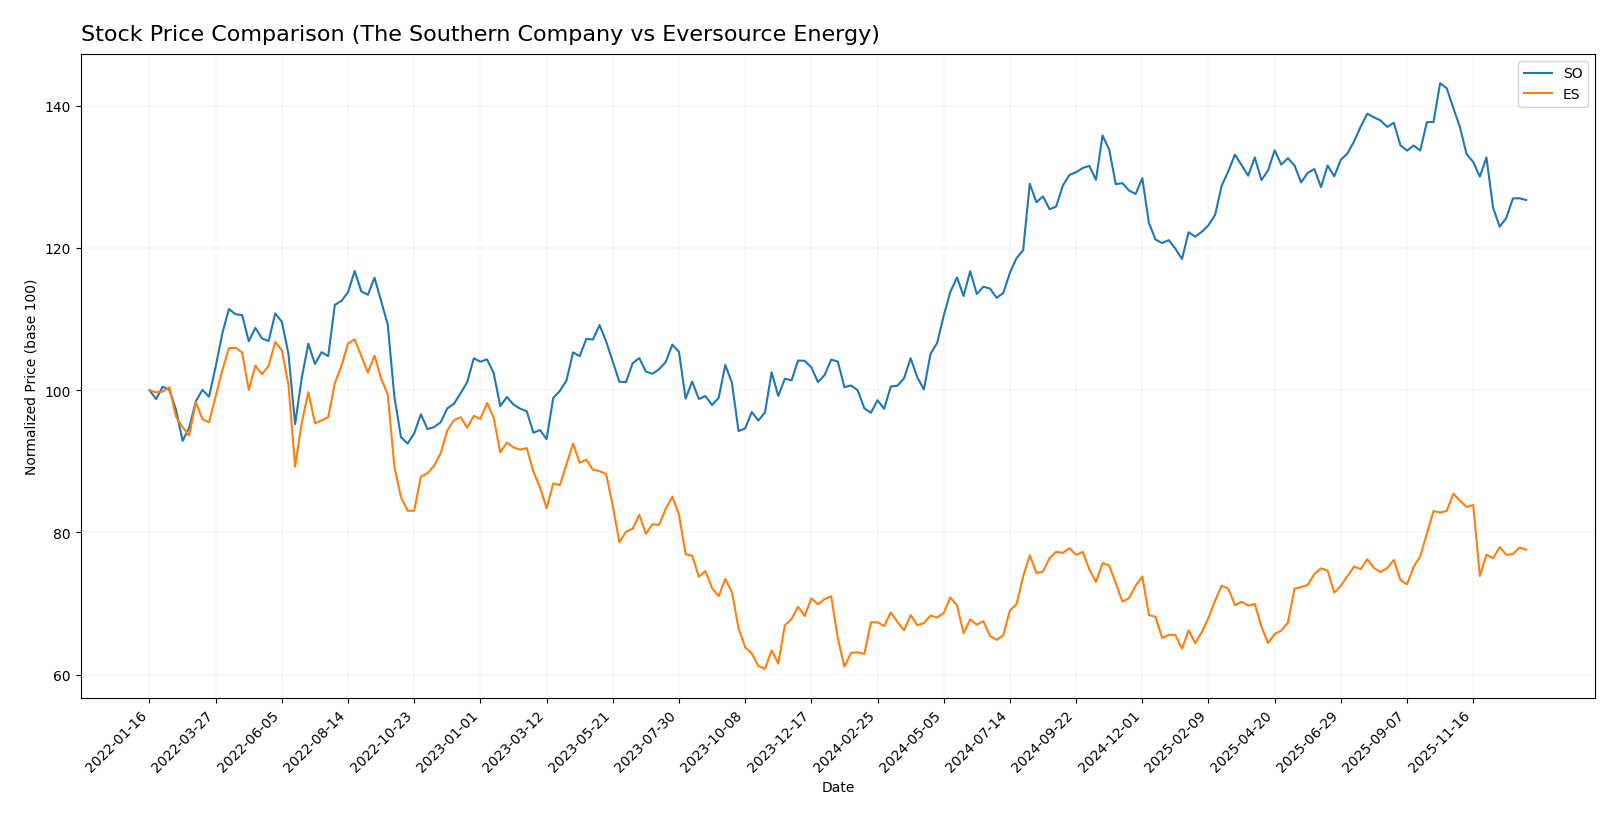
The stock prices of The Southern Company (SO) and Eversource Energy (ES) have shown significant bullish trends over the past 12 months, with both experiencing deceleration in momentum and recent negative price movements.
Trend Analysis
The Southern Company (SO) delivered a 30.88% price increase over the past year, indicating a strong bullish trend with decelerating momentum, a high of 98.29, and a low of 66.48. Recent weeks show a -9.25% decline with a negative slope.
Eversource Energy (ES) posted a 15.15% gain over the same period, also bullish with deceleration and a high of 74.67, low of 55.63. Its recent trend mirrors SO’s with a -9.21% drop and a moderate negative slope.
Comparing both, SO outperformed ES with a higher annual price appreciation, despite similar recent declines and decelerating trends in each stock.
Target Prices
The current analyst consensus presents a balanced outlook for both The Southern Company and Eversource Energy.
| Company | Target High | Target Low | Consensus |
|---|---|---|---|
| The Southern Company | 103 | 76 | 93.1 |
| Eversource Energy | 81 | 60 | 68 |
Analysts expect The Southern Company’s stock to appreciate moderately above its current price of $87.01, while Eversource Energy’s target consensus aligns closely with its current price of $67.79, indicating a stable outlook.
Analyst Opinions Comparison
This section compares analysts’ ratings and grades for The Southern Company and Eversource Energy:
Rating Comparison
The Southern Company Rating
- Rating: B- indicating a very favorable overall evaluation.
- Discounted Cash Flow Score: 3, considered moderate in assessing future cash flow valuation.
- ROE Score: 4, showing favorable efficiency in generating profit from shareholders’ equity.
- ROA Score: 3, moderate effectiveness in asset utilization to generate earnings.
- Debt To Equity Score: 1, very unfavorable reflecting higher financial risk due to leverage.
- Overall Score: 3, a moderate summary of the company’s financial standing.
Eversource Energy Rating
- Rating: C+ indicating a very favorable overall evaluation.
- Discounted Cash Flow Score: 1, assessed as very unfavorable for valuation purposes.
- ROE Score: 3, a moderate measure of equity profitability.
- ROA Score: 3, moderate asset usage effectiveness.
- Debt To Equity Score: 1, very unfavorable indicating similar financial leverage risk.
- Overall Score: 2, moderate but lower than The Southern Company’s overall score.
Which one is the best rated?
Based on the provided data, The Southern Company holds a higher rating (B-) and better scores in discounted cash flow, ROE, and overall financial standing compared to Eversource Energy’s C+ rating and lower scores. Both share similar debt-to-equity concerns.
Scores Comparison
The comparison of The Southern Company and Eversource Energy scores is as follows:
SO Scores
- Altman Z-Score: 0.98, indicating financial distress zone.
- Piotroski Score: 6, reflecting average financial strength.
ES Scores
- Altman Z-Score: 0.75, also in the financial distress zone.
- Piotroski Score: 6, reflecting average financial strength.
Which company has the best scores?
Both The Southern Company and Eversource Energy share the same Piotroski Score of 6, indicating average financial strength. Their Altman Z-Scores are in the distress zone, with SO slightly higher at 0.98 versus ES at 0.75, indicating marginally better financial stability for SO.
Grades Comparison
Here is a comparison of the latest available grades from verified grading companies for The Southern Company and Eversource Energy:
The Southern Company Grades
This table summarizes recent grade actions by recognized financial institutions for The Southern Company:
| Grading Company | Action | New Grade | Date |
|---|---|---|---|
| UBS | Maintain | Neutral | 2025-12-17 |
| JP Morgan | Maintain | Neutral | 2025-12-15 |
| Jefferies | Maintain | Neutral | 2025-12-15 |
| RBC Capital | Maintain | Sector Perform | 2025-12-12 |
| Keybanc | Maintain | Underweight | 2025-12-12 |
| Mizuho | Maintain | Neutral | 2025-12-11 |
| Barclays | Maintain | Equal Weight | 2025-11-20 |
| Jefferies | Downgrade | Neutral | 2025-11-05 |
| Ladenburg Thalmann | Downgrade | Neutral | 2025-10-17 |
| Keybanc | Maintain | Underweight | 2025-10-15 |
The Southern Company has maintained mostly neutral or sector perform grades recently, with some downgrades from buy ratings earlier in the year, indicating a cautious stance by analysts.
Eversource Energy Grades
Below are recent grades and actions by credible analysts for Eversource Energy:
| Grading Company | Action | New Grade | Date |
|---|---|---|---|
| UBS | Maintain | Neutral | 2025-12-17 |
| JP Morgan | Maintain | Underweight | 2025-12-12 |
| Janney Montgomery Scott | Upgrade | Buy | 2025-11-24 |
| Scotiabank | Maintain | Sector Underperform | 2025-11-20 |
| Mizuho | Downgrade | Neutral | 2025-11-20 |
| Wells Fargo | Downgrade | Equal Weight | 2025-11-20 |
| UBS | Downgrade | Neutral | 2025-11-06 |
| BMO Capital | Maintain | Market Perform | 2025-11-06 |
| Scotiabank | Maintain | Sector Underperform | 2025-11-06 |
| Mizuho | Maintain | Outperform | 2025-10-27 |
Eversource Energy’s grades show more variability, including upgrades to buy but also downgrades and sector underperform ratings, reflecting mixed analyst sentiment.
Which company has the best grades?
Both companies hold a consensus rating of “Hold,” but Eversource Energy exhibits a wider range of grades, including some upgrades to buy, unlike The Southern Company which mostly remains at neutral or underweight. This variation could imply differing analyst views on growth potential and risk, affecting investor perception and portfolio positioning.
Strengths and Weaknesses
Below is a comparison of key strengths and weaknesses for The Southern Company (SO) and Eversource Energy (ES) based on their latest financial and operational data.
| Criterion | The Southern Company (SO) | Eversource Energy (ES) |
|---|---|---|
| Diversification | Moderate diversification with strong gas and electric utilities segments, plus Southern Power and gas marketing services. | Balanced electric distribution, transmission, and natural gas distribution, with water segment adding modest diversification. |
| Profitability | Net margin at 16.47% (favorable); ROIC at 4.25% (unfavorable), indicates moderate profitability but inefficiency in capital use. | Net margin at 6.82% (neutral); ROIC at 3.18% (unfavorable), showing lower profitability and capital efficiency than SO. |
| Innovation | Gradual ROIC growth suggests improving operational efficiency despite current value destruction. | Declining ROIC trend signals challenges in innovation or operational improvements. |
| Global presence | Primarily US-focused, with strong regional presence in the Southeast. | Also US-focused, mainly in Northeast, with less geographic reach than SO. |
| Market Share | Large presence in electric utilities and gas distribution in its regions. | Strong regional market share in electric distribution and transmission in its markets. |
Key takeaways: The Southern Company shows improving profitability trends but currently destroys value with slightly unfavorable capital returns. Eversource Energy has weaker profitability and declining capital efficiency, signaling more risk. Both companies are regionally focused with moderate diversification. Caution and close monitoring of operational improvements are recommended before investing.
Risk Analysis
Below is a comparative risk table for The Southern Company (SO) and Eversource Energy (ES) based on the most recent 2024 data:
| Metric | The Southern Company (SO) | Eversource Energy (ES) |
|---|---|---|
| Market Risk | Low beta (0.447), stable price range | Moderate beta (0.772), wider price range |
| Debt level | High debt-to-equity (2.0), moderate debt-to-assets (45.65%) | High debt-to-equity (1.94), moderate debt-to-assets (48.85%) |
| Regulatory Risk | Moderate (regulated electric sector) | Moderate (regulated electric and gas) |
| Operational Risk | Diverse generation assets, large pipeline infrastructure | Diverse utilities, including water distribution |
| Environmental Risk | Significant renewable assets but fossil fuel exposure | Significant solar assets, some fossil fuel exposure |
| Geopolitical Risk | US-based, limited international exposure | US-based, limited international exposure |
The most likely and impactful risks for both companies stem from their high leverage levels combined with operational complexities in regulated utilities. Both are in financial distress zones per Altman Z-scores (~0.75-0.98), signaling potential bankruptcy risk if conditions worsen. Market risk is moderate to low given their beta values, but regulatory and environmental shifts pose ongoing challenges. Investors should monitor debt management and regulatory developments closely.
Which Stock to Choose?
The Southern Company (SO) shows favorable income evolution with a 31.16% revenue growth over 2020-2024 and a 40.43% net income increase. Its profitability is solid, with a 16.47% net margin, though debt levels and liquidity ratios are unfavorable. The overall rating is very favorable with a B- score.
Eversource Energy (ES) presents mixed income trends: 33.65% revenue growth but a 32.65% decline in net income over the same period. Profitability is moderate, with a 6.82% net margin and higher debt burdens. Its rating is also very favorable at C+, despite some weaker financial ratios.
Investors favoring growth and income stability might find SO’s consistent profitability and improving returns more appealing, while those with tolerance for volatility and value considerations could see potential in ES’s revenue growth despite recent profit declines. The contrasting ratings and income profiles suggest the choice could depend on individual risk appetite and investment strategy.
Disclaimer: Investment carries a risk of loss of initial capital. The past performance is not a reliable indicator of future results. Be sure to understand risks before making an investment decision.
Go Further
I encourage you to read the complete analyses of The Southern Company and Eversource Energy to enhance your investment decisions: