Public Service Enterprise Group Incorporated (PEG) and Eversource Energy (ES) are two prominent players in the regulated electric utility sector, serving key Northeastern U.S. markets. Both companies focus on electricity transmission, distribution, and renewable energy initiatives, positioning themselves as innovative leaders amid the energy transition. This article will analyze their strengths and risks to help you decide which company better suits your investment portfolio in 2026.
Table of contents
Companies Overview
I will begin the comparison between Public Service Enterprise Group Incorporated and Eversource Energy by providing an overview of these two companies and their main differences.
Public Service Enterprise Group Incorporated Overview
Public Service Enterprise Group Incorporated (PEG) operates as an energy company primarily in the Northeastern and Mid-Atlantic United States. The company focuses on electricity transmission and distribution, natural gas services, and solar generation projects. With extensive infrastructure including 25,000 circuit miles of electric transmission and distribution, PEG serves residential, commercial, and industrial customers through its subsidiaries.
Eversource Energy Overview
Eversource Energy (ES) is a public utility holding company engaged in energy delivery across Connecticut, Massachusetts, and New Hampshire. Its operations include electric distribution and transmission, natural gas distribution, solar power facilities, and regulated water utilities serving around 226,000 customers. Eversource targets a broad customer base including residential, commercial, and municipal sectors in the Northeast.
Key similarities and differences
Both PEG and ES operate in the regulated electric utility sector, focusing on electricity transmission and distribution, natural gas services, and solar energy. PEG has a larger market cap of approximately 39B compared to ES’s 25B and a larger workforce. While PEG emphasizes a broad Mid-Atlantic and Northeastern presence, ES concentrates on three New England states and includes water utility services, differentiating their geographic and service scope.
Income Statement Comparison
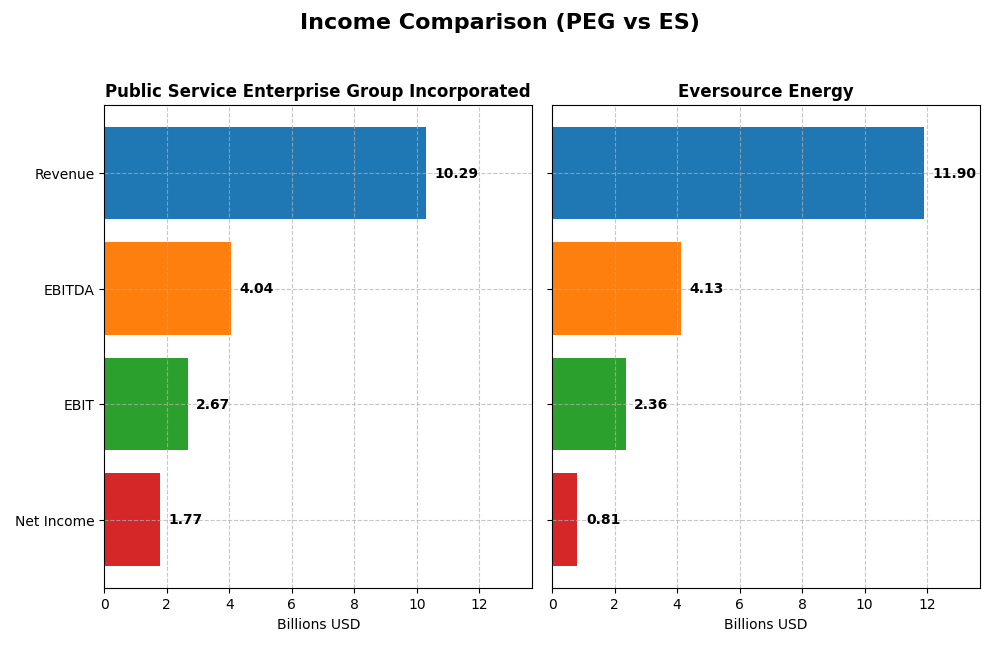
This table compares the key income statement metrics for Public Service Enterprise Group Incorporated (PEG) and Eversource Energy (ES) for the fiscal year 2024, providing a snapshot of their financial performance.
| Metric | Public Service Enterprise Group Incorporated (PEG) | Eversource Energy (ES) |
|---|---|---|
| Market Cap | 39.3B | 25.0B |
| Revenue | 10.3B | 11.9B |
| EBITDA | 4.0B | 4.1B |
| EBIT | 2.7B | 2.4B |
| Net Income | 1.77B | 812M |
| EPS | 3.56 | 2.27 |
| Fiscal Year | 2024 | 2024 |
Income Statement Interpretations
Public Service Enterprise Group Incorporated
Public Service Enterprise Group (PEG) saw revenue grow modestly by 7.15% overall from 2020 to 2024 but experienced a notable revenue decline of 8.43% in 2024. Net income fell by nearly 7% over the period and dropped sharply by 30.99% in the last year. Margins remain favorable, with a solid gross margin of 34.41% and net margin of 17.22% in 2024, though both showed negative growth recently.
Eversource Energy
Eversource Energy (ES) recorded a 33.65% revenue increase overall during 2020-2024 but had a slight revenue dip of 0.08% in 2024. Despite a net income decrease of 32.65% over the period, the company delivered strong net margin growth of 283.68% last year, reaching 6.82%. Its EBIT margin also improved significantly, reflecting better profitability despite margin declines over the long term.
Which one has the stronger fundamentals?
PEG exhibits stronger margins and a higher net margin compared to ES, but it faces unfavorable recent growth trends in revenue and income. ES shows more favorable recent profitability improvements and revenue growth over the period, with better margin expansion last year. Overall, ES’s income statement evaluation is positive, while PEG’s is unfavorable, highlighting contrasting financial dynamics.
Financial Ratios Comparison
The table below presents a side-by-side comparison of key financial ratios for Public Service Enterprise Group Incorporated (PEG) and Eversource Energy (ES) based on their most recent fiscal year 2024 data.
| Ratios | Public Service Enterprise Group Incorporated (PEG) | Eversource Energy (ES) |
|---|---|---|
| ROE | 11.0% | 5.4% |
| ROIC | 4.4% | 3.2% |
| P/E | 23.7 | 25.3 |
| P/B | 2.61 | 1.37 |
| Current Ratio | 0.65 | 0.76 |
| Quick Ratio | 0.48 | 0.67 |
| D/E (Debt to Equity) | 1.42 | 1.94 |
| Debt-to-Assets | 41.9% | 48.9% |
| Interest Coverage | 2.80 | 2.43 |
| Asset Turnover | 0.19 | 0.20 |
| Fixed Asset Turnover | 0.26 | 0.29 |
| Payout Ratio | 67.5% | 124.3% |
| Dividend Yield | 2.84% | 4.91% |
Interpretation of the Ratios
Public Service Enterprise Group Incorporated
Public Service Enterprise Group displays a mixed ratio profile with a favorable net margin of 17.22% but an unfavorable return on invested capital at 4.4%. Its liquidity ratios and leverage (debt to equity 1.42) are weak, while the dividend yield of 2.84% is favorable. The payout appears sustainable, supported by moderate coverage, yet some operational efficiency concerns remain.
Eversource Energy
Eversource Energy shows a neutral net margin of 6.82% but unfavorable returns on equity (5.4%) and invested capital (3.18%). Liquidity and debt ratios signal weaknesses, with a debt to equity ratio of 1.94. The company offers a higher dividend yield of 4.91%, yet the overall ratio outlook is less favorable, reflecting challenges in profitability and operational efficiency.
Which one has the best ratios?
Public Service Enterprise Group’s ratios are slightly unfavorable but show better profitability and risk metrics compared to Eversource Energy, which faces a more unfavorable ratio profile. Both companies have similar dividend yield favorability, but PEG’s stronger net margin and lower debt burden give it a relatively more balanced financial position.
Strategic Positioning
This section compares the strategic positioning of PEG and ES, including their Market position, Key segments, and Exposure to technological disruption:
PEG
- Market position and competitive pressure
- Key segments and business drivers
- Exposure to technological disruption
ES
- Larger market cap at 39B with moderate beta, operating mainly in Northeast and Mid-Atlantic US.
- Revenues from electric transmission, gas distribution, and solar investments; strong focus on PSE&G segment.
- Invests in solar generation and energy efficiency programs alongside traditional utilities.
PEG vs ES Positioning
PEG presents a more concentrated focus on electric and gas distribution in a defined region with solar initiatives, while ES operates a more diversified portfolio including water utilities across multiple states. PEG’s larger scale contrasts with ES’s broader service segments.
Which has the best competitive advantage?
Both companies are currently shedding value relative to their cost of capital. PEG shows a slightly unfavorable moat with growing ROIC, while ES has a very unfavorable moat with declining profitability, indicating PEG may have a marginally stronger competitive advantage.
Stock Comparison
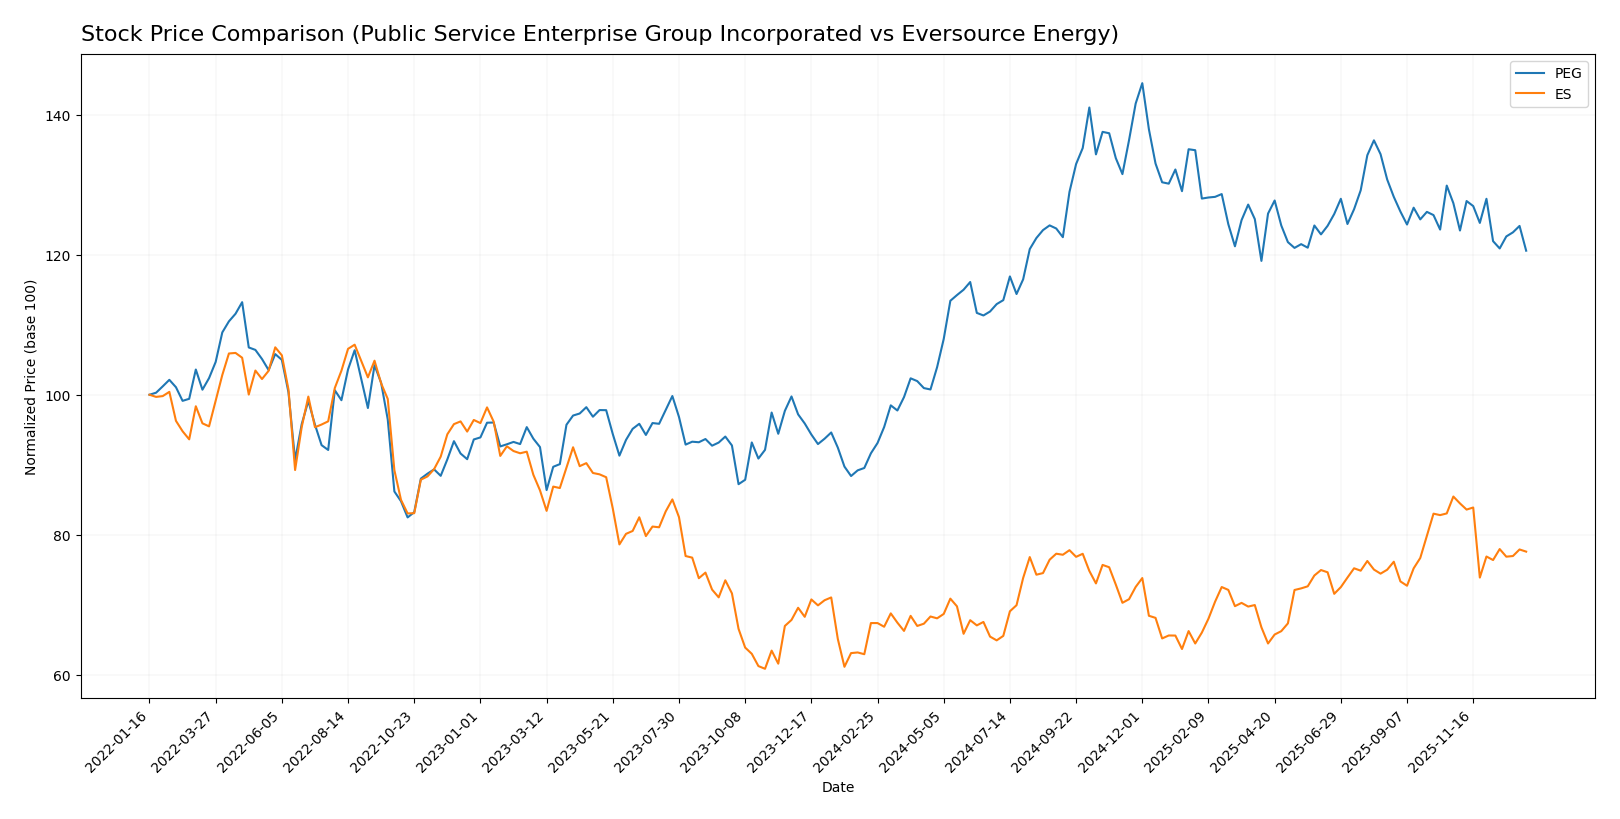
The stock prices of Public Service Enterprise Group Incorporated (PEG) and Eversource Energy (ES) showed significant bullish trends over the past 12 months, with both experiencing deceleration in price gains and recent downward pressure in trading dynamics.
Trend Analysis
Public Service Enterprise Group Incorporated (PEG) posted a strong 31.59% price increase over the past year, indicating a bullish trend with decelerating momentum. The highest price reached 94.3, the lowest 59.79, and recent months show a slight negative trend.
Eversource Energy (ES) also demonstrated a bullish trend with a 15.15% gain over 12 months, accompanied by deceleration and lower volatility relative to PEG. The stock peaked at 74.67 and bottomed at 55.63, with recent declines evident.
Comparing both, PEG delivered the highest market performance over the one-year period, outperforming ES in overall price appreciation despite more pronounced recent volatility and volume decreases.
Target Prices
Analysts present a clear target price consensus for Public Service Enterprise Group Incorporated and Eversource Energy.
| Company | Target High | Target Low | Consensus |
|---|---|---|---|
| Public Service Enterprise Group Incorporated | 98 | 83 | 89 |
| Eversource Energy | 81 | 60 | 68 |
The consensus target for Public Service Enterprise Group at $89 suggests a moderate upside from its current price of $78.68, while Eversource Energy’s target consensus of $68 closely aligns with its current price of $67.79, indicating limited near-term price growth expectations.
Analyst Opinions Comparison
This section compares analysts’ ratings and grades for Public Service Enterprise Group Incorporated (PEG) and Eversource Energy (ES):
Rating Comparison
PEG Rating
- Rating: B- indicating a very favorable overall evaluation.
- Discounted Cash Flow Score: 1, considered very unfavorable for both companies.
- ROE Score: 4, favorable, showing strong profitability from equity.
- ROA Score: 4, favorable, indicating effective asset utilization.
- Debt To Equity Score: 2, moderate, indicating balanced financial risk.
- Overall Score: 3, moderate, reflecting a balanced financial standing.
ES Rating
- Rating: C+ also indicating a very favorable overall evaluation.
- Discounted Cash Flow Score: 1, very unfavorable, same as PEG.
- ROE Score: 3, moderate, indicating less efficiency than PEG.
- ROA Score: 3, moderate, less effective asset use compared to PEG.
- Debt To Equity Score: 1, very unfavorable, higher financial risk than PEG.
- Overall Score: 2, moderate, but lower than PEG’s overall score.
Which one is the best rated?
Based strictly on the provided data, PEG holds a better overall rating with a B- and higher scores in ROE, ROA, debt-to-equity, and overall score compared to ES’s C+ rating and lower scores, indicating PEG is better rated in these financial metrics.
Scores Comparison
Here is a comparison of the Altman Z-Score and Piotroski Score for PEG and ES:
PEG Scores
- Altman Z-Score: 1.32, in distress zone indicating financial risk.
- Piotroski Score: 7, strong financial health and value potential.
ES Scores
- Altman Z-Score: 0.75, in distress zone with higher bankruptcy risk.
- Piotroski Score: 6, average financial health and value status.
Which company has the best scores?
PEG has a higher Altman Z-Score and a stronger Piotroski Score than ES, suggesting relatively better financial health and lower bankruptcy risk based on the provided data.
Grades Comparison
Here is the grades comparison of Public Service Enterprise Group Incorporated and Eversource Energy:
Public Service Enterprise Group Incorporated Grades
This table summarizes recent reliable grades assigned to Public Service Enterprise Group Incorporated:
| Grading Company | Action | New Grade | Date |
|---|---|---|---|
| Ladenburg Thalmann | Buy | Buy | 2026-01-07 |
| UBS | Maintain | Buy | 2025-12-17 |
| JP Morgan | Maintain | Overweight | 2025-12-12 |
| Jefferies | Upgrade | Buy | 2025-11-06 |
| TD Cowen | Maintain | Buy | 2025-11-05 |
| BMO Capital | Maintain | Market Perform | 2025-11-04 |
| Barclays | Maintain | Equal Weight | 2025-10-21 |
| BMO Capital | Maintain | Market Perform | 2025-10-20 |
| Morgan Stanley | Maintain | Overweight | 2025-09-25 |
| BMO Capital | Maintain | Market Perform | 2025-08-06 |
The overall trend for Public Service Enterprise Group shows mostly positive grades, with several upgrades to Buy and Overweight, indicating favorable analyst sentiment.
Eversource Energy Grades
This table summarizes recent reliable grades assigned to Eversource Energy:
| Grading Company | Action | New Grade | Date |
|---|---|---|---|
| UBS | Maintain | Neutral | 2025-12-17 |
| JP Morgan | Maintain | Underweight | 2025-12-12 |
| Janney Montgomery Scott | Upgrade | Buy | 2025-11-24 |
| Scotiabank | Maintain | Sector Underperform | 2025-11-20 |
| Mizuho | Downgrade | Neutral | 2025-11-20 |
| Wells Fargo | Downgrade | Equal Weight | 2025-11-20 |
| UBS | Downgrade | Neutral | 2025-11-06 |
| BMO Capital | Maintain | Market Perform | 2025-11-06 |
| Scotiabank | Maintain | Sector Underperform | 2025-11-06 |
| Mizuho | Maintain | Outperform | 2025-10-27 |
Eversource Energy’s grades reflect a more cautious stance with multiple downgrades and a consensus leaning towards Hold, showing mixed analyst opinions.
Which company has the best grades?
Public Service Enterprise Group Incorporated has received better grades overall, with more Buy and Overweight ratings compared to Eversource Energy’s Hold and Neutral consensus. This difference may influence investors by indicating relatively stronger analyst confidence in Public Service Enterprise Group’s prospects.
Strengths and Weaknesses
Below is a comparative overview of key strengths and weaknesses for Public Service Enterprise Group Incorporated (PEG) and Eversource Energy (ES) based on their recent financial performance and market positioning.
| Criterion | Public Service Enterprise Group Incorporated (PEG) | Eversource Energy (ES) |
|---|---|---|
| Diversification | Moderate: Revenue from electric, gas distribution, transmission, and contracts; some reliance on Public Service Electric and Gas Company segment | Moderate: Primarily electric distribution and transmission, natural gas and water distribution; less diversified |
| Profitability | Higher net margin (17.22%), but ROIC (4.4%) below WACC, indicating slight value destruction | Lower net margin (6.82%) with ROIC (3.18%) below WACC, showing value destruction with declining profitability |
| Innovation | Limited innovation indicators; stable but slightly unfavorable economic moat with growing ROIC trend | Limited innovation; very unfavorable economic moat with declining ROIC trend |
| Global presence | Primarily regional (U.S. Northeast), limited global footprint | Regional focus in U.S. Northeast, no global presence |
| Market Share | Strong presence in electric and gas markets within its region | Strong regional market share in electric and gas distribution |
Key takeaways: PEG shows stronger profitability and a growing ROIC trend despite slight value destruction, indicating improving efficiency. ES faces more challenges with declining profitability and a very unfavorable economic moat. Both companies have moderate diversification but are regionally focused with limited innovation signals. Investors should weigh PEG’s improving trend against ES’s ongoing struggles.
Risk Analysis
Below is a comparative risk table for Public Service Enterprise Group Incorporated (PEG) and Eversource Energy (ES) based on recent 2024 data.
| Metric | Public Service Enterprise Group (PEG) | Eversource Energy (ES) |
|---|---|---|
| Market Risk | Beta 0.61, lower volatility | Beta 0.77, moderate volatility |
| Debt level | Debt/Equity 1.42 (unfavorable) | Debt/Equity 1.94 (unfavorable) |
| Regulatory Risk | High, due to regulated electric sector | High, regulated electric sector |
| Operational Risk | Moderate, due to aging infrastructure | Moderate, multi-state operations |
| Environmental Risk | Increasing, tied to fossil fuel assets | Increasing, focus on renewables |
| Geopolitical Risk | Low, US domestic operations | Low, US domestic operations |
The most significant risks for both companies are regulatory and debt-related. PEG shows slightly better financial stability but both are in distress zones for bankruptcy risk (Altman Z-score below 1.8). Market volatility is relatively low, but high debt levels and operational challenges from infrastructure aging and environmental regulations remain impactful concerns. Investors should monitor debt servicing ability and regulatory changes closely.
Which Stock to Choose?
Public Service Enterprise Group Incorporated (PEG) shows a slightly unfavorable global ratios opinion with 43% unfavorable ratios, despite favorable net margin and dividend yield. Its income statement is rated unfavorable due to declining revenue and earnings growth, and the company is shedding value though its ROIC is growing. PEG’s rating is very favorable (B-) with moderate overall scores, a strong Piotroski score, but an Altman Z-score in the distress zone.
Eversource Energy (ES) has an unfavorable global ratios opinion, with 57% unfavorable ratios and lower profitability metrics. Its income statement is favorable overall, supported by strong recent EBIT and net margin growth, yet it is shedding value with a declining ROIC. ES holds a very favorable rating (C+), moderate overall scores, an average Piotroski score, and an Altman Z-score also in the distress zone.
Investors seeking potential value creation with improving profitability may find PEG’s growing ROIC and stronger profitability metrics more appealing, while those prioritizing recent income statement improvements might view ES’s positive growth trends favorably despite its weaker ratios. Risk-averse investors might consider the financial distress signals present in both companies’ Z-scores.
Disclaimer: Investment carries a risk of loss of initial capital. The past performance is not a reliable indicator of future results. Be sure to understand risks before making an investment decision.
Go Further
I encourage you to read the complete analyses of Public Service Enterprise Group Incorporated and Eversource Energy to enhance your investment decisions: