In the regulated electric utility sector, PPL Corporation and Eversource Energy stand out as prominent players serving distinct yet overlapping markets in the United States. Both companies emphasize innovation in energy delivery and sustainability, making them compelling choices for investors seeking stability combined with growth potential. This article will carefully analyze their strengths and risks to help you identify which company holds the most promise for your investment portfolio.
Table of contents
Companies Overview
I will begin the comparison between PPL Corporation and Eversource Energy by providing an overview of these two companies and their main differences.
PPL Overview
PPL Corporation is a utility holding company focused on delivering electricity and natural gas in the US and the UK. It operates through two regulated segments in Kentucky and Pennsylvania, serving nearly 1.7M electric and 333K natural gas customers. PPL generates electricity from coal, gas, hydro, and solar sources, positioning itself as a diversified energy provider with a legacy dating back to 1920.
Eversource Overview
Eversource Energy is a public utility holding company engaged in the delivery of electricity, natural gas, and water services across Connecticut, Massachusetts, and New Hampshire. The company operates through electric distribution, transmission, natural gas, and water segments, serving residential to industrial customers. Formerly known as Northeast Utilities, it rebranded in 2015 and employs around 10K people from its base in Springfield, Massachusetts.
Key similarities and differences
Both PPL and Eversource operate in the regulated electric utilities sector, focusing on energy delivery and serving diverse customer bases. However, PPL has a stronger presence in electricity generation, including renewable sources, while Eversource integrates water distribution into its business model. PPL serves customers in two states plus the UK, contrasting with Eversource’s concentrated operations in three US states. Employee count and segment diversification also differ between the two companies.
Income Statement Comparison
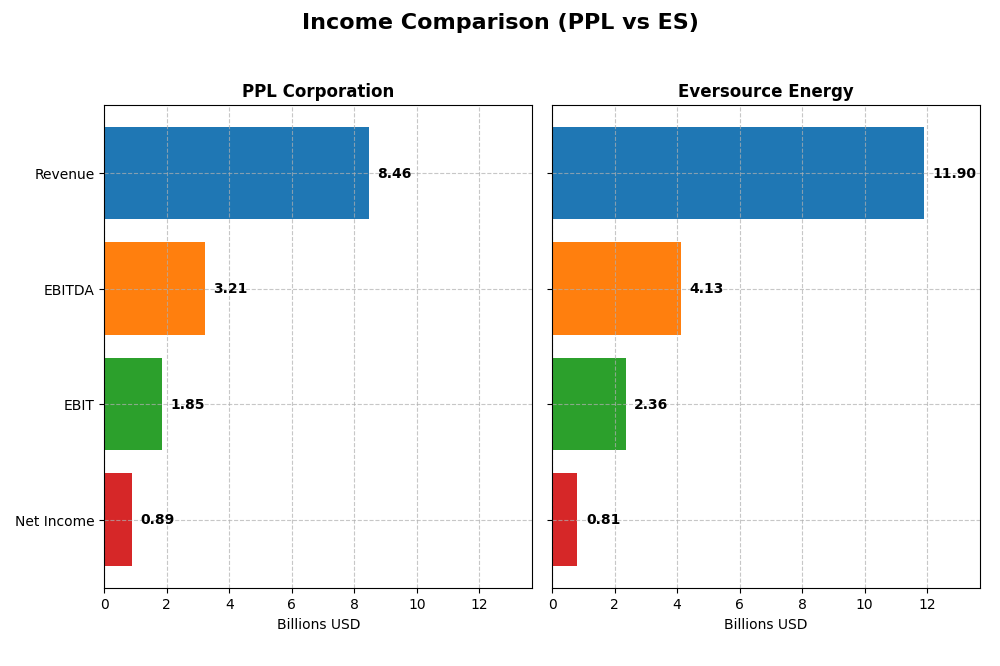
The table below presents the latest fiscal year income statement data for PPL Corporation and Eversource Energy, allowing a direct financial performance comparison.
| Metric | PPL Corporation | Eversource Energy |
|---|---|---|
| Market Cap | 25.6B | 25.0B |
| Revenue | 8.46B | 11.90B |
| EBITDA | 3.21B | 4.13B |
| EBIT | 1.85B | 2.36B |
| Net Income | 888M | 812M |
| EPS | 1.20 | 2.27 |
| Fiscal Year | 2024 | 2024 |
Income Statement Interpretations
PPL Corporation
PPL Corporation’s revenue rose steadily from $5.47B in 2020 to $8.46B in 2024, a 54.6% growth over five years, though the 1.8% increase in 2024 was modest. Net income fluctuated, with a significant loss in 2021 but rebounded to $886M in 2024. Margins improved, notably a favorable gross margin at 40.1% and net margin at 10.49%, with net margin growth of 17.9% in 2024.
Eversource Energy
Eversource Energy’s revenue grew from $8.9B in 2020 to $11.9B in 2024, a 33.7% increase over five years, but declined slightly by 0.08% in 2024. Net income showed volatility, with a loss in 2023 but recovered to $812M in 2024. Margins remain favorable with a gross margin of 31.1% and net margin of 6.82%, and net margin surged by 283.7% in the latest year, reflecting strong operational recovery.
Which one has the stronger fundamentals?
Both companies demonstrate favorable income statement fundamentals with over 57% positive evaluation metrics. PPL shows stronger gross and net margins, with consistent margin improvements and moderate revenue growth. Eversource displays higher EBIT growth and margin rebound in 2024 but with greater volatility and lower net margin. PPL’s steadier margin enhancements contrast with Eversource’s sharper fluctuations, suggesting different risk profiles.
Financial Ratios Comparison
The table below presents the latest key financial ratios for PPL Corporation and Eversource Energy, reflecting their fiscal year 2024 performance.
| Ratios | PPL Corporation | Eversource Energy |
|---|---|---|
| ROE | 6.3% | 5.4% |
| ROIC | 3.6% | 3.2% |
| P/E | 27.0 | 25.3 |
| P/B | 1.70 | 1.37 |
| Current Ratio | 0.86 | 0.76 |
| Quick Ratio | 0.71 | 0.67 |
| D/E | 1.19 | 1.94 |
| Debt-to-Assets | 41% | 49% |
| Interest Coverage | 2.36 | 2.43 |
| Asset Turnover | 0.21 | 0.20 |
| Fixed Asset Turnover | 0.26 | 0.29 |
| Payout ratio | 84.1% | 124.3% |
| Dividend yield | 3.1% | 4.9% |
Interpretation of the Ratios
PPL Corporation
PPL Corporation shows a mixed ratio profile with a favorable net margin of 10.49% and a dividend yield of 3.12%, indicating decent profitability and shareholder returns. However, weak returns on equity (6.31%) and invested capital (3.59%), along with an unfavorable current ratio (0.86) and leverage metrics, raise concerns about operational efficiency and liquidity. The company pays dividends, supported by a stable payout, but cautious monitoring of free cash flow coverage is advised due to negative free cash flow yield.
Eversource Energy
Eversource Energy presents a neutral net margin at 6.82% and a higher dividend yield of 4.91%, appealing to income-focused investors. The company faces challenges with weak ROE (5.4%) and ROIC (3.18%), and a low current ratio (0.76), suggesting similar liquidity and efficiency issues as PPL. Eversource also maintains dividend payments, but the firm’s elevated debt-to-equity ratio (1.94) and negative free cash flow yield warrant attention for sustainability risks.
Which one has the best ratios?
Both PPL Corporation and Eversource Energy exhibit a comparable proportion of favorable and unfavorable ratios, each with 21.43% favorable and 57.14% unfavorable metrics, leading to an overall unfavorable ratio evaluation. While PPL has a slightly better net margin, Eversource offers a higher dividend yield and more favorable price-to-book ratio. Neither company stands out decisively on ratio quality based on the 2024 data.
Strategic Positioning
This section compares the strategic positioning of PPL Corporation and Eversource Energy, focusing on market position, key segments, and exposure to technological disruption:
PPL Corporation
- Operates mainly in US regulated electric markets with moderate competitive pressure.
- Revenue driven by Kentucky and Pennsylvania regulated segments with some UK exposure.
- Generates electricity from coal, gas, hydro, and solar sources; no explicit disruption data.
Eversource Energy
- Competes in regulated electric and natural gas markets in New England.
- Diverse segments including electric distribution, transmission, natural gas, and water.
- Involved in solar power facilities; no detailed disruption exposure provided.
PPL Corporation vs Eversource Energy Positioning
PPL has a geographically concentrated strategy focused on regulated US and UK electric markets, while Eversource has diversified energy and water distribution in New England. PPL’s narrower segment focus contrasts with Eversource’s broader multi-utility approach, affecting their business drivers and revenue streams.
Which has the best competitive advantage?
Both companies are currently shedding value with ROIC below WACC. PPL shows a growing ROIC trend, indicating improving profitability, whereas Eversource faces declining ROIC, reflecting worsening profitability and a weaker competitive position.
Stock Comparison
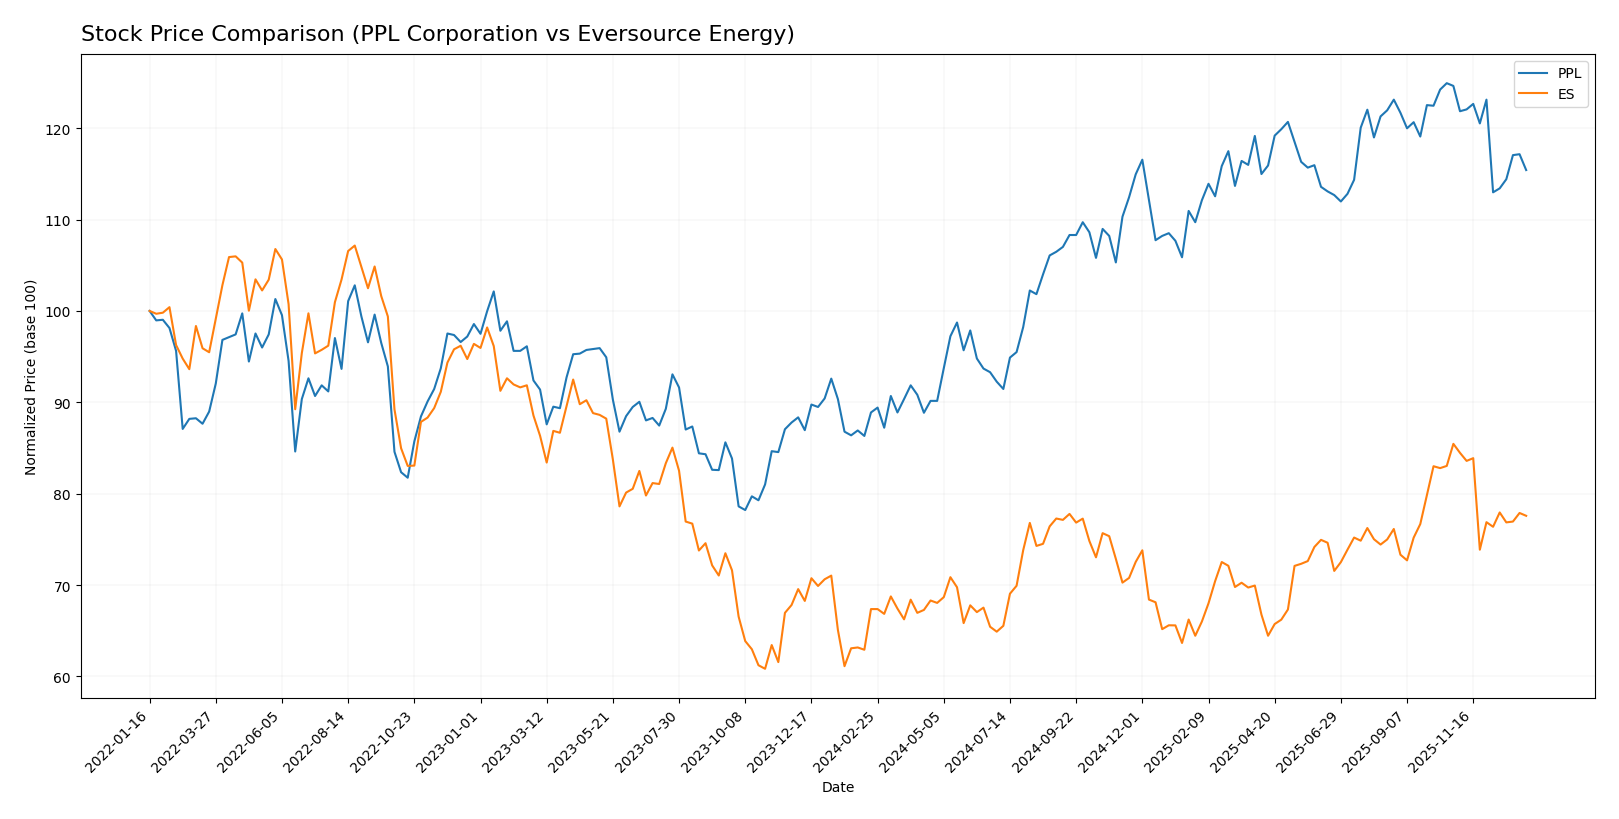
The past year shows distinct bullish trends for both PPL Corporation and Eversource Energy, with PPL’s stronger price increase and recent deceleration in gains contrasting with Eversource’s more moderate rise and sharper recent decline.
Trend Analysis
PPL Corporation’s stock recorded a 29.84% increase over the past 12 months, indicating a bullish trend with decelerating momentum. Prices ranged from 26.14 to a high of 37.44, with recent weeks showing a mild downward slope of -7.39%.
Eversource Energy’s stock gained 15.15% over the same period, also bullish but with deceleration. It exhibited greater volatility, with prices between 55.63 and 74.67, followed by a recent sharper decline of -9.21%.
Comparing both, PPL Corporation delivered the highest market performance with a 29.84% gain versus Eversource’s 15.15%, despite both experiencing recent short-term pullbacks.
Target Prices
Analysts present a positive consensus outlook for both PPL Corporation and Eversource Energy.
| Company | Target High | Target Low | Consensus |
|---|---|---|---|
| PPL Corporation | 45 | 36 | 41.29 |
| Eversource Energy | 81 | 60 | 68 |
The consensus target prices for PPL and Eversource Energy are above their current stock prices of 34.59 and 67.79 respectively, indicating expected moderate upside potential.
Analyst Opinions Comparison
This section compares analysts’ ratings and grades for PPL Corporation and Eversource Energy:
Rating Comparison
PPL Rating
- Rating: C+ with a very favorable status.
- Discounted Cash Flow Score: 1, considered very unfavorable for valuation.
- ROE Score: 3, moderate efficiency in generating profit from equity.
- ROA Score: 3, moderate effectiveness in utilizing assets to generate earnings.
- Debt To Equity Score: 2, moderate financial risk profile.
- Overall Score: 2, moderate overall financial standing.
ES Rating
- Rating: C+ with a very favorable status.
- Discounted Cash Flow Score: 1, also very unfavorable for valuation.
- ROE Score: 3, moderate efficiency in generating profit from equity.
- ROA Score: 3, moderate effectiveness in utilizing assets to generate earnings.
- Debt To Equity Score: 1, very unfavorable, indicating higher financial risk.
- Overall Score: 2, moderate overall financial standing.
Which one is the best rated?
Both PPL and ES share the same overall rating of C+ and score 2 overall, reflecting moderate financial standing. However, PPL shows a better debt-to-equity score, indicating a stronger balance sheet compared to ES’s higher financial risk.
Scores Comparison
Here is a comparison of the Altman Z-Score and Piotroski Score for PPL Corporation and Eversource Energy:
PPL Scores
- Altman Z-Score: 0.97, indicating financial distress zone risk.
- Piotroski Score: 6, representing an average financial strength.
ES Scores
- Altman Z-Score: 0.75, also in the financial distress zone.
- Piotroski Score: 6, indicating average financial strength.
Which company has the best scores?
Both PPL and ES are in the Altman Z-Score distress zone, suggesting elevated bankruptcy risk. Their Piotroski Scores are identical at 6, reflecting average financial strength for both companies.
Grades Comparison
Here is a detailed comparison of the grades assigned to PPL Corporation and Eversource Energy by recognized grading companies:
PPL Corporation Grades
The following table summarizes the recent grades and actions from reputable grading companies for PPL Corporation:
| Grading Company | Action | New Grade | Date |
|---|---|---|---|
| UBS | Maintain | Neutral | 2025-12-17 |
| Wells Fargo | Maintain | Overweight | 2025-12-12 |
| JP Morgan | Maintain | Overweight | 2025-12-11 |
| BMO Capital | Maintain | Outperform | 2025-10-21 |
| B of A Securities | Maintain | Buy | 2025-10-16 |
| Barclays | Maintain | Equal Weight | 2025-10-14 |
| UBS | Maintain | Neutral | 2025-10-10 |
| Morgan Stanley | Maintain | Overweight | 2025-09-25 |
| Barclays | Maintain | Equal Weight | 2025-07-01 |
| Morgan Stanley | Maintain | Overweight | 2025-06-18 |
Overall, PPL Corporation’s grades consistently lean toward positive ratings, with multiple “Overweight,” “Buy,” and “Outperform” assessments maintained over recent months.
Eversource Energy Grades
The following table presents the latest grades and actions from established grading firms for Eversource Energy:
| Grading Company | Action | New Grade | Date |
|---|---|---|---|
| UBS | Maintain | Neutral | 2025-12-17 |
| JP Morgan | Maintain | Underweight | 2025-12-12 |
| Janney Montgomery Scott | Upgrade | Buy | 2025-11-24 |
| Scotiabank | Maintain | Sector Underperform | 2025-11-20 |
| Mizuho | Downgrade | Neutral | 2025-11-20 |
| Wells Fargo | Downgrade | Equal Weight | 2025-11-20 |
| UBS | Downgrade | Neutral | 2025-11-06 |
| BMO Capital | Maintain | Market Perform | 2025-11-06 |
| Scotiabank | Maintain | Sector Underperform | 2025-11-06 |
| Mizuho | Maintain | Outperform | 2025-10-27 |
Eversource Energy’s grades show a more mixed trend, with several downgrades and some negative outlooks such as “Underweight” and “Sector Underperform” alongside a few positive ratings.
Which company has the best grades?
PPL Corporation has received generally more favorable grades, predominantly “Buy,” “Overweight,” and “Outperform,” indicating stronger analyst confidence. In contrast, Eversource Energy shows a more cautious consensus with multiple downgrades and “Hold” or “Underweight” ratings. This disparity may impact investor sentiment and portfolio weighting decisions.
Strengths and Weaknesses
Below is a comparative table of strengths and weaknesses for PPL Corporation and Eversource Energy based on their latest financial and operational data.
| Criterion | PPL Corporation | Eversource Energy |
|---|---|---|
| Diversification | Moderate regional focus (Kentucky, Pennsylvania, Rhode Island) with some historical international exposure | Broad utility segments including electric distribution, transmission, natural gas, and water in multiple US regions |
| Profitability | Net margin favorable at 10.49%, but ROIC below WACC indicating value destruction despite growing profitability | Lower net margin at 6.82%, ROIC also below WACC with declining profitability, signaling value destruction |
| Innovation | Limited data on innovation; slow asset turnover and unfavorable efficiency ratios suggest room for improvement | Similar challenges with asset turnover and operational efficiency; no clear innovation leadership |
| Global presence | Primarily US-focused with past UK operations now divested | US regional presence focused on Northeast utilities; no global footprint |
| Market Share | Strong in Kentucky and Pennsylvania regulated markets with stable revenue streams | Leading electric and gas utility in New England with diversified revenue sources |
Key takeaways: Both companies face challenges with profitability relative to their cost of capital, indicating potential value erosion. PPL shows improving profitability trends, while Eversource’s profitability declines. Both have moderate diversification and regional dominance but limited innovation impact. Caution and close monitoring of operational efficiency and market dynamics are advised for investors.
Risk Analysis
Below is a comparative table highlighting key risks for PPL Corporation and Eversource Energy based on the most recent data from 2024.
| Metric | PPL Corporation | Eversource Energy |
|---|---|---|
| Market Risk | Moderate (Beta 0.716) | Moderate (Beta 0.772) |
| Debt Level | High (D/E 1.19, neutral status) | Very High (D/E 1.94, very unfavorable) |
| Regulatory Risk | Significant (Utility sector, multi-state operations) | Significant (Utility sector, multi-state operations) |
| Operational Risk | Moderate (Asset turnover low, operational efficiency concerns) | Moderate (Similar low asset turnover, operational efficiency concerns) |
| Environmental Risk | Medium (Coal, gas, hydro, solar mix) | Medium (Electric, gas, solar, water services) |
| Geopolitical Risk | Low (US and UK operations, stable) | Low (US Northeast focus, stable) |
The most impactful risks for both companies are high debt levels and regulatory challenges inherent to the utility industry. Both show financial distress signals with Altman Z-Scores below 1.8, indicating potential bankruptcy risk if conditions worsen. Debt management and navigating evolving regulations will be crucial to mitigate these risks effectively.
Which Stock to Choose?
PPL Corporation shows a generally favorable income statement with positive net margin growth and improving EBIT, despite overall net income decline. Its financial ratios reveal several unfavorable metrics, including low returns and high leverage, resulting in an unfavorable global ratio opinion. The company has a slightly unfavorable economic moat, indicating value destruction but improving profitability, and holds a very favorable rating of C+.
Eversource Energy demonstrates a favorable income statement with strong EBIT and net margin growth recently, though revenue and gross profit declined. Its financial ratios also show mostly unfavorable statuses, particularly high debt levels, resulting in an unfavorable global ratio opinion. The company has a very unfavorable moat due to declining profitability and value destruction, yet maintains a very favorable C+ rating.
Investors focused on growth might find PPL’s improving profitability and positive income trends more appealing, while those prioritizing dividend yield and market valuation could perceive Eversource’s stable rating and favorable dividend yield as attractive. Risk-averse investors may note both companies face financial leverage challenges and value destruction signals.
Disclaimer: Investment carries a risk of loss of initial capital. The past performance is not a reliable indicator of future results. Be sure to understand risks before making an investment decision.
Go Further
I encourage you to read the complete analyses of PPL Corporation and Eversource Energy to enhance your investment decisions: