Eversource Energy and Pinnacle West Capital Corporation are two leading players in the regulated electric utility sector, each serving distinct regions in the United States. Both companies focus on energy generation, transmission, and distribution while investing in sustainable technologies to innovate within a traditionally stable industry. This comparison will explore their market positions, growth strategies, and financial health to help you decide which stock might be the most compelling addition to your investment portfolio.
Table of contents
Companies Overview
I will begin the comparison between Eversource Energy and Pinnacle West Capital Corporation by providing an overview of these two companies and their main differences.
Eversource Energy Overview
Eversource Energy operates as a public utility holding company focused on energy delivery. It serves residential, commercial, industrial, and municipal customers primarily in Connecticut, Massachusetts, and New Hampshire. The company’s segments include electric distribution, electric transmission, natural gas distribution, and water distribution, reflecting a diversified utility portfolio. Eversource is headquartered in Springfield, Massachusetts, with a market cap of approximately 25B USD.
Pinnacle West Capital Corporation Overview
Pinnacle West Capital Corporation provides retail and wholesale electric services mainly in Arizona through its subsidiary, Arizona Public Service Company. It engages in generation, transmission, and distribution of electricity utilizing coal, nuclear, gas, oil, and solar power. The company maintains extensive transmission and distribution infrastructure and serves about 1.3M customers. Pinnacle West, based in Phoenix, Arizona, has a market cap near 10.7B USD.
Key similarities and differences
Both companies operate in the regulated electric utilities sector, focusing on electricity generation, transmission, and distribution. Eversource offers additional water and natural gas services, whereas Pinnacle West emphasizes diverse power generation sources, including nuclear and coal. Eversource has a larger market cap and workforce compared to Pinnacle West, which serves a single state with a considerable customer base and generation capacity. Both trade on the NYSE with relatively low beta values, indicating stable stock volatility.
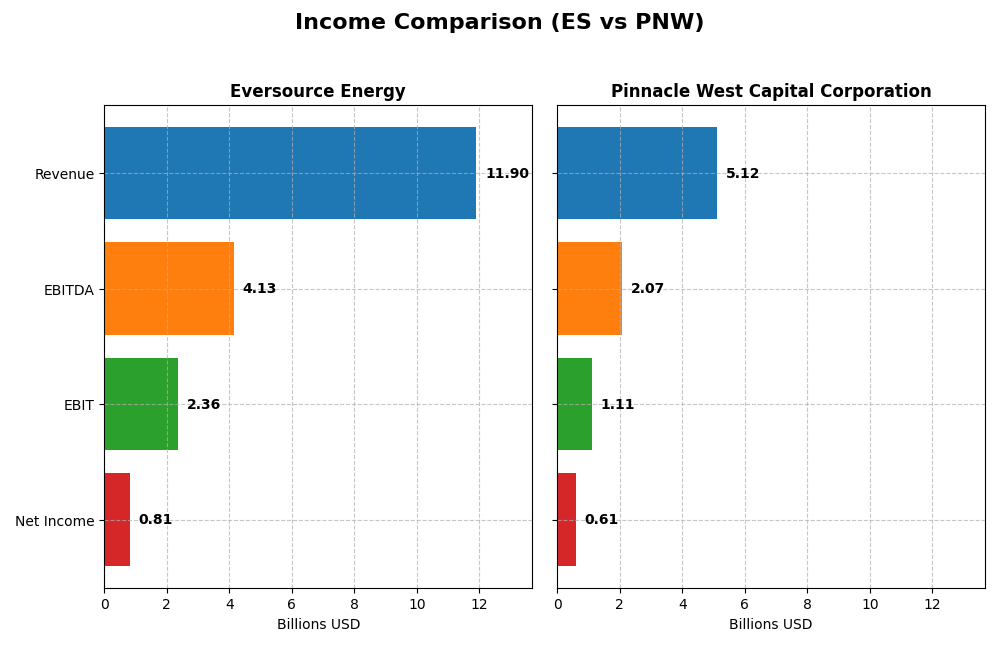
Income Statement Comparison
This table compares the key income statement metrics for Eversource Energy and Pinnacle West Capital Corporation for the fiscal year 2024.
| Metric | Eversource Energy (ES) | Pinnacle West Capital Corporation (PNW) |
|---|---|---|
| Market Cap | 25B | 11B |
| Revenue | 11.9B | 5.1B |
| EBITDA | 4.1B | 2.1B |
| EBIT | 2.4B | 1.1B |
| Net Income | 812M | 609M |
| EPS | 2.27 | 5.35 |
| Fiscal Year | 2024 | 2024 |
Income Statement Interpretations
Eversource Energy
Eversource Energy’s revenue showed a modest decline of 0.08% in 2024 after a 33.65% increase over five years, while net income contracted by 32.65% overall. Margins were mixed: gross margin dropped sharply in 2024, but EBIT and net margins improved significantly. The latest year saw a strong rebound in profitability, with EBIT and net income margins expanding despite slight revenue erosion.
Pinnacle West Capital Corporation
Pinnacle West exhibited steady revenue growth, rising 9.13% in 2024 and 42.88% over five years, accompanied by a 10.58% increase in net income over the same period. Margins remained robust, with favorable gains in gross profit, EBIT, and net margins in 2024. Operating expenses grew in line with revenue, slightly pressuring efficiency, but earnings and margins improved, signaling solid operational performance.
Which one has the stronger fundamentals?
Pinnacle West shows stronger fundamentals, with consistent revenue and net income growth and higher gross and net margins compared to Eversource. Eversource’s recent profitability recovery is notable but contrasts with its overall negative net income trend and margin contractions. Pinnacle West’s more balanced margin expansions and revenue gains suggest more stable income statement dynamics.
Financial Ratios Comparison
The table below presents the most recent key financial ratios for Eversource Energy and Pinnacle West Capital Corporation, reflecting their fiscal year 2024 performance.
| Ratios | Eversource Energy (ES) | Pinnacle West Capital Corporation (PNW) |
|---|---|---|
| ROE | 5.40% | 9.01% |
| ROIC | 3.18% | 3.48% |
| P/E | 25.29 | 15.85 |
| P/B | 1.37 | 1.43 |
| Current Ratio | 0.76 | 0.59 |
| Quick Ratio | 0.67 | 0.42 |
| D/E (Debt-to-Equity) | 1.94 | 1.64 |
| Debt-to-Assets | 48.9% | 42.3% |
| Interest Coverage | 2.43 | 2.68 |
| Asset Turnover | 0.20 | 0.20 |
| Fixed Asset Turnover | 0.29 | 0.25 |
| Payout Ratio | 124% | 65% |
| Dividend Yield | 4.91% | 4.09% |
Interpretation of the Ratios
Eversource Energy
Eversource Energy shows mixed financial health with several unfavorable ratios, including a low return on equity at 5.4% and a weak current ratio of 0.76, indicating potential liquidity concerns. The dividend yield is strong at 4.91%, supported by a consistent dividend payout, but high debt levels and low asset turnover may pose risks to sustainable returns.
Pinnacle West Capital Corporation
Pinnacle West Capital exhibits relatively stronger ratios, with a favorable net margin of 11.88% and a slightly better debt profile, though its current ratio is low at 0.59. The dividend yield stands at 4.09%, reflecting stable shareholder returns. However, asset turnover remains weak, and the company faces some liquidity challenges similar to its peer.
Which one has the best ratios?
Pinnacle West Capital holds a slight edge with a higher proportion of favorable ratios (28.57% vs. 21.43%) and less unfavorable metrics than Eversource Energy. Both companies face liquidity and asset efficiency weaknesses, but Pinnacle West’s better net margin and lower overall risk profile suggest comparatively stronger financial stability.
Strategic Positioning
This section compares the strategic positioning of Eversource Energy and Pinnacle West Capital Corporation, including Market position, Key segments, and exposure to disruption:
Eversource Energy
- Larger market cap of 25B, faces regulated electric sector competitive pressures.
- Diversified with electric distribution, transmission, natural gas, and water segments driving revenues.
- Exposure includes solar power facilities; operates regulated water utilities, indicating moderate tech disruption risk.
Pinnacle West Capital Corporation
- Smaller market cap of 10.7B, competes mainly in Arizona’s regulated electric market.
- Concentrated on electric service, transmission, and wholesale energy primarily in Arizona.
- Uses coal, nuclear, gas, oil, and solar generation; transmission infrastructure extensive, with mixed disruption exposure.
Eversource Energy vs Pinnacle West Capital Corporation Positioning
Eversource Energy follows a diversified utility model across multiple states and services, offering revenue stability but complexity. Pinnacle West Capital is more geographically and operationally focused, which may simplify management but concentrates risk regionally.
Which has the best competitive advantage?
Both companies show declining ROIC trends and ROIC below WACC, indicating value destruction. Neither currently demonstrates a sustainable competitive advantage based on MOAT evaluation, reflecting challenges in profitability and capital efficiency.
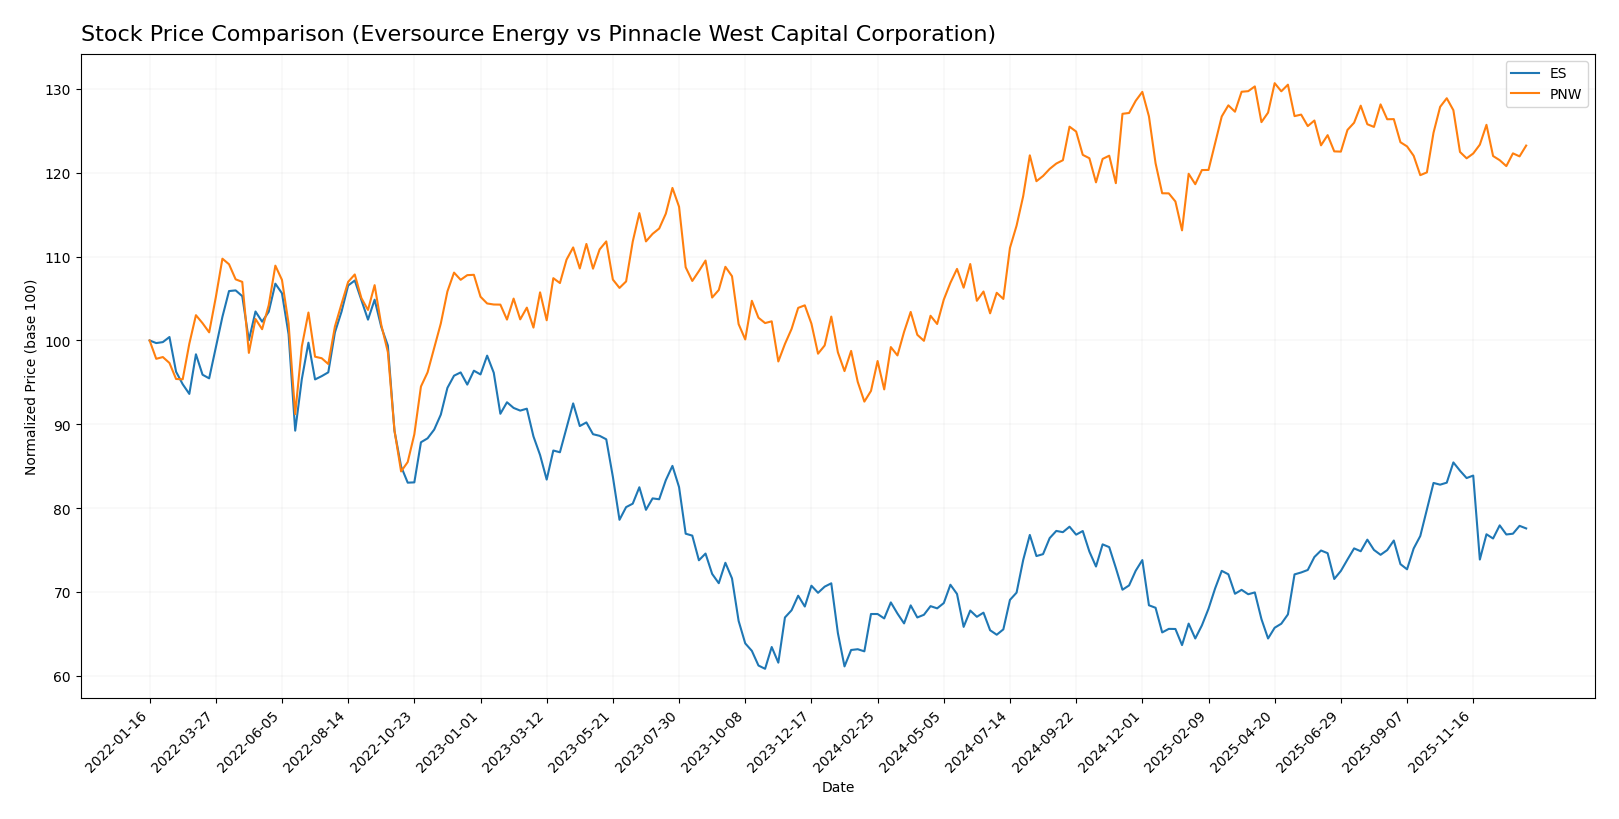
Stock Comparison
The stock price chart highlights significant bullish trends for both Eversource Energy and Pinnacle West Capital Corporation over the past 12 months, with recent declines signaling short-term downward momentum.
Trend Analysis
Eversource Energy’s stock showed a bullish trend with a 15.15% increase over the past year, marked by decelerating growth and price volatility with a 4.5 std deviation, peaking at 74.67 and bottoming at 55.63.
Pinnacle West Capital Corporation experienced a stronger bullish trend with a 31.14% rise over the same period, also with decelerating acceleration and higher volatility at 6.87 std deviation, reaching a high of 94.45 and a low of 67.92.
Comparing both, Pinnacle West Capital delivered the highest market performance with a 31.14% gain versus Eversource’s 15.15% over the past year.
Target Prices
Analysts present a clear target price consensus for both Eversource Energy and Pinnacle West Capital Corporation.
| Company | Target High | Target Low | Consensus |
|---|---|---|---|
| Eversource Energy | 81 | 60 | 68 |
| Pinnacle West Capital Corporation | 115 | 85 | 96.33 |
Eversource Energy’s consensus target of 68 is slightly above its current price of 67.79, indicating moderate upside potential. Pinnacle West’s consensus target of 96.33 also suggests room for growth from its current price of 89.07. Overall, analysts expect modest appreciation for both utilities stocks.
Analyst Opinions Comparison
This section compares analysts’ ratings and grades for Eversource Energy and Pinnacle West Capital Corporation:
Rating Comparison
Eversource Energy Rating
- Rating: C+ with a very favorable status.
- Discounted Cash Flow Score: 1, very unfavorable.
- ROE Score: 3, moderate.
- ROA Score: 3, moderate.
- Debt To Equity Score: 1, very unfavorable.
- Overall Score: 2, moderate.
Pinnacle West Capital Corporation Rating
- Rating: C+ with a very favorable status.
- Discounted Cash Flow Score: 1, very unfavorable.
- ROE Score: 3, moderate.
- ROA Score: 3, moderate.
- Debt To Equity Score: 1, very unfavorable.
- Overall Score: 2, moderate.
Which one is the best rated?
Both Eversource Energy and Pinnacle West Capital Corporation share identical ratings and financial scores. Neither company is rated better than the other based on the provided data.
Scores Comparison
Here is a comparison of the Altman Z-Score and Piotroski Score for Eversource Energy and Pinnacle West Capital Corporation:
Eversource Energy Scores
- Altman Z-Score: 0.75, indicating financial distress.
- Piotroski Score: 6, representing an average financial strength.
Pinnacle West Capital Corporation Scores
- Altman Z-Score: 0.73, also indicating financial distress.
- Piotroski Score: 4, representing an average financial strength.
Which company has the best scores?
Based on the provided scores, Eversource Energy has a slightly higher Altman Z-Score and Piotroski Score than Pinnacle West Capital Corporation, suggesting marginally better financial stability and strength.
Grades Comparison
Here is a comparison of recent grades and ratings assigned to Eversource Energy and Pinnacle West Capital Corporation:
Eversource Energy Grades
The following table presents recent grade updates from several reliable grading companies for Eversource Energy:
| Grading Company | Action | New Grade | Date |
|---|---|---|---|
| UBS | Maintain | Neutral | 2025-12-17 |
| JP Morgan | Maintain | Underweight | 2025-12-12 |
| Janney Montgomery Scott | Upgrade | Buy | 2025-11-24 |
| Scotiabank | Maintain | Sector Underperform | 2025-11-20 |
| Mizuho | Downgrade | Neutral | 2025-11-20 |
| Wells Fargo | Downgrade | Equal Weight | 2025-11-20 |
| UBS | Downgrade | Neutral | 2025-11-06 |
| BMO Capital | Maintain | Market Perform | 2025-11-06 |
| Scotiabank | Maintain | Sector Underperform | 2025-11-06 |
| Mizuho | Maintain | Outperform | 2025-10-27 |
Grades for Eversource Energy show a mix of neutral and hold ratings, with few upgrades or downgrades, indicating a cautious but stable outlook.
Pinnacle West Capital Corporation Grades
Below is the recent grading data from credible grading firms for Pinnacle West Capital Corporation:
| Grading Company | Action | New Grade | Date |
|---|---|---|---|
| UBS | Maintain | Neutral | 2025-12-17 |
| Keybanc | Downgrade | Sector Weight | 2025-12-12 |
| Keybanc | Maintain | Overweight | 2025-10-15 |
| UBS | Maintain | Neutral | 2025-10-10 |
| Barclays | Maintain | Equal Weight | 2025-10-07 |
| Argus Research | Maintain | Buy | 2025-09-30 |
| Morgan Stanley | Maintain | Equal Weight | 2025-09-25 |
| UBS | Maintain | Neutral | 2025-09-12 |
| Mizuho | Downgrade | Neutral | 2025-09-09 |
| Barclays | Maintain | Equal Weight | 2025-08-13 |
Pinnacle West’s grades predominantly revolve around neutral and hold positions, with some downgrades and occasional buy ratings, reflecting a generally cautious market stance.
Which company has the best grades?
Comparing both companies, Eversource Energy has received slightly more buy upgrades amid a majority of neutral and hold ratings, while Pinnacle West Capital Corporation’s ratings lean more towards neutral with fewer buy endorsements. This suggests investors may perceive Eversource Energy as having marginally stronger growth potential, although overall sentiment remains cautious for both.
Strengths and Weaknesses
Below is a comparison of key strengths and weaknesses for Eversource Energy (ES) and Pinnacle West Capital Corporation (PNW) based on their latest financial and operational data.
| Criterion | Eversource Energy (ES) | Pinnacle West Capital Corporation (PNW) |
|---|---|---|
| Diversification | Strong with electric, gas, water, and other segments totaling over $13B revenue in 2024 | Primarily electric service focused with ~$2.6B revenue in 2024, less diversified |
| Profitability | Moderate net margin of 6.82%, but declining ROIC and unfavorable profitability ratios | Higher net margin of 11.88% but also declining ROIC and some unfavorable ratios |
| Innovation | Limited evidence of innovation; traditional utility services dominate | Similar traditional utility focus, limited innovation indicators |
| Global presence | Mainly regional U.S. Northeast presence, no significant global footprint | Regional U.S. Southwest presence, no global operations |
| Market Share | Large market share in electric distribution ($9B revenue segment) | Smaller market share, electric service revenue around $2.56B |
Key takeaways: Eversource Energy shows strong diversification and a dominant electric distribution business but suffers from declining profitability and efficiency. Pinnacle West is less diversified but maintains a higher net margin, though it also faces profitability challenges. Both require caution due to declining returns on invested capital.
Risk Analysis
Below is a comparative risk table for Eversource Energy (ES) and Pinnacle West Capital Corporation (PNW) based on the most recent 2024 data:
| Metric | Eversource Energy (ES) | Pinnacle West Capital Corporation (PNW) |
|---|---|---|
| Market Risk | Moderate (Beta 0.77, stable range) | Lower (Beta 0.54, less volatile) |
| Debt Level | High (Debt/Equity 1.94, neutral debt-to-assets 49%) | High (Debt/Equity 1.64, neutral debt-to-assets 42%) |
| Regulatory Risk | Moderate (regulated utility in Northeast US) | Moderate (regulated utility primarily in Arizona) |
| Operational Risk | Medium (diverse segments: electric, gas, water) | Medium (generation, transmission, distribution) |
| Environmental Risk | Moderate (some exposure via natural gas, solar assets) | Moderate (coal, nuclear, gas, solar mix) |
| Geopolitical Risk | Low (US regional focus) | Low (US regional focus) |
The most impactful risks for both companies are their relatively high debt levels and regulatory exposure inherent in the utility sector. Both firms operate in regulated environments, which can limit pricing power but provide stability. Eversource’s slightly higher beta suggests more market sensitivity. Notably, both companies’ Altman Z-Scores fall within the distress zone, indicating elevated financial risk, requiring cautious investment consideration.
Which Stock to Choose?
Eversource Energy (ES) shows mixed income evolution with favorable recent EBIT and net margin growth but an overall decline in net income and EPS over 2020-2024. Its financial ratios reveal mostly unfavorable metrics, including low ROE (5.4%) and high debt-to-equity (1.94), alongside a “Very Unfavorable” moat due to declining ROIC below WACC. The rating is “C+” with moderate overall scores but very unfavorable DCF and debt scores.
Pinnacle West Capital Corporation (PNW) exhibits generally favorable income trends, including positive revenue and net income growth over five years, with strong recent EBIT margin (21.74%) and net margin (11.88%). Financial ratios are slightly better, with a higher net margin and lower debt-to-equity (1.64), but also a “Very Unfavorable” moat rating for declining ROIC below WACC. Its rating matches ES at “C+” with similar moderate financial scores.
For investors, PNW might appear more favorable for those prioritizing growth and higher profitability, given its stronger income growth and better margins. Conversely, ES could be considered by investors focused on dividend yield and stability, despite its less favorable financial ratios and value destruction signals. Both companies carry risks related to declining ROIC and financial leverage.
Disclaimer: Investment carries a risk of loss of initial capital. The past performance is not a reliable indicator of future results. Be sure to understand risks before making an investment decision.
Go Further
I encourage you to read the complete analyses of Eversource Energy and Pinnacle West Capital Corporation to enhance your investment decisions: