In the evolving energy landscape, Eversource Energy and Oklo Inc. stand out as compelling players within the regulated electric industry. Eversource, a well-established utility giant, delivers electricity, natural gas, and water to millions in the Northeast. Meanwhile, Oklo innovates with advanced fission power plants, pushing the frontier of nuclear energy. This article will help you determine which company offers the most attractive investment opportunity in 2026.
Table of contents
Companies Overview
I will begin the comparison between Eversource Energy and Oklo Inc. by providing an overview of these two companies and their main differences.
Eversource Energy Overview
Eversource Energy is a public utility holding company focused on energy delivery through regulated electric, natural gas, and water distribution services. Serving approximately 226K water customers and a broad range of residential, commercial, industrial, and municipal clients, it operates primarily in Connecticut, Massachusetts, and New Hampshire. Founded as Northeast Utilities, it rebranded to Eversource Energy in 2015 and is headquartered in Springfield, MA.
Oklo Inc. Overview
Oklo Inc. specializes in designing and developing fission power plants aimed at delivering reliable, commercial-scale energy within the United States. The company also offers used nuclear fuel recycling services. Founded in 2013 and headquartered in Santa Clara, CA, Oklo is a smaller utility player with a focus on innovative nuclear energy solutions. It became publicly traded in 2021 and maintains a lean workforce relative to traditional utilities.
Key similarities and differences
Both Eversource Energy and Oklo operate within the regulated electric utility sector in the US and are listed on the NYSE. However, Eversource’s business model centers on conventional electric, gas, and water distribution with a large customer base and workforce, while Oklo focuses on advanced nuclear fission technology and fuel recycling with a smaller team. Their geographical footprints and energy delivery methods distinctly separate their market approaches.
Income Statement Comparison
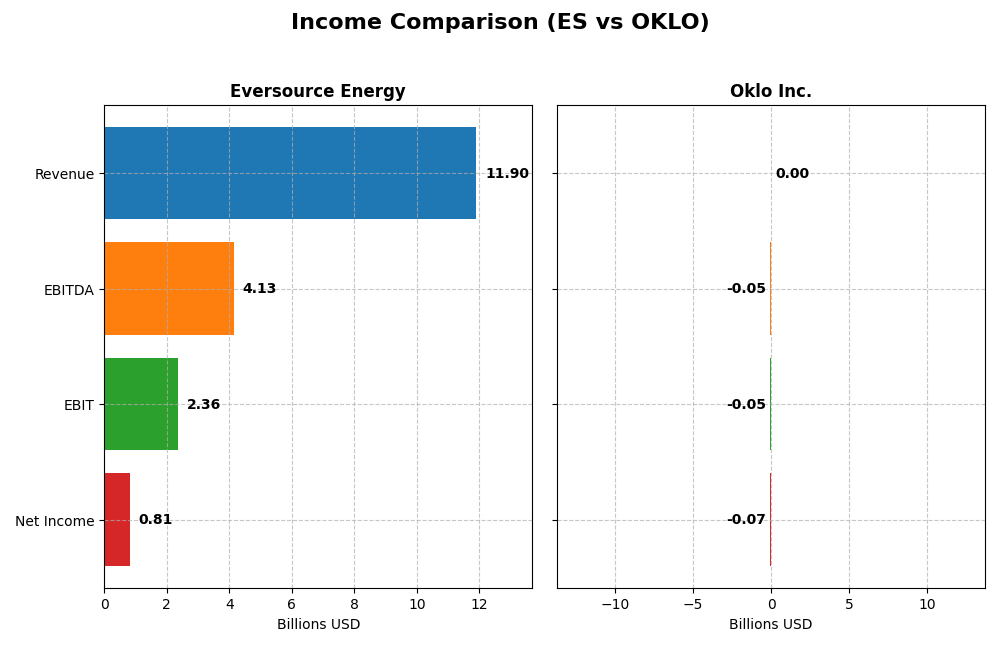
Below is a comparison of the most recent fiscal year income statement metrics for Eversource Energy and Oklo Inc.
| Metric | Eversource Energy | Oklo Inc. |
|---|---|---|
| Market Cap | 25B | 16.5B |
| Revenue | 11.9B | 0 |
| EBITDA | 4.13B | -52.5M |
| EBIT | 2.36B | -52.8M |
| Net Income | 812M | -73.6M |
| EPS | 2.27 | -0.74 |
| Fiscal Year | 2024 | 2024 |
Income Statement Interpretations
Eversource Energy
Eversource Energy’s revenue showed a modest decline of 0.08% in 2024 after a 33.65% growth over five years, while net income fell by 32.65% overall despite a strong rebound in 2024. Gross and EBIT margins remain favorable at 31.12% and 19.79%, respectively. The latest year showed a sharp EBIT increase of 306%, improving net margins and EPS substantially compared to 2023.
Oklo Inc.
Oklo Inc. reported zero revenue throughout 2021-2024, reflecting its early-stage development focus. Operating losses deepened from -$5.16M in 2021 to -$52.8M in 2024, with negative EBIT margins and no gross profit recorded. Interest income provided some offset, but net income remained negative, worsened by a 59% EPS decline in 2024, signaling continued investment without current profitability.
Which one has the stronger fundamentals?
Eversource Energy demonstrates stronger fundamentals, supported by positive margins, stable revenue, and a significant turnaround in profitability in the latest year. Conversely, Oklo Inc. shows unfavorable income metrics, with no revenue and increasing losses, typical of a growth-stage company investing heavily in R&D. Overall, Eversource’s financials indicate a more mature and stable income profile.
Financial Ratios Comparison
The table below presents a side-by-side comparison of key financial ratios for Eversource Energy and Oklo Inc. based on their most recent fiscal year data from 2024.
| Ratios | Eversource Energy (ES) | Oklo Inc. (OKLO) |
|---|---|---|
| ROE | 5.40% | -29.35% |
| ROIC | 3.18% | -19.23% |
| P/E | 25.29 | -28.52 |
| P/B | 1.37 | 8.37 |
| Current Ratio | 0.76 | 43.47 |
| Quick Ratio | 0.67 | 43.47 |
| D/E (Debt-to-Equity) | 1.94 | 0.01 |
| Debt-to-Assets | 48.85% | 0.46% |
| Interest Coverage | 2.43 | 0 |
| Asset Turnover | 0.20 | 0 |
| Fixed Asset Turnover | 0.29 | 0 |
| Payout ratio | 124.32% | 0 |
| Dividend yield | 4.91% | 0 |
Interpretation of the Ratios
Eversource Energy
Eversource Energy displays mixed financial health with several unfavorable ratios, including return on equity (5.4%) and return on invested capital (3.18%), both below ideal benchmarks. The company’s liquidity ratios are weak, with a current ratio of 0.76 and quick ratio of 0.67, raising potential short-term solvency concerns. Its dividend yield is favorable at 4.91%, supported by a stable dividend payout, reflecting consistent shareholder returns despite some operational challenges.
Oklo Inc.
Oklo Inc. shows predominantly unfavorable ratios, including negative returns on equity (-29.35%) and invested capital (-19.23%), indicating ongoing losses. The company’s high current ratio of 43.47 is unusual and flagged as unfavorable, possibly due to an atypical asset structure. Oklo does not pay dividends, likely reflecting its growth and reinvestment focus amid early-stage development and negative net income, prioritizing R&D and expansion over shareholder distributions.
Which one has the best ratios?
Both companies exhibit predominantly unfavorable financial ratios, with Oklo facing more pronounced negative profitability and operational metrics. Eversource presents more stable dividend returns but suffers from weak liquidity and profitability ratios. Considering the balance of favorable and unfavorable indicators, neither company shows a clearly superior overall ratio profile at this stage.
Strategic Positioning
This section compares the strategic positioning of Eversource Energy and Oklo Inc., including Market position, Key segments, and disruption:
Eversource Energy
- Established regulated utility with strong presence in Northeast US, facing stable competition.
- Diverse segments: electric distribution, transmission, natural gas, and water services.
- Limited exposure to technological disruption due to regulated, traditional utility model.
Oklo Inc.
- Emerging fission power plant developer, competing in innovative nuclear energy market.
- Focused on fission power plant design and used nuclear fuel recycling services.
- High exposure to technological disruption with innovative nuclear technology development.
Eversource Energy vs Oklo Inc. Positioning
Eversource Energy operates a diversified utility portfolio across multiple regulated segments, providing stability. Oklo Inc. focuses on concentrated nuclear technology innovation, exposing it to higher technological and market risks but potential growth opportunities.
Which has the best competitive advantage?
Both companies show very unfavorable MOAT evaluations with declining ROIC and value destruction. Eversource’s established regulated business offers more stability, while Oklo’s high-risk innovation currently lacks efficient capital returns.
Stock Comparison
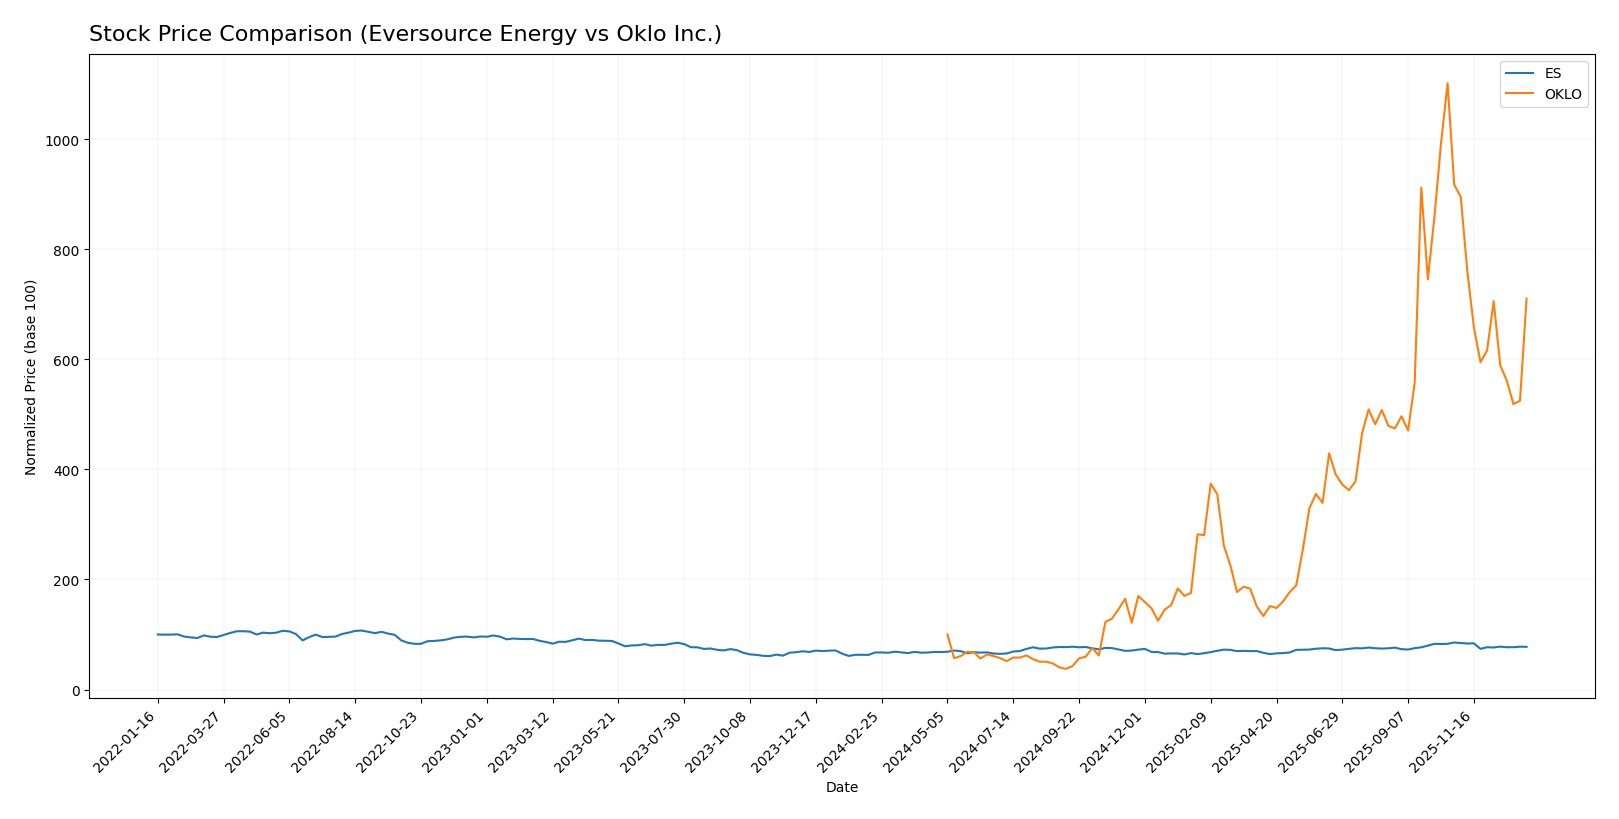
The stock price movements of Eversource Energy and Oklo Inc. over the past year reveal significant fluctuations and contrasting trading dynamics, with Oklo exhibiting a notably higher overall price appreciation despite recent declines.
Trend Analysis
Eversource Energy’s stock shows a bullish trend over the past 12 months with a 15.15% price increase, decelerating growth, and a price range between 55.63 and 74.67. Recent months indicate a bearish trend with a -9.21% decline.
Oklo Inc. experienced a strong bullish trend with a 610.11% gain over the same period, though with decelerating momentum and high volatility. Recently, the stock faced a sharper bearish correction of -22.59%.
Comparing both, Oklo delivered the highest market performance with a substantial 610.11% increase versus Eversource Energy’s 15.15%, despite both facing recent downward corrections.
Target Prices
Analysts present a clear target price consensus for both Eversource Energy and Oklo Inc., indicating expected price ranges and median values.
| Company | Target High | Target Low | Consensus |
|---|---|---|---|
| Eversource Energy | 81 | 60 | 68 |
| Oklo Inc. | 150 | 95 | 125.67 |
The target consensus for Eversource Energy at 68 is slightly above its current price of 67.79, suggesting moderate upside potential. Oklo Inc.’s consensus target of 125.67 exceeds its current price of 105.31, indicating stronger expected growth from analysts.
Analyst Opinions Comparison
This section compares analysts’ ratings and grades for Eversource Energy and Oklo Inc.:
Rating Comparison
Eversource Energy Rating
- Rating: C+, considered very favorable overall.
- Discounted Cash Flow Score: 1, very unfavorable.
- ROE Score: 3, moderate efficiency in equity use.
- ROA Score: 3, moderate asset utilization.
- Debt To Equity Score: 1, very unfavorable risk.
- Overall Score: 2, moderate overall financials.
Oklo Inc. Rating
- Rating: C+, considered very favorable overall.
- Discounted Cash Flow Score: 3, moderate.
- ROE Score: 1, very unfavorable equity use.
- ROA Score: 1, very unfavorable asset use.
- Debt To Equity Score: 5, very favorable risk.
- Overall Score: 2, moderate overall financials.
Which one is the best rated?
Both companies share the same overall rating of C+ and an overall score of 2, indicating moderate financial standing. Eversource shows stronger operational efficiency scores, while Oklo has a better debt-to-equity rating.
Scores Comparison
Here is a comparison of the financial scores for Eversource Energy and Oklo Inc.:
Eversource Energy Scores
- Altman Z-Score: 0.75, in distress zone indicating high bankruptcy risk.
- Piotroski Score: 6, indicating average financial strength.
Oklo Inc. Scores
- Altman Z-Score: 339.43, in safe zone indicating very low bankruptcy risk.
- Piotroski Score: 2, indicating very weak financial strength.
Which company has the best scores?
Oklo Inc. has a much stronger Altman Z-Score, signaling low bankruptcy risk, while Eversource Energy shows distress. However, Eversource’s Piotroski Score is higher, reflecting better financial health compared to Oklo’s very weak score.
Grades Comparison
The following is a comparison of recent grades and consensus ratings for Eversource Energy and Oklo Inc.:
Eversource Energy Grades
This table summarizes recent grades assigned to Eversource Energy by major grading firms.
| Grading Company | Action | New Grade | Date |
|---|---|---|---|
| UBS | Maintain | Neutral | 2025-12-17 |
| JP Morgan | Maintain | Underweight | 2025-12-12 |
| Janney Montgomery Scott | Upgrade | Buy | 2025-11-24 |
| Scotiabank | Maintain | Sector Underperform | 2025-11-20 |
| Mizuho | Downgrade | Neutral | 2025-11-20 |
| Wells Fargo | Downgrade | Equal Weight | 2025-11-20 |
| UBS | Downgrade | Neutral | 2025-11-06 |
| BMO Capital | Maintain | Market Perform | 2025-11-06 |
| Scotiabank | Maintain | Sector Underperform | 2025-11-06 |
| Mizuho | Maintain | Outperform | 2025-10-27 |
Eversource Energy’s grades show a mixed trend with several downgrades to neutral or equal weight, but also some buy ratings and stable market perform grades.
Oklo Inc. Grades
This table shows recent grades assigned to Oklo Inc. by recognized grading firms.
| Grading Company | Action | New Grade | Date |
|---|---|---|---|
| Seaport Global | Upgrade | Buy | 2025-12-08 |
| UBS | Maintain | Neutral | 2025-12-03 |
| B of A Securities | Maintain | Neutral | 2025-11-12 |
| B. Riley Securities | Maintain | Buy | 2025-11-12 |
| Wedbush | Maintain | Outperform | 2025-11-12 |
| B of A Securities | Downgrade | Neutral | 2025-09-30 |
| Seaport Global | Downgrade | Neutral | 2025-09-23 |
| Wedbush | Maintain | Outperform | 2025-09-22 |
| Wedbush | Maintain | Outperform | 2025-08-14 |
| Wedbush | Maintain | Outperform | 2025-08-12 |
Oklo Inc.’s grades indicate a generally positive outlook, with multiple maintain ratings at Outperform and Buy levels and a recent upgrade to Buy.
Which company has the best grades?
Oklo Inc. holds a stronger overall grades profile, featuring more Buy and Outperform ratings compared to Eversource Energy’s mix of Neutral and Underweight grades. This difference suggests Oklo may be viewed more favorably by analysts, potentially affecting investor sentiment and portfolio positioning.
Strengths and Weaknesses
Below is a comparative table of strengths and weaknesses for Eversource Energy and Oklo Inc. based on the latest financial and operational data.
| Criterion | Eversource Energy (ES) | Oklo Inc. (OKLO) |
|---|---|---|
| Diversification | Moderately diversified across electric, gas, and water segments with stable revenues (e.g., $9.07B in Electric Distribution 2024) | Limited diversification, primarily focused on advanced nuclear technology development |
| Profitability | Moderate profitability with a net margin of 6.82%, but ROIC (3.18%) below WACC, indicating value destruction | Negative profitability and ROIC (-19.23%), indicating significant losses and value destruction |
| Innovation | Traditional utility with incremental improvements, no significant breakthrough innovations reported | High innovation potential in nuclear tech but currently unprofitable and high risk |
| Global presence | Primarily regional in the U.S. Northeast, no significant international footprint | No notable global presence yet, focused on U.S. market and technology development |
| Market Share | Strong regional market share in electric and gas distribution | Emerging player with no significant market share yet |
Key takeaways: Eversource offers stable, diversified utility services with moderate profitability but faces declining returns and limited innovation. Oklo is an innovative but high-risk company with negative profitability and no established market presence, suitable only for risk-tolerant investors.
Risk Analysis
Below is a comparative risk table for Eversource Energy (ES) and Oklo Inc. (OKLO) based on the latest 2024 financial and operational data.
| Metric | Eversource Energy (ES) | Oklo Inc. (OKLO) |
|---|---|---|
| Market Risk | Moderate (Beta 0.772) | Moderate (Beta 0.773) |
| Debt Level | High (Debt/Equity 1.94) | Low (Debt/Equity 0.01) |
| Regulatory Risk | Moderate (Utility regulations) | High (Nuclear energy regulation) |
| Operational Risk | Moderate (Aging infrastructure) | High (New technology, scale-up) |
| Environmental Risk | Moderate (Energy production) | High (Nuclear waste management) |
| Geopolitical Risk | Low (Regional US focus) | Moderate (US energy policy impact) |
Eversource faces significant debt and operational risks typical of regulated utilities, with moderate regulatory and environmental challenges. Oklo, while having low debt, carries higher regulatory and operational risks due to its nuclear technology and waste recycling. The most impactful risks are Oklo’s regulatory hurdles and Eversource’s financial leverage, both requiring cautious monitoring.
Which Stock to Choose?
Eversource Energy (ES) shows stable income with a favorable gross and EBIT margin, despite a slight revenue decline recently. Its profitability is moderate, but financial ratios reveal several weaknesses, including a high debt level and unfavorable return on equity, resulting in a very favorable rating but an overall unfavorable ratio evaluation.
Oklo Inc. (OKLO) presents a challenging income profile with no revenue growth and negative profitability metrics. Although it maintains very low debt and a strong current ratio, its financial ratios and profitability remain mostly unfavorable, reflected in a very favorable rating but a global unfavorable ratios evaluation.
For investors, the choice might depend on risk tolerance and investment focus: those prioritizing established profitability and moderate stability might lean towards Eversource Energy, whereas investors with a tolerance for volatility and a focus on potential growth in emerging sectors might consider Oklo Inc., despite its current financial challenges.
Disclaimer: Investment carries a risk of loss of initial capital. The past performance is not a reliable indicator of future results. Be sure to understand risks before making an investment decision.
Go Further
I encourage you to read the complete analyses of Eversource Energy and Oklo Inc. to enhance your investment decisions: