Home > Comparison > Utilities > NEE vs ES
The strategic rivalry between NextEra Energy, Inc. and Eversource Energy shapes the utilities sector’s evolution. NextEra operates as a capital-intensive renewable power giant, focusing on generation and transmission across multiple energy sources. Eversource Energy emphasizes regulated electric and natural gas distribution with integrated water services. This analysis pits growth-driven clean energy capacity against steady regulated utility cash flows to identify which corporate trajectory offers superior risk-adjusted returns for diversified portfolios.
Table of contents
Companies Overview
NextEra Energy and Eversource Energy rank among the most influential players in the regulated electric utilities sector.
NextEra Energy, Inc.: Renewable Power Leader
NextEra Energy dominates as a regulated electric utility focusing on clean energy generation. It generates electricity via wind, solar, nuclear, coal, and natural gas facilities. In 2021, it strategically expanded its portfolio of long-term contracted renewable assets, including battery storage projects, reinforcing its competitive edge in sustainable energy infrastructure.
Eversource Energy: Regional Energy Delivery Specialist
Eversource Energy operates primarily in electric and natural gas distribution across New England. Its core revenue stems from regulated energy delivery and water distribution services. In 2021, Eversource emphasized enhancing its transmission and distribution networks while continuing investments in solar power facilities, targeting reliability and regional service expansion.
Strategic Collision: Similarities & Divergences
Both companies leverage regulated utilities but diverge in scale and focus. NextEra pursues a renewable-centric growth model with broad geographic reach, while Eversource centers on regional energy delivery and infrastructure reliability. The battle for market share hinges on clean energy integration versus stable utility service expansion. Their distinct profiles appeal to investors prioritizing innovation versus steady regulated cash flow.
Income Statement Comparison
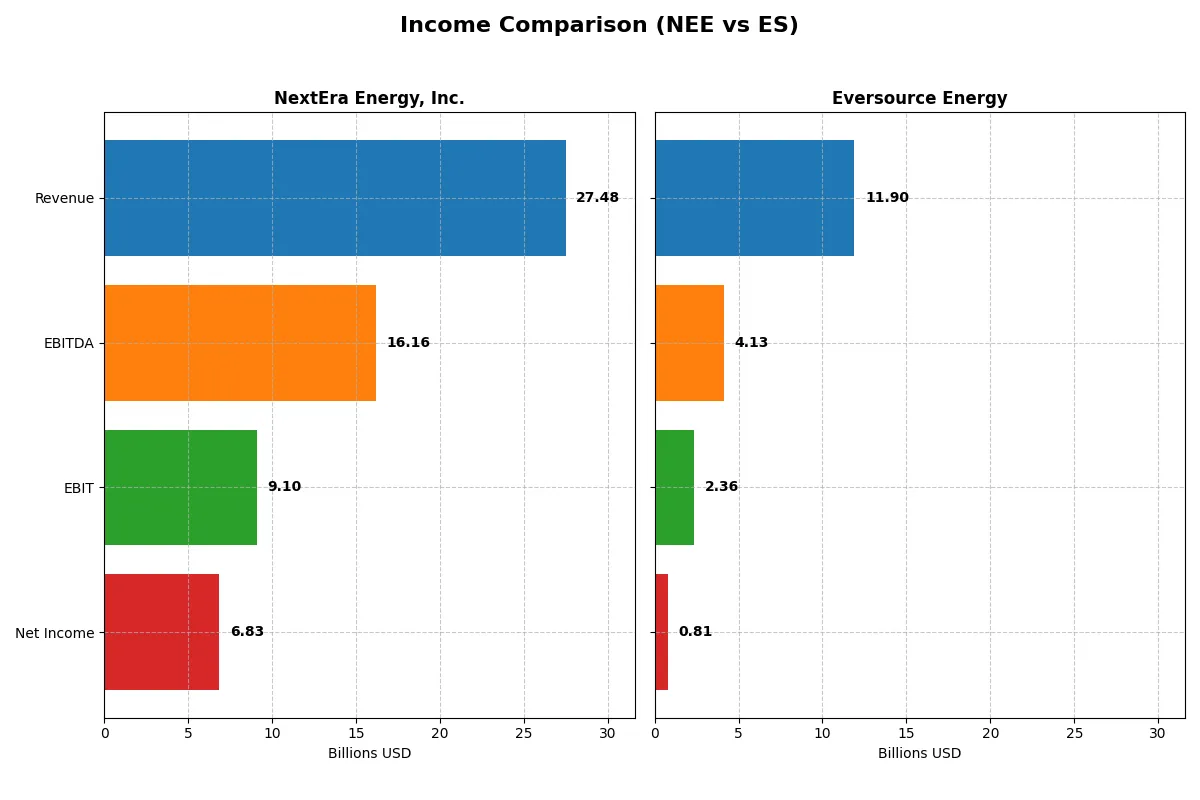
This data dissects the core profitability and scalability of both corporate engines to reveal who dominates the bottom line:
| Metric | NextEra Energy, Inc. (NEE) | Eversource Energy (ES) |
|---|---|---|
| Revenue | 27.48B | 11.90B |
| Cost of Revenue | 10.22B | 8.20B |
| Operating Expenses | 8.98B | 998M |
| Gross Profit | 17.26B | 3.70B |
| EBITDA | 16.17B | 4.13B |
| EBIT | 9.10B | 2.36B |
| Interest Expense | 4.57B | 1.11B |
| Net Income | 6.83B | 812M |
| EPS | 3.31 | 2.27 |
| Fiscal Year | 2025 | 2024 |
Income Statement Analysis: The Bottom-Line Duel
This income statement comparison reveals the true efficiency and profitability of NextEra Energy and Eversource Energy’s business models.
NextEra Energy, Inc. Analysis
NextEra’s revenue climbed steadily from $17B in 2021 to $27.5B in 2025, with net income almost doubling to $6.8B. Its gross margin remains robust at 62.8%, and net margin is strong at 24.9%. Despite a higher interest expense, its operational momentum and margin expansion confirm solid efficiency in 2025.
Eversource Energy Analysis
Eversource’s revenue stayed flat near $11.9B from 2023 to 2024, with net income recovering to $812M after a loss in 2023. Gross margin sits at 31.1%, half of NextEra’s, and net margin at a modest 6.8%. The sharp EBIT and net margin rebound in 2024 shows improving profitability but from a weaker base.
Margin Power vs. Revenue Scale
NextEra clearly leads in scale and margin strength, delivering nearly triple Eversource’s revenue and fourfold net income in the latest year. NextEra’s high and expanding profitability offers a more compelling profile, while Eversource’s recent recovery signals potential but remains less efficient. Investors seeking dominant margin power may find NextEra more attractive.
Financial Ratios Comparison
These vital ratios act as a diagnostic tool to expose the underlying fiscal health, valuation premiums, and capital efficiency of the companies compared below:
| Ratios | NextEra Energy, Inc. (NEE) | Eversource Energy (ES) |
|---|---|---|
| ROE | 13.86% | 5.40% |
| ROIC | 4.04% | 3.18% |
| P/E | 21.2 | 25.3 |
| P/B | 2.94 | 1.37 |
| Current Ratio | 0.47 | 0.76 |
| Quick Ratio | 0.38 | 0.67 |
| D/E (Debt to Equity) | 1.64 | 1.94 |
| Debt-to-Assets | 43.3% | 48.9% |
| Interest Coverage | 3.35 | 2.43 |
| Asset Turnover | 0.13 | 0.20 |
| Fixed Asset Turnover | 0.18 | 0.29 |
| Payout ratio | 61.0% | 124.3% |
| Dividend yield | 2.87% | 4.91% |
| Fiscal Year | 2024 | 2024 |
Efficiency & Valuation Duel: The Vital Signs
Financial ratios serve as a company’s DNA, uncovering hidden risks and operational strengths that raw figures alone cannot reveal.
NextEra Energy, Inc.
NextEra Energy shows a solid 13.9% ROE and a robust 28.1% net margin, reflecting strong profitability. Its P/E of 21.2 and P/B of 2.94 suggest a fairly valued stock, neither cheap nor stretched. The 2.9% dividend yield rewards shareholders, indicating a balanced capital allocation between payouts and operational needs.
Eversource Energy
Eversource posts a modest 5.4% ROE and a 6.8% net margin, implying weaker profitability. Its higher P/E of 25.3 signals an expensive valuation relative to earnings, despite a low P/B of 1.37. A 4.9% dividend yield offers attractive income, but underlying operational metrics raise caution on growth sustainability.
Profitability Strength vs. Income Appeal
NextEra Energy offers better profitability and a balanced valuation, with dividends complementing operational efficiency. Eversource provides higher dividend income but trades at a premium amid weaker returns. Investors prioritizing growth and operational strength may prefer NextEra, while income-focused profiles might lean toward Eversource’s yield.
Which one offers the Superior Shareholder Reward?
NextEra Energy (NEE) and Eversource Energy (ES) follow contrasting shareholder reward strategies. NEE pays a moderate 2.87% dividend yield with a sustainable 61% payout ratio, supported by positive free cash flow (FCF) coverage and consistent buybacks enhancing total returns. ES offers a higher 4.91% dividend yield but with an unsustainable 124% payout ratio and deeply negative FCF, signaling dividend risk. ES’s aggressive dividend is not backed by cash flow, and capex outpaces operating cash flow, pressuring long-term sustainability. NEE’s balanced dividend and buyback model better supports durable shareholder value in 2026. I conclude NEE offers the superior total return profile given its prudent capital allocation and healthier cash flow fundamentals.
Comparative Score Analysis: The Strategic Profile
The radar chart reveals the fundamental DNA and trade-offs of NextEra Energy, Inc. and Eversource Energy, highlighting their financial strengths and vulnerabilities:
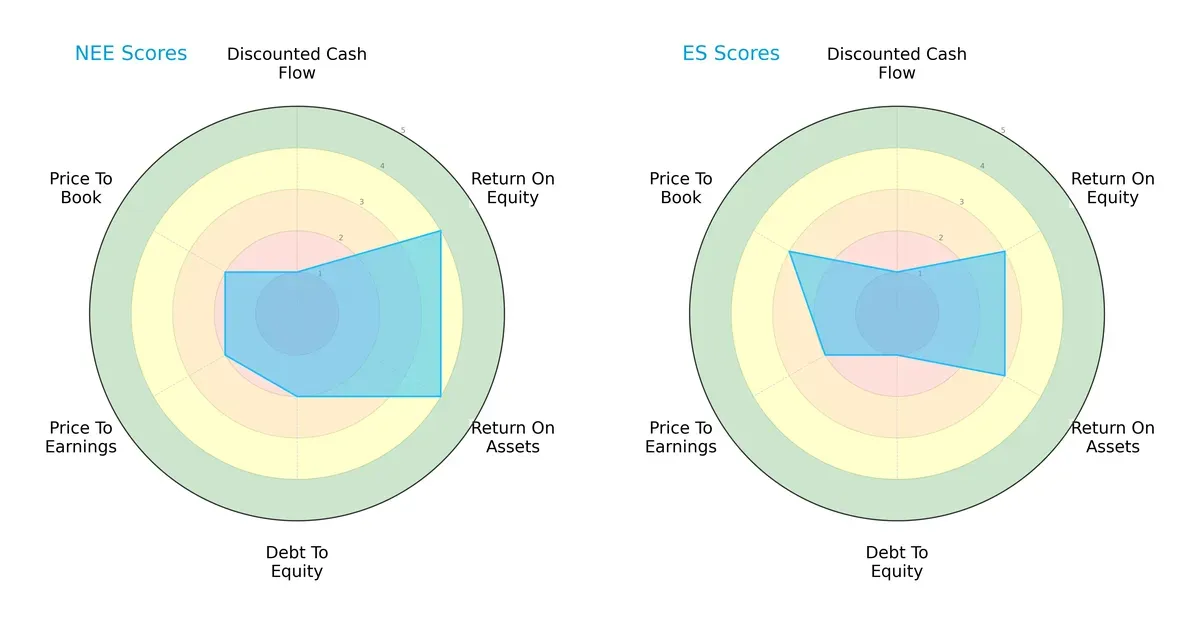
NextEra Energy shows a more balanced profile, excelling in return on equity (ROE) and return on assets (ROA) with scores of 4 each, compared to Eversource’s moderate 3s. Both firms share a very unfavorable discounted cash flow (DCF) score of 1, indicating valuation concerns. NextEra manages debt better with a moderate debt-to-equity score of 2, while Eversource scores poorly at 1. Valuation metrics (P/E and P/B) are moderate for both, but Eversource slightly outperforms in price-to-book with a 3 versus NextEra’s 2. Overall, NextEra relies on operational efficiency, while Eversource struggles on leverage but offers a slight valuation edge.
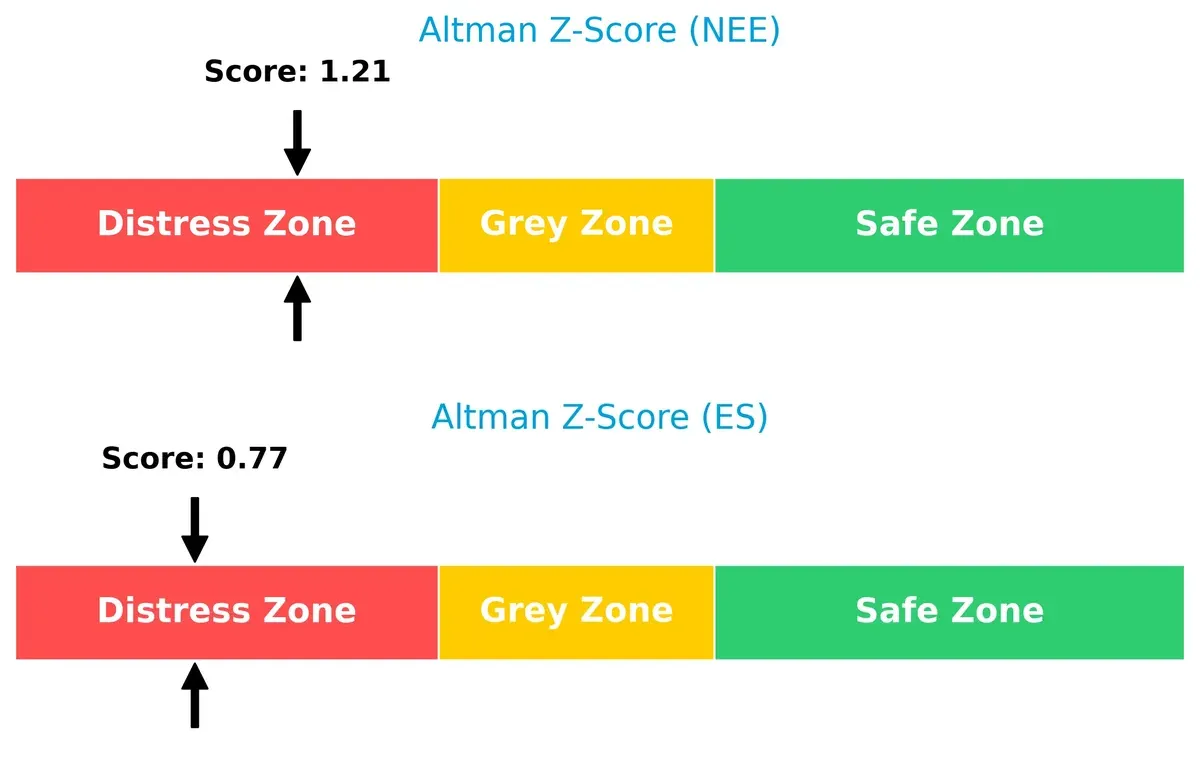
Bankruptcy Risk: Solvency Showdown
NextEra Energy’s Altman Z-Score of 1.21 surpasses Eversource’s weaker 0.77, but both remain in the distress zone, signaling heightened bankruptcy risk in this economic cycle:
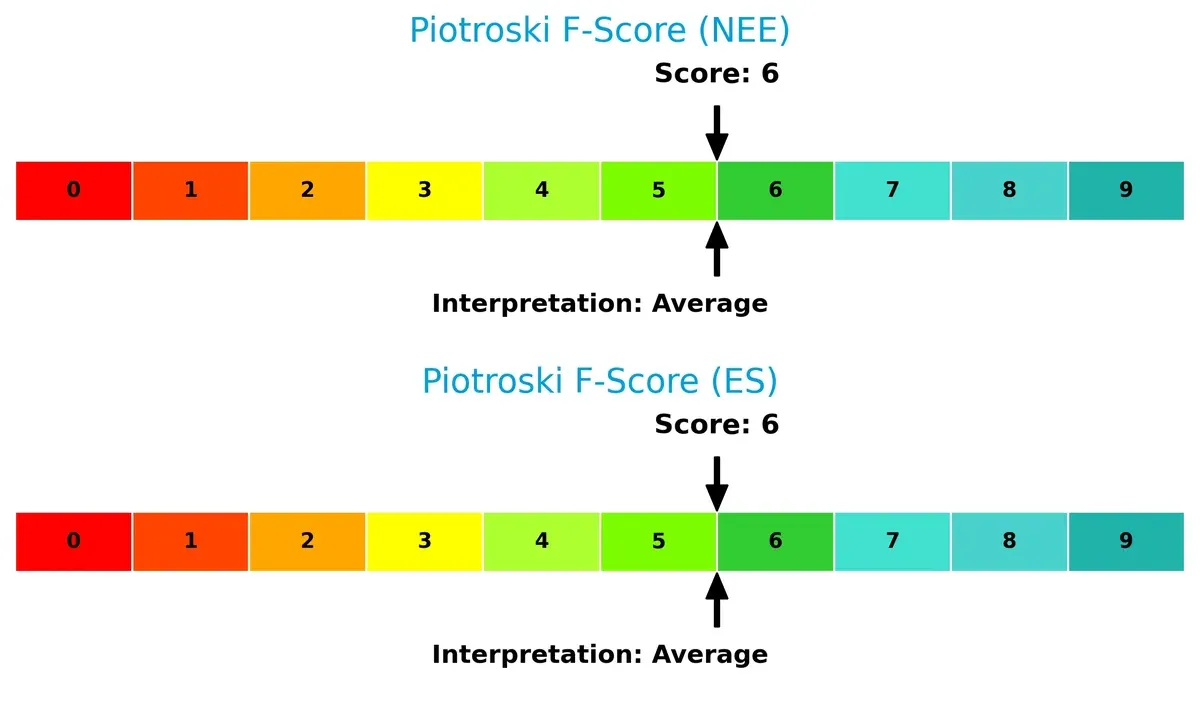
Financial Health: Quality of Operations
NextEra and Eversource both hold a Piotroski F-Score of 6, indicating average financial health. Neither shows immediate red flags, but neither exhibits the robust strength that high scores (8-9) would suggest:
How are the two companies positioned?
This section dissects the operational DNA of NextEra Energy and Eversource Energy by comparing revenue distribution and their internal strengths and weaknesses. The final aim is to confront their economic moats to identify which model offers the most resilient, sustainable competitive advantage today.
Revenue Segmentation: The Strategic Mix
This side-by-side visual breaks down how NextEra Energy and Eversource Energy diversify their revenue streams and highlights each firm’s dominant sector bets:
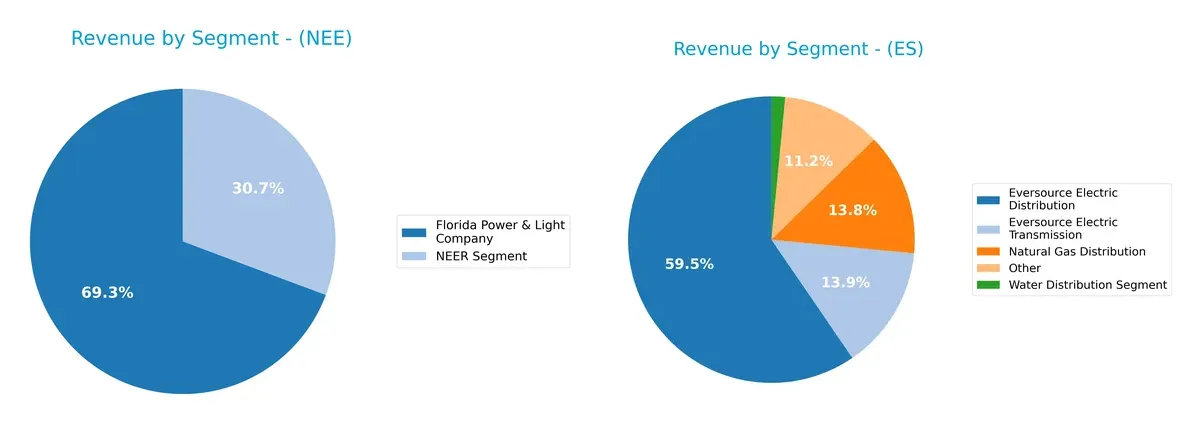
NextEra Energy anchors its revenue in the Florida Power & Light Company segment with $17B, dwarfing its NextEra Energy Resources at $7.5B. This signals a strong infrastructure dominance in power generation and distribution. Eversource Energy, by contrast, shows a more diversified mix: $9.1B from Electric Distribution, $2.1B from Transmission, and $2.1B from Natural Gas Distribution. Eversource’s balanced segmentation reduces concentration risk, while NextEra leans on ecosystem lock-in through its core utility asset.
Strengths and Weaknesses Comparison
This table compares the Strengths and Weaknesses of NextEra Energy, Inc. (NEE) and Eversource Energy (ES):
NEE Strengths
- Higher net margin at 28.06%
- Favorable WACC at 6.4%
- Strong dividend yield of 2.87%
- Diversified segments including Florida Power & Light and NextEra Energy Resources
ES Strengths
- Favorable WACC at 5.05%
- Favorable price-to-book ratio of 1.37
- Higher dividend yield at 4.91%
- Diversified revenue streams across electric, gas, water, and other segments
NEE Weaknesses
- ROIC below WACC at 4.04%
- Low current and quick ratios indicate liquidity concerns
- High debt-to-equity ratio at 1.64
- Low asset and fixed asset turnover
- Interest coverage barely above 1.99
ES Weaknesses
- ROE and ROIC both unfavorable at 5.4% and 3.18%
- Elevated debt-to-equity ratio at 1.94
- Unfavorable PE ratio at 25.29
- Low current and quick ratios
- Asset turnover remains weak
NextEra Energy’s strengths lie in profitability and dividend yield, though liquidity and capital efficiency raise concerns. Eversource shows diversified revenues and attractive dividend yield but struggles with profitability and leverage metrics. Both companies must manage debt and operational efficiency carefully to sustain growth.
The Moat Duel: Analyzing Competitive Defensibility
A structural moat shields long-term profits from competitive erosion. Without it, gains quickly disappear in a saturated market:
NextEra Energy, Inc.: Scale and Renewable Integration Moat
NextEra leverages scale and renewable assets, driving high margins and 25% net margin in 2025. Yet, declining ROIC warns of eroding capital efficiency by 2026.
Eversource Energy: Regulated Utility Stability Moat
Eversource’s regulated electric and water utilities yield stable cash flow and modest margins, contrasting NextEra’s growth. Its shrinking ROIC signals challenges sustaining value amid regulatory pressures.
Scale Leadership vs. Regulatory Stability in Utilities
Both firms face declining ROIC, signaling weakening moats. NextEra’s scale and innovation offer a wider moat but face capital efficiency risks. Eversource’s moat is narrower and under pressure. NextEra is better positioned to defend market share with growth potential despite value erosion.
Which stock offers better returns?
Over the past 12 months, NextEra Energy and Eversource Energy both gained ground, with differing momentum and recent trading dynamics signaling shifts in their trajectories.
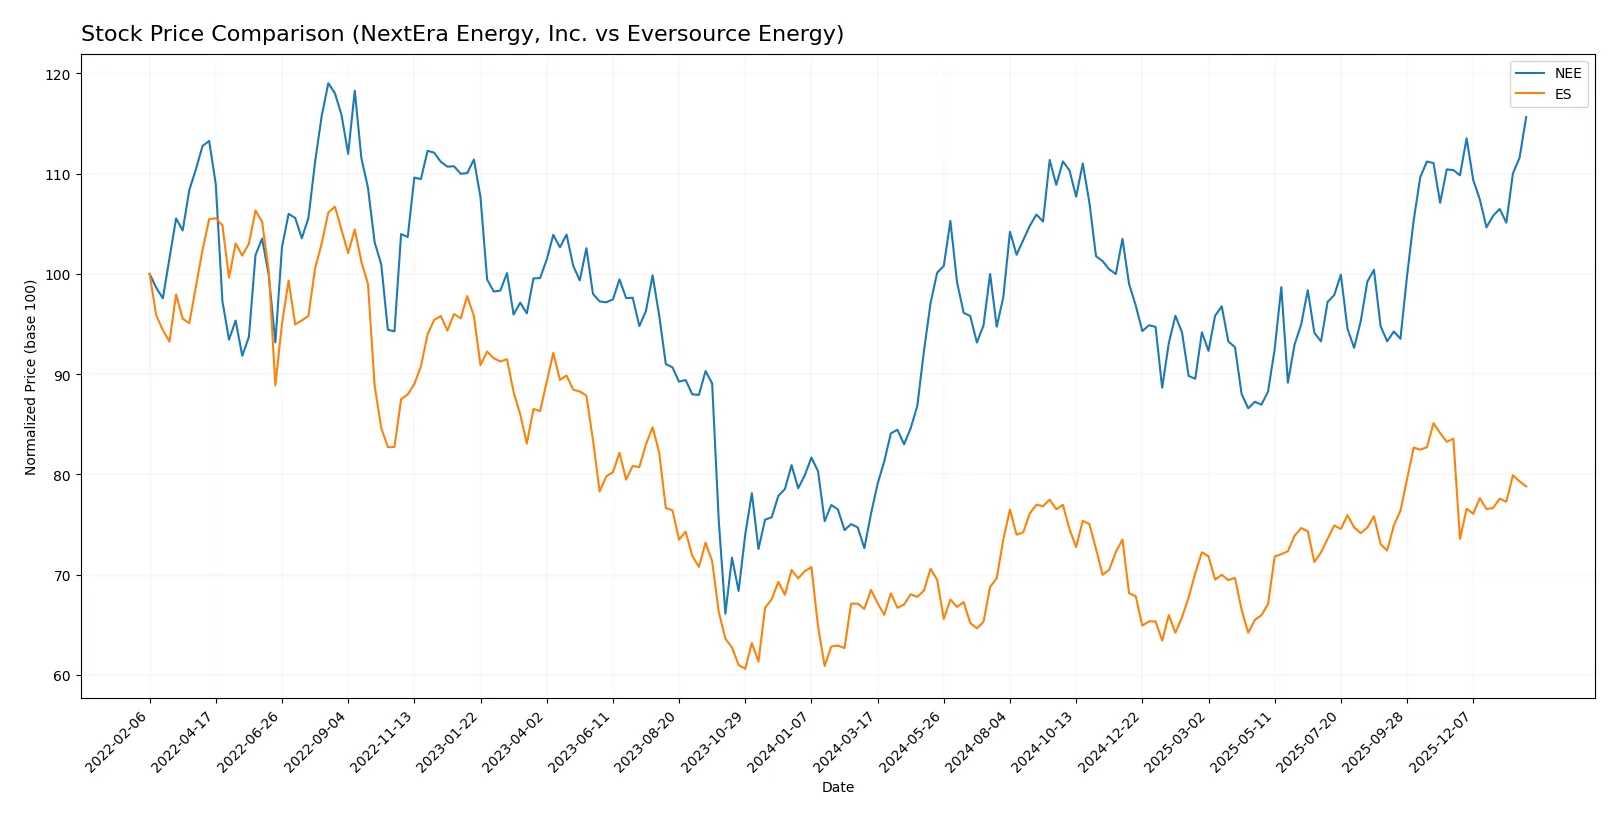
Trend Comparison
NextEra Energy’s stock rose 52.05% over the past year, marking a strong bullish trend with decelerating momentum. It hit a high of 87.9 and a low of 57.81, showing solid but slowing growth.
Eversource Energy gained 15.06% over the same period, also bullish but with deceleration. Its price ranged between 55.63 and 74.67, reflecting moderate upward movement and less volatility than NextEra.
NextEra Energy substantially outperformed Eversource Energy, delivering the highest market return by a wide margin over the past 12 months.
Target Prices
Analysts present a balanced target price consensus for these regulated electric utilities.
| Company | Target Low | Target High | Consensus |
|---|---|---|---|
| NextEra Energy, Inc. | 84 | 104 | 93.09 |
| Eversource Energy | 60 | 81 | 69.6 |
NextEra Energy’s consensus target exceeds its current price of 87.9, implying moderate upside. Eversource Energy’s consensus aligns closely with its current 69.13 price, reflecting tempered growth expectations.

Don’t Let Luck Decide Your Entry Point
Optimize your entry points with our advanced ProRealTime indicators. You’ll get efficient buy signals with precise price targets for maximum performance. Start outperforming now!
How do institutions grade them?
The following tables summarize the latest institutional grades for NextEra Energy, Inc. and Eversource Energy:
NextEra Energy, Inc. Grades
This table presents recent grade actions from major financial institutions on NextEra Energy shares.
| Grading Company | Action | New Grade | Date |
|---|---|---|---|
| Mizuho | Maintain | Neutral | 2026-01-28 |
| Argus Research | Maintain | Buy | 2026-01-28 |
| BMO Capital | Maintain | Outperform | 2026-01-27 |
| Wells Fargo | Maintain | Overweight | 2026-01-20 |
| Barclays | Maintain | Equal Weight | 2026-01-15 |
| Jefferies | Maintain | Hold | 2025-12-31 |
| UBS | Maintain | Buy | 2025-12-17 |
| JP Morgan | Maintain | Overweight | 2025-12-11 |
| BMO Capital | Maintain | Outperform | 2025-12-10 |
| UBS | Maintain | Buy | 2025-12-10 |
Eversource Energy Grades
This table outlines recent institutional grading changes for Eversource Energy shares.
| Grading Company | Action | New Grade | Date |
|---|---|---|---|
| UBS | Maintain | Neutral | 2025-12-17 |
| JP Morgan | Maintain | Underweight | 2025-12-12 |
| Janney Montgomery Scott | Upgrade | Buy | 2025-11-24 |
| Scotiabank | Maintain | Sector Underperform | 2025-11-20 |
| Mizuho | Downgrade | Neutral | 2025-11-20 |
| Wells Fargo | Downgrade | Equal Weight | 2025-11-20 |
| BMO Capital | Maintain | Market Perform | 2025-11-06 |
| Scotiabank | Maintain | Sector Underperform | 2025-11-06 |
| UBS | Downgrade | Neutral | 2025-11-06 |
| Mizuho | Maintain | Outperform | 2025-10-27 |
Which company has the best grades?
NextEra Energy consistently holds buy and outperform ratings from top-tier firms, signaling strong institutional confidence. Eversource Energy shows a mixed grade profile with several downgrades and sector underperform calls, indicating greater caution among analysts. Investors may perceive NextEra’s superior grades as reflecting more robust market sentiment.
Risks specific to each company
The following categories identify critical pressure points and systemic threats facing NextEra Energy, Inc. and Eversource Energy in the 2026 market environment:
1. Market & Competition
NextEra Energy, Inc.
- Dominates with 28.6GW capacity and 11M customers, but faces aggressive clean energy rivals.
Eversource Energy
- Regional focus in NE US limits scale but benefits from stable regulated markets.
2. Capital Structure & Debt
NextEra Energy, Inc.
- Debt/equity at 1.64 signals leveraged balance sheet; interest coverage weak at 1.99x.
Eversource Energy
- Higher leverage with debt/equity 1.94 and moderate interest coverage at 2.12x.
3. Stock Volatility
NextEra Energy, Inc.
- Beta of 0.73 suggests lower volatility than the market; stable trading range.
Eversource Energy
- Slightly higher beta at 0.77 indicates marginally greater sensitivity to market swings.
4. Regulatory & Legal
NextEra Energy, Inc.
- Faces regulatory scrutiny on nuclear and fossil assets amid clean energy transition.
Eversource Energy
- Exposure to multi-state regulatory regimes increases compliance complexity and risk.
5. Supply Chain & Operations
NextEra Energy, Inc.
- Operates extensive transmission and renewable projects but asset turnover is low.
Eversource Energy
- Asset turnover better but constrained by smaller scale and regional infrastructure.
6. ESG & Climate Transition
NextEra Energy, Inc.
- Strong focus on renewables and battery storage; ESG profile improving.
Eversource Energy
- Moderate ESG progress but slower transition pace; natural gas exposure remains.
7. Geopolitical Exposure
NextEra Energy, Inc.
- Primarily US-focused, limiting geopolitical risk but exposed to federal policy shifts.
Eversource Energy
- Regional US operations reduce geopolitical risk but increases vulnerability to local policy changes.
Which company shows a better risk-adjusted profile?
NextEra’s largest risk is its stretched capital structure and weak liquidity, placing it in the Altman distress zone despite strong market position. Eversource bears higher leverage and regulatory complexity, also in distress zone but with a slightly worse Altman score. Both companies have average Piotroski scores, indicating moderate financial health. NextEra’s broader scale and renewable focus offer a better risk-adjusted profile, though its low interest coverage demands caution. The rising debt levels and weak liquidity metrics in both firms warn investors to monitor capital management closely.
Final Verdict: Which stock to choose?
NextEra Energy, Inc. (NEE) stands out for its robust cash generation and impressive net margins, making it a powerhouse of operational efficiency. However, its declining return on invested capital and stretched liquidity ratios warrant close monitoring. NEE aligns well with portfolios seeking aggressive growth exposure in the energy sector.
Eversource Energy (ES) offers a strategic moat through its stable utility footprint and attractive dividend yield, appealing to income-focused investors. Compared to NEE, ES presents a somewhat safer profile, albeit with lower profitability and weaker capital efficiency. It suits investors favoring growth at a reasonable price with moderate risk tolerance.
If you prioritize high operational efficiency and growth potential, NextEra Energy outshines as the compelling choice despite its valuation premium and capital deployment challenges. However, if you seek better stability and income with a solid utility moat, Eversource Energy offers superior safety and dividend appeal, albeit at the cost of slower growth. Both carry risks tied to capital efficiency and leverage, demanding careful risk management.
Disclaimer: Investment carries a risk of loss of initial capital. The past performance is not a reliable indicator of future results. Be sure to understand risks before making an investment decision.
Go Further
I encourage you to read the complete analyses of NextEra Energy, Inc. and Eversource Energy to enhance your investment decisions: