In the evolving utilities sector, FirstEnergy Corp. and Eversource Energy stand out as key players shaping the future of regulated electric services. Both companies operate extensive transmission and distribution networks across the U.S. Northeast and Mid-Atlantic regions, with strong commitments to integrating renewable energy sources. This article will analyze their market positions and innovation strategies to help you identify which stock might be the smarter addition to your investment portfolio.
Table of contents
Companies Overview
I will begin the comparison between FirstEnergy Corp. and Eversource Energy by providing an overview of these two companies and their main differences.
FirstEnergy Corp. Overview
FirstEnergy Corp. operates as a regulated electric utility company in the U.S., generating, transmitting, and distributing electricity. It manages a diverse portfolio of coal, nuclear, hydroelectric, natural gas, wind, and solar facilities. The company serves about 6M customers across six states including Ohio and Pennsylvania, operating extensive transmission and distribution networks. Headquartered in Akron, Ohio, FirstEnergy employs over 12K people.
Eversource Energy Overview
Eversource Energy is a public utility holding company focused on energy delivery, including electric and natural gas distribution, as well as water utilities. It serves residential, commercial, and municipal customers in Connecticut, Massachusetts, and New Hampshire. The company operates solar power facilities and regulated water utilities managing services for roughly 226K customers. Based in Springfield, Massachusetts, Eversource employs around 10K workers.
Key similarities and differences
Both companies operate in the regulated electric utility sector with significant electric transmission and distribution operations. FirstEnergy has a broader geographic footprint and a larger customer base with a diversified energy generation mix including nuclear and coal. Eversource combines electric and natural gas distribution with water services, focusing on three northeastern states. Both maintain regulated business models but differ in scale and service offerings.
Income Statement Comparison
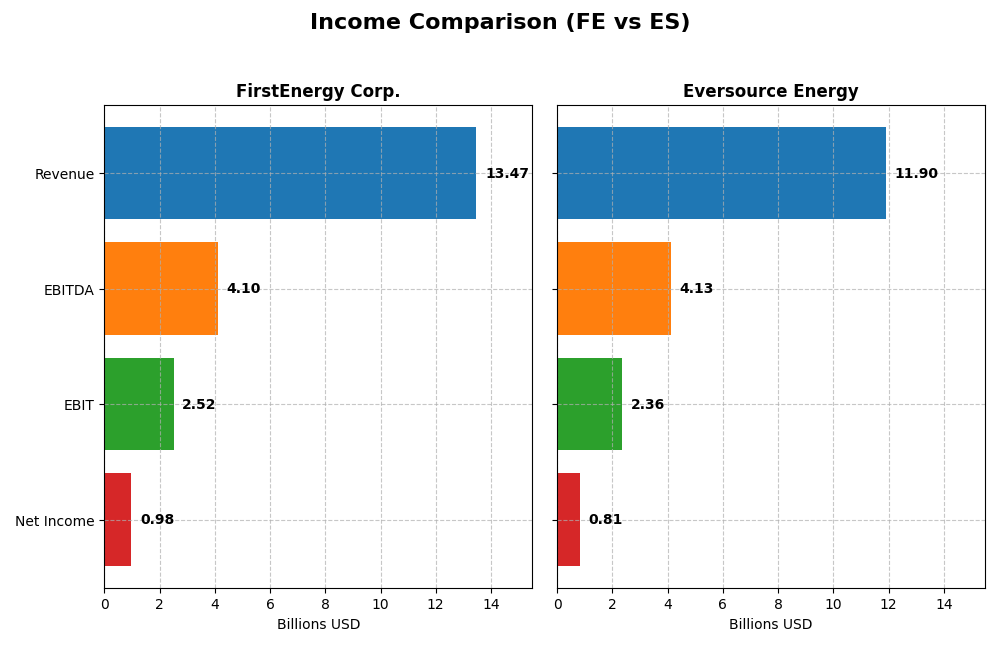
The table below presents a side-by-side comparison of the most recent fiscal year income statement figures for FirstEnergy Corp. and Eversource Energy, highlighting key financial metrics.
| Metric | FirstEnergy Corp. (FE) | Eversource Energy (ES) |
|---|---|---|
| Market Cap | 25.8B | 25.0B |
| Revenue | 13.47B | 11.90B |
| EBITDA | 4.10B | 4.13B |
| EBIT | 2.52B | 2.36B |
| Net Income | 978M | 812M |
| EPS | 1.70 | 2.27 |
| Fiscal Year | 2024 | 2024 |
Income Statement Interpretations
FirstEnergy Corp.
FirstEnergy Corp. showed a steady revenue increase of nearly 25% from 2020 to 2024, reaching $13.47B in 2024. However, net income declined by over 9% in the same period, with a 2024 net margin of 7.26%, down 27.4% overall. The latest year saw marginal revenue growth of 4.68% but decreases in net margin and EPS, indicating margin pressures despite top-line improvement.
Eversource Energy
Eversource Energy’s revenue grew 33.65% over five years but declined slightly by 0.08% in 2024 to $11.9B. The company’s net income dropped over 32% overall, with a net margin of 6.82% in 2024. However, Eversource posted strong EBIT and EPS growth in 2024, up over 278%, signaling operational improvement despite recent revenue stagnation and longer-term margin contraction.
Which one has the stronger fundamentals?
Eversource Energy exhibits a more favorable income statement profile, with 57.14% of key metrics rated positively, including recent EBIT and EPS growth, despite persistent net income declines overall. FirstEnergy shows solid revenue growth but suffers from deteriorating margins and a lower proportion of favorable metrics (35.71%). Thus, Eversource’s earnings recovery and margin stability suggest comparatively stronger fundamentals.
Financial Ratios Comparison
The table below presents a side-by-side comparison of key financial ratios for FirstEnergy Corp. (FE) and Eversource Energy (ES) based on their most recent fiscal year data (2024).
| Ratios | FirstEnergy Corp. (FE) | Eversource Energy (ES) |
|---|---|---|
| ROE | 7.85% | 5.40% |
| ROIC | 3.66% | 3.18% |
| P/E | 23.39 | 25.29 |
| P/B | 1.84 | 1.37 |
| Current Ratio | 0.56 | 0.76 |
| Quick Ratio | 0.45 | 0.67 |
| D/E (Debt-to-Equity) | 1.95 | 1.94 |
| Debt-to-Assets | 46.63% | 48.85% |
| Interest Coverage | 2.35 | 2.43 |
| Asset Turnover | 0.26 | 0.20 |
| Fixed Asset Turnover | 0.33 | 0.29 |
| Payout ratio | 99.18% | 124.32% |
| Dividend yield | 4.24% | 4.91% |
Interpretation of the Ratios
FirstEnergy Corp.
FirstEnergy’s ratios reveal several weaknesses, including unfavorable returns on equity (7.85%) and invested capital (3.66%), a low current ratio (0.56), and weak asset turnover metrics. The company maintains a relatively favorable weighted average cost of capital (WACC) and dividend yield (4.24%). Its dividend payments appear supported but warrant caution due to the overall slightly unfavorable ratio profile.
Eversource Energy
Eversource exhibits mixed ratios with unfavorable returns on equity (5.4%) and invested capital (3.18%), alongside a higher WACC (5.01%) and price-to-earnings ratio (25.29). The current and quick ratios remain below 1, signaling liquidity concerns. The dividend yield is favorable at 4.91%, though overall ratio assessments suggest an unfavorable financial position.
Which one has the best ratios?
Comparing the two, FirstEnergy shows a slightly unfavorable overall ratio profile, while Eversource’s evaluation is marked as unfavorable with a higher proportion of negative metrics. Both companies face liquidity and efficiency challenges, but FirstEnergy’s stronger dividend yield and WACC provide a marginally better ratios outlook.
Strategic Positioning
This section compares the strategic positioning of FirstEnergy Corp. and Eversource Energy, focusing on market position, key segments, and exposure to disruption:
FirstEnergy Corp.
- Large regulated electric utility with moderate competitive pressure in multiple states.
- Primarily generates revenue from regulated distribution and transmission segments.
- Owns various power generation facilities including coal, nuclear, hydro, gas, wind, solar.
Eversource Energy
- Regulated electric utility with moderate competition in Northeast US markets.
- Diverse segments including electric distribution, transmission, natural gas, and water.
- Involved in solar power and multiple utility distribution services.
FirstEnergy Corp. vs Eversource Energy Positioning
FirstEnergy focuses heavily on regulated electric distribution and transmission across several states, with some generation diversity. Eversource operates a more diversified portfolio including natural gas and water distribution, broadening its business drivers but within a regional footprint.
Which has the best competitive advantage?
Both companies show declining ROIC below WACC from 2020 to 2024, indicating value destruction and decreasing profitability. Neither currently demonstrates a strong economic moat or sustainable competitive advantage based on this evaluation.
Stock Comparison
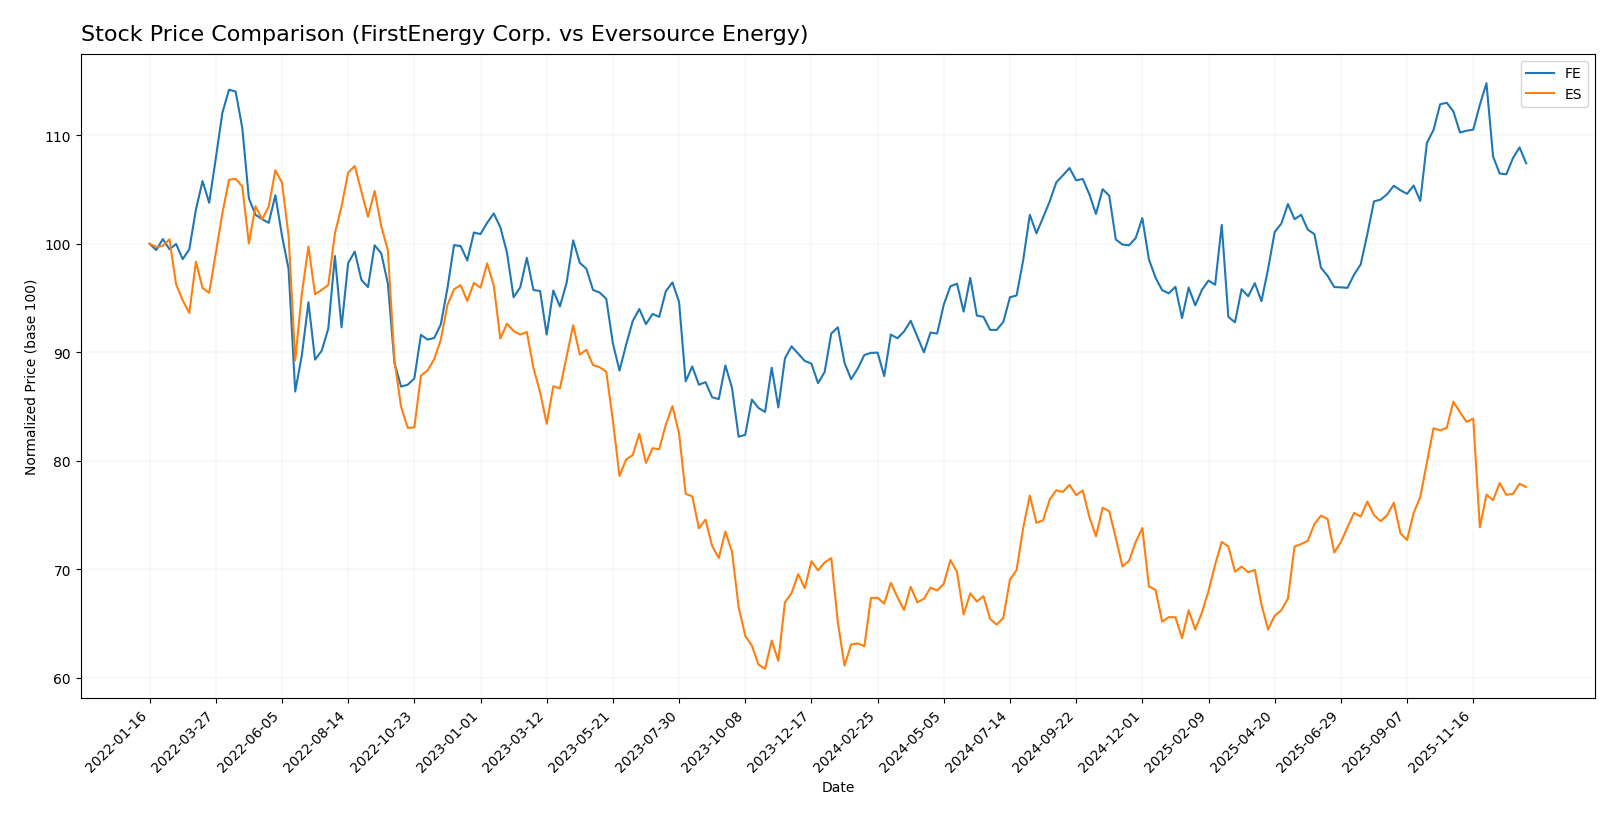
The stock price movements over the past year reveal bullish trends for both FirstEnergy Corp. and Eversource Energy, with notable deceleration and recent bearish corrections affecting trading dynamics.
Trend Analysis
FirstEnergy Corp. recorded a 19.42% price increase over the past 12 months, indicating a bullish trend with decelerating momentum. The stock ranged between $36.5 and $47.72, showing moderate volatility with a 2.64 standard deviation.
Eversource Energy posted a 15.15% gain in the same period, also reflecting a bullish trend with deceleration. Its price fluctuated between $55.63 and $74.67 and demonstrated higher volatility, with a 4.5 standard deviation.
Comparing the two, FirstEnergy Corp. delivered a higher market performance over the past year, despite both stocks experiencing recent downward corrections.
Target Prices
The current analyst consensus indicates moderate upside potential for both FirstEnergy Corp. and Eversource Energy.
| Company | Target High | Target Low | Consensus |
|---|---|---|---|
| FirstEnergy Corp. | 54 | 46 | 49.29 |
| Eversource Energy | 81 | 60 | 68 |
Analysts expect FirstEnergy’s price to rise from 44.65 to near 49.29 on average, while Eversource shows a target consensus well above its current price of 67.79, suggesting positive market sentiment.
Analyst Opinions Comparison
This section compares analysts’ ratings and grades for FirstEnergy Corp. and Eversource Energy:
Rating Comparison
FirstEnergy Corp. Rating
- Rating: B, indicating a very favorable overall evaluation.
- Discounted Cash Flow Score: 4, favorable assessment.
- ROE Score: 4, favorable, showing efficient profit generation.
- ROA Score: 3, moderate asset utilization effectiveness.
- Debt To Equity Score: 1, very unfavorable, indicating high debt risk.
- Overall Score: 3, moderate overall financial standing.
Eversource Energy Rating
- Rating: C+, also indicating a very favorable overall evaluation.
- Discounted Cash Flow Score: 1, very unfavorable assessment.
- ROE Score: 3, moderate efficiency in generating profit.
- ROA Score: 3, moderate asset utilization effectiveness.
- Debt To Equity Score: 1, very unfavorable, indicating high debt risk.
- Overall Score: 2, moderate overall financial standing.
Which one is the best rated?
Based strictly on the provided data, FirstEnergy Corp. holds a higher overall rating (B vs. C+) and better scores in discounted cash flow and return on equity. Both companies share very unfavorable debt-to-equity scores, but FirstEnergy’s stronger cash flow and equity returns give it a better rating overall.
Scores Comparison
Here is a comparison of the Altman Z-Score and Piotroski Score for FirstEnergy Corp. and Eversource Energy:
FE Scores
- Altman Z-Score: 0.78, indicating financial distress zone.
- Piotroski Score: 6, reflecting average financial strength.
ES Scores
- Altman Z-Score: 0.75, indicating financial distress zone.
- Piotroski Score: 6, reflecting average financial strength.
Which company has the best scores?
Both FirstEnergy Corp. and Eversource Energy have Altman Z-Scores in the distress zone and identical Piotroski Scores of 6, indicating similar financial risk and average strength based on the provided data.
Grades Comparison
Here is a comparison of recent reliable grades from recognized grading companies for the two companies:
FirstEnergy Corp. Grades
This table presents recent grades assigned by professional grading firms for FirstEnergy Corp.
| Grading Company | Action | New Grade | Date |
|---|---|---|---|
| UBS | Maintain | Neutral | 2025-12-17 |
| Mizuho | Maintain | Neutral | 2025-10-24 |
| Scotiabank | Maintain | Sector Outperform | 2025-10-24 |
| UBS | Maintain | Neutral | 2025-10-24 |
| Morgan Stanley | Maintain | Overweight | 2025-10-21 |
| Jefferies | Maintain | Hold | 2025-10-21 |
| Keybanc | Downgrade | Sector Weight | 2025-10-15 |
| Scotiabank | Maintain | Sector Outperform | 2025-10-06 |
| Morgan Stanley | Maintain | Overweight | 2025-09-25 |
| Barclays | Upgrade | Overweight | 2025-08-25 |
Overall, FirstEnergy Corp. shows a stable grade profile with mostly neutral to overweight ratings, and some recent upgrades indicating moderate positive sentiment.
Eversource Energy Grades
This table presents recent grades assigned by professional grading firms for Eversource Energy.
| Grading Company | Action | New Grade | Date |
|---|---|---|---|
| UBS | Maintain | Neutral | 2025-12-17 |
| JP Morgan | Maintain | Underweight | 2025-12-12 |
| Janney Montgomery Scott | Upgrade | Buy | 2025-11-24 |
| Scotiabank | Maintain | Sector Underperform | 2025-11-20 |
| Mizuho | Downgrade | Neutral | 2025-11-20 |
| Wells Fargo | Downgrade | Equal Weight | 2025-11-20 |
| UBS | Downgrade | Neutral | 2025-11-06 |
| BMO Capital | Maintain | Market Perform | 2025-11-06 |
| Scotiabank | Maintain | Sector Underperform | 2025-11-06 |
| Mizuho | Maintain | Outperform | 2025-10-27 |
Eversource Energy’s grades reflect a mixed to cautious stance, with multiple downgrades and underweight ratings alongside some buy and outperform notes.
Which company has the best grades?
FirstEnergy Corp. has received generally more favorable and stable grades, with several overweight and sector outperform ratings, compared to Eversource Energy’s mixed grades and multiple downgrades. This difference may influence investors’ perception of relative risk and growth potential.
Strengths and Weaknesses
Below is a comparative table highlighting the key strengths and weaknesses of FirstEnergy Corp. (FE) and Eversource Energy (ES) based on their recent financial and operational data.
| Criterion | FirstEnergy Corp. (FE) | Eversource Energy (ES) |
|---|---|---|
| Diversification | Moderate: Primarily regulated distribution and transmission with limited diversification beyond core segments. | Strong: Diverse revenue streams including electric distribution, transmission, natural gas, water, and other segments. |
| Profitability | Weak: ROIC 3.66% below WACC (4.85%), indicating value destruction; declining profitability trend. | Weak: ROIC 3.18% below WACC (5.01%), also shedding value with declining ROIC. |
| Innovation | Limited data on innovation initiatives; traditional utility with competitive energy services segment. | Moderate: Broader service offerings suggest some innovation in utility services and diversification. |
| Global presence | Primarily U.S.-focused with regulated markets; limited international exposure. | U.S.-centric with focus on northeastern states; no significant global footprint. |
| Market Share | Solid in regulated distribution and transmission markets; steady but declining revenues in competitive energy services. | Strong in electric and natural gas distribution in its operating regions; consistent revenue growth in key segments. |
Key takeaways: Both FE and ES face challenges with declining profitability and value destruction, reflected in their negative ROIC vs. WACC spread. ES shows better diversification and slightly stronger market positioning, but both companies exhibit risks that warrant cautious investment consideration.
Risk Analysis
Below is a comparative table highlighting key risks for FirstEnergy Corp. (FE) and Eversource Energy (ES) based on 2024 data:
| Metric | FirstEnergy Corp. (FE) | Eversource Energy (ES) |
|---|---|---|
| Market Risk | Beta 0.63 (low volatility) | Beta 0.77 (moderate volatility) |
| Debt level | Debt/Equity 1.95 (high) | Debt/Equity 1.94 (high) |
| Regulatory Risk | Moderate, utility sector focus | Moderate, regulated utilities |
| Operational Risk | Aging coal & nuclear assets | Diverse energy mix, natural gas |
| Environmental Risk | Exposure to fossil fuels | Increasing renewables exposure |
| Geopolitical Risk | US regional focus, low | US regional focus, low |
Both companies face significant debt levels, with debt-to-equity ratios near 2, indicating financial leverage risk. Market risk remains moderate given their low to moderate beta values. Environmental risk is more pronounced for FirstEnergy due to reliance on coal and nuclear, while Eversource is shifting toward renewables. Operational risks stem from asset age and energy mix complexity. Regulatory and geopolitical risks are moderate and mainly tied to US regional utility regulations. The debt burden and environmental transition challenges are the most impactful risks to monitor.
Which Stock to Choose?
FirstEnergy Corp. (FE) shows a mixed income evolution with revenue growth but declining net margin and EPS over 2020-2024. Its financial ratios are mostly unfavorable, marked by a low current ratio and high debt-to-equity, though dividend yield and WACC are favorable. Profitability is modest with ROE at 7.85%, and the company carries significant debt. Its rating is very favorable (B), but the global ratio evaluation remains slightly unfavorable.
Eversource Energy (ES) features favorable income statement growth in recent years despite long-term net income decline. Financial ratios reveal a higher debt load and unfavorable P/E ratio but a stronger dividend yield and lower price-to-book ratio. Profitability is lower than FE, with ROE at 5.4%. Debt levels are high, and the company’s rating is very favorable (C+), yet overall financial ratios are considered unfavorable.
Given both companies’ very unfavorable MOAT evaluations and distress-zone Altman Z-Scores, FE’s slightly unfavorable financial ratios and more favorable income statement growth might appeal to growth-oriented investors. Conversely, ES’s stronger dividend yield and valuation metrics could be more attractive to risk-tolerant income-focused investors. The choice might depend on whether an investor prioritizes income growth or dividend income within a context of notable financial risk.
Disclaimer: Investment carries a risk of loss of initial capital. The past performance is not a reliable indicator of future results. Be sure to understand risks before making an investment decision.
Go Further
I encourage you to read the complete analyses of FirstEnergy Corp. and Eversource Energy to enhance your investment decisions: