Exelon Corporation (EXC) and Eversource Energy (ES) are two prominent players in the regulated electric utilities sector, both serving millions of customers across the United States with a focus on clean energy and reliable delivery. While Exelon boasts a diverse generation portfolio including nuclear and renewables, Eversource emphasizes electric and natural gas distribution alongside water services. This article will explore their strategies and financials to identify which company presents a more compelling investment opportunity for you.
Table of contents
Companies Overview
I will begin the comparison between Exelon Corporation and Eversource Energy by providing an overview of these two companies and their main differences.
Exelon Corporation Overview
Exelon Corporation is a utility services holding company operating in the United States and Canada. It focuses on energy generation, delivery, and marketing, owning diverse facilities including nuclear, fossil, wind, hydroelectric, biomass, and solar. Exelon also sells electricity, natural gas, and renewable energy products, serving a wide range of customers from municipalities to residential users. The company is headquartered in Chicago and employs around 20,000 people.
Eversource Energy Overview
Eversource Energy is a public utility holding company primarily engaged in energy delivery across Connecticut, Massachusetts, and New Hampshire. Its operations include electric distribution, transmission, natural gas distribution, and water services to roughly 226,000 customers. Eversource serves residential, commercial, industrial, and municipal clients. Based in Springfield, Massachusetts, it employs about 10,000 full-time workers and focuses on regulated utility services.
Key similarities and differences
Both companies operate in the regulated electric utility sector, emphasizing energy transmission and distribution alongside natural gas services. Exelon has a broader energy generation portfolio including nuclear and renewable sources, while Eversource focuses more on delivery and distribution, including regulated water utilities. Exelon’s scale is larger with around 20,000 employees and a market cap near 44B USD, compared to Eversource’s 25B USD market cap and 10,000 employees.
Income Statement Comparison
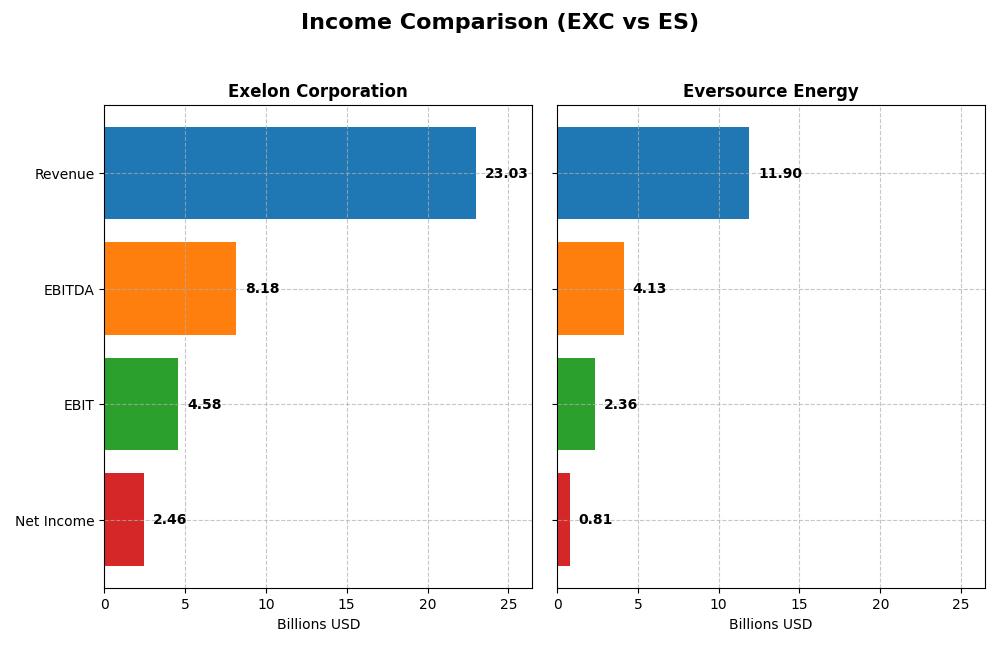
The following table compares key financial metrics from the most recent fiscal year for Exelon Corporation and Eversource Energy, highlighting their income statement figures side by side.
| Metric | Exelon Corporation (EXC) | Eversource Energy (ES) |
|---|---|---|
| Market Cap | 44B | 25B |
| Revenue | 23.03B | 11.90B |
| EBITDA | 8.18B | 4.13B |
| EBIT | 4.58B | 2.36B |
| Net Income | 2.46B | 812M |
| EPS | 2.45 | 2.27 |
| Fiscal Year | 2024 | 2024 |
Income Statement Interpretations
Exelon Corporation
Exelon’s revenue rose steadily from $17.9B in 2021 to $23B in 2024, while net income increased from $1.7B to $2.46B. Margins remained robust, with a favorable gross margin near 40.8% and a net margin of 10.7%. The 2024 results showed moderate revenue and gross profit growth but a slight net margin decline, balanced by a 4.7% EPS increase.
Eversource Energy
Eversource’s revenue grew to $11.9B in 2024 from $9.9B in 2021, though net income declined from $1.22B to $812M. Margins were stable but lower than Exelon’s, with a 31.1% gross and 6.8% net margin. Despite a 2024 revenue drop and gross profit contraction, EBIT and net margin improved substantially, reflecting operational efficiency gains.
Which one has the stronger fundamentals?
Exelon demonstrates stronger fundamentals overall, with sustained revenue and net income growth and superior margins. Its consistent profitability and margin expansion outweigh Eversource’s mixed performance, which combines revenue growth with declining net income and margin contractions over the period. Both companies maintain favorable income statement evaluations, but Exelon shows more stable financial health.
Financial Ratios Comparison
The following table presents the most recent fiscal year (2024) financial ratios for Exelon Corporation and Eversource Energy, providing a clear side-by-side comparison of key performance and financial stability metrics.
| Ratios | Exelon Corporation (EXC) | Eversource Energy (ES) |
|---|---|---|
| ROE | 9.14% | 5.40% |
| ROIC | 3.93% | 3.18% |
| P/E | 15.35 | 25.29 |
| P/B | 1.40 | 1.37 |
| Current Ratio | 0.87 | 0.76 |
| Quick Ratio | 0.78 | 0.67 |
| D/E (Debt to Equity) | 1.73 | 1.94 |
| Debt-to-Assets | 43.3% | 48.9% |
| Interest Coverage | 2.26 | 2.43 |
| Asset Turnover | 0.21 | 0.20 |
| Fixed Asset Turnover | 0.29 | 0.29 |
| Payout Ratio | 61.95% | 124.32% |
| Dividend Yield | 4.04% | 4.91% |
Interpretation of the Ratios
Exelon Corporation
Exelon shows a mixed ratio profile with strong net margin (10.68%) and favorable dividend yield (4.04%), but weak returns on equity (9.14%) and invested capital (3.93%). High debt levels (D/E 1.73) and low liquidity ratios (current 0.87, quick 0.78) raise concerns. Dividends appear sustainable with moderate payout and stable shareholder returns.
Eversource Energy
Eversource presents weaker profitability ratios, including a lower net margin (6.82%) and ROE of 5.4%, alongside an unfavorable P/E ratio (25.29). Debt remains high (D/E 1.94) with low liquidity ratios (current 0.76, quick 0.67). Despite this, it offers a higher dividend yield (4.91%), suggesting shareholder returns are prioritized amid mixed operational efficiency.
Which one has the best ratios?
Exelon exhibits a slightly more favorable ratio set, with better profitability and a more balanced dividend yield. Eversource faces more unfavorable ratios, especially in profitability and valuation metrics. Both companies struggle with liquidity and leverage, but Exelon’s strengths in key areas give it a comparative edge in ratio analysis.
Strategic Positioning
This section compares the strategic positioning of Exelon Corporation and Eversource Energy including market position, key segments, and exposure to technological disruption:
Exelon Corporation
- Large-cap utility with $44B market cap, lower beta at 0.56, facing regulated electric industry competition.
- Diverse energy generation including nuclear, fossil, wind, hydro, solar; revenue from multiple utility subsidiaries and energy commodities.
- Exposure includes traditional generation and renewable sources; potential disruption from energy transition and renewables integration.
Eversource Energy
- Mid-cap utility with $25B market cap, beta 0.77, competing in regulated electric sector with regional focus.
- Focused on electric and natural gas distribution plus water utilities, serving Northeast US markets with regulated segments.
- Primarily delivery and distribution, less generation exposure; solar power included, possible disruption from utility-scale renewables.
Exelon Corporation vs Eversource Energy Positioning
Exelon has a diversified portfolio across generation and delivery with multiple subsidiaries, offering wide revenue streams. Eversource concentrates on distribution and regional utilities, emphasizing regulated services. Exelon’s broader scope may increase complexity, while Eversource’s focus limits diversification.
Which has the best competitive advantage?
Both companies are currently shedding value relative to cost of capital. Exelon shows a slightly unfavorable moat with growing ROIC, while Eversource’s moat is very unfavorable with declining ROIC. Exelon demonstrates a more resilient competitive advantage based on recent profitability trends.
Stock Comparison
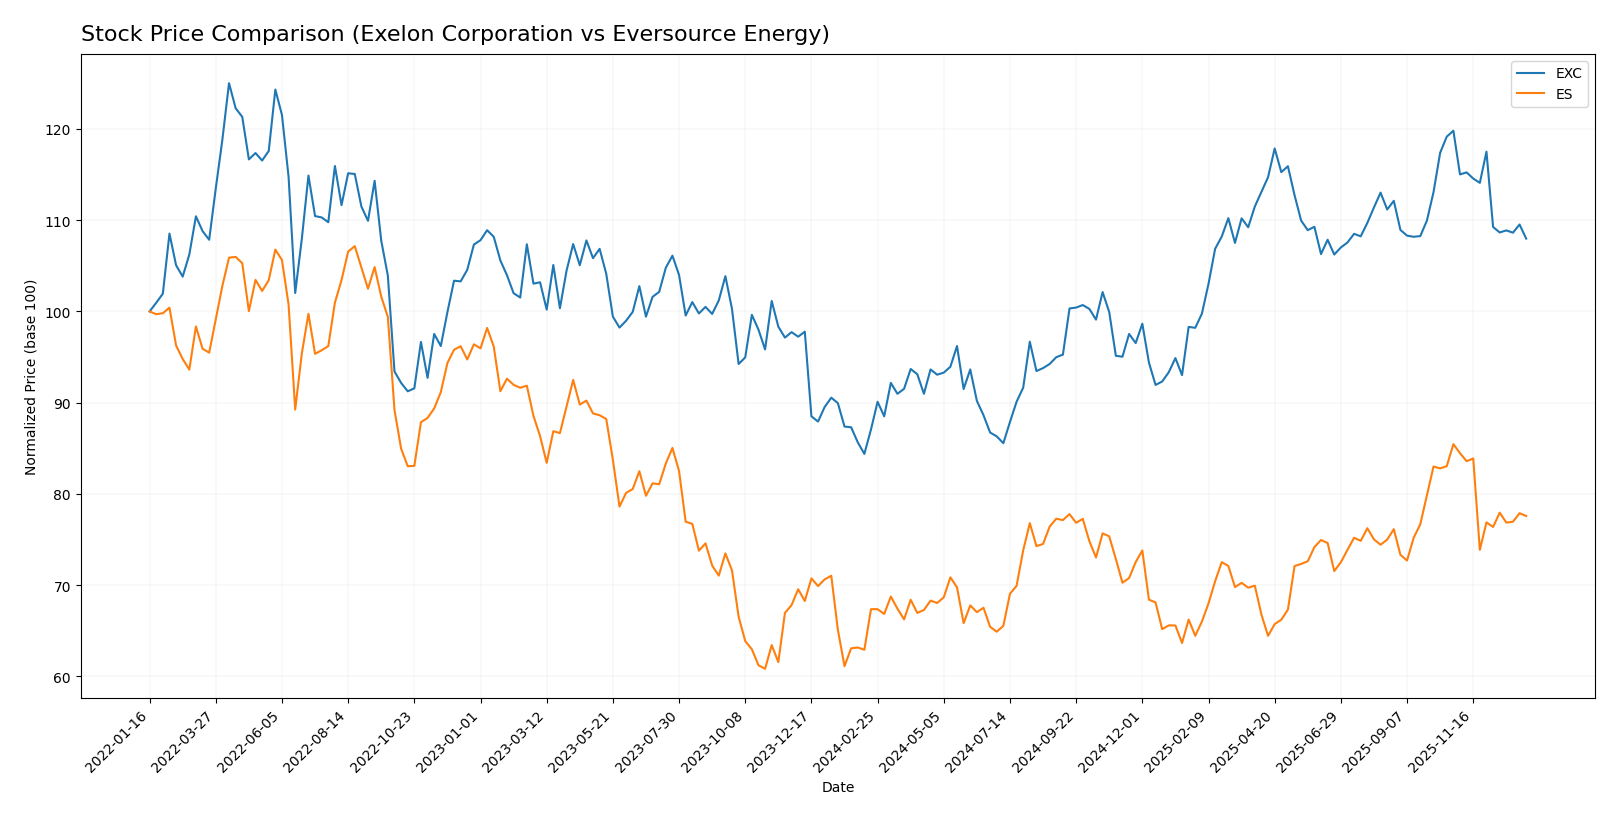
The stock price movements of Exelon Corporation (EXC) and Eversource Energy (ES) over the past year reveal notable bullish trends with recent deceleration phases and downward shifts in buyer dominance.
Trend Analysis
Exelon Corporation’s stock showed a 24.03% increase over the past 12 months, indicating a bullish trend with decelerating momentum. The price ranged from a low of 34.31 to a high of 48.04, with recent weeks showing a -9.87% decline.
Eversource Energy experienced a 15.15% price rise over the same period, also bullish but decelerating. Its price fluctuated between 55.63 and 74.67, with a recent downward trend recording a -9.21% decrease.
Comparing both, Exelon delivered the highest market performance over the past year, outperforming Eversource with a larger overall price increase despite similar recent declines.
Target Prices
The target price consensus for Exelon Corporation and Eversource Energy reflects moderate upside potential according to recent analyst estimates.
| Company | Target High | Target Low | Consensus |
|---|---|---|---|
| Exelon Corporation | 57 | 39 | 50.86 |
| Eversource Energy | 81 | 60 | 68 |
Analysts expect Exelon Corporation’s stock to rise from the current 43.3 USD toward the 50.86 USD consensus, while Eversource Energy is near its 67.79 USD price with upside to 68 USD, indicating cautious optimism.
Analyst Opinions Comparison
This section compares analysts’ ratings and financial scores for Exelon Corporation and Eversource Energy:
Rating Comparison
EXC Rating
- Rating: B, indicating a very favorable status by analysts.
- Discounted Cash Flow Score: 3, a moderate assessment of future cash flow value.
- ROE Score: 3, showing moderate efficiency in generating profit from equity.
- ROA Score: 3, reflecting moderate effectiveness in asset utilization.
- Debt To Equity Score: 2, indicating moderate financial risk.
- Overall Score: 3, a moderate overall financial health rating.
ES Rating
- Rating: C+, also considered very favorable despite the lower letter grade.
- Discounted Cash Flow Score: 1, a very unfavorable view on cash flow valuation.
- ROE Score: 3, equally moderate in profit generation efficiency.
- ROA Score: 3, matching moderate asset utilization effectiveness.
- Debt To Equity Score: 1, signaling very unfavorable financial leverage risk.
- Overall Score: 2, a moderate but lower overall financial health rating.
Which one is the best rated?
Exelon Corporation holds a higher overall rating (B vs. C+) and superior scores in discounted cash flow and debt to equity, indicating a more favorable analyst assessment compared to Eversource Energy.
Scores Comparison
The following table presents a comparison of the Altman Z-Score and Piotroski Score for Exelon Corporation and Eversource Energy:
EXC Scores
- Altman Z-Score: 0.78, indicating financial distress.
- Piotroski Score: 5, reflecting average financial health.
ES Scores
- Altman Z-Score: 0.75, indicating financial distress.
- Piotroski Score: 6, reflecting average financial health.
Which company has the best scores?
Eversource Energy has slightly better scores with a Piotroski Score of 6 versus Exelon’s 5, though both are in the distress zone for Altman Z-Score. This indicates similar financial risk levels but marginally stronger financial health for Eversource.
Grades Comparison
Here is a comparison of the recent grades assigned to Exelon Corporation and Eversource Energy by reputable grading companies:
Exelon Corporation Grades
The following table summarizes recent grades for Exelon Corporation from well-known grading firms:
| Grading Company | Action | New Grade | Date |
|---|---|---|---|
| UBS | Maintain | Neutral | 2025-12-17 |
| JP Morgan | Maintain | Neutral | 2025-12-12 |
| Morgan Stanley | Maintain | Equal Weight | 2025-10-22 |
| Keybanc | Maintain | Underweight | 2025-10-15 |
| Jefferies | Maintain | Buy | 2025-10-15 |
| Barclays | Maintain | Overweight | 2025-10-14 |
| UBS | Maintain | Neutral | 2025-10-10 |
| Morgan Stanley | Maintain | Equal Weight | 2025-09-25 |
| Keybanc | Maintain | Underweight | 2025-07-16 |
| UBS | Maintain | Neutral | 2025-07-11 |
The grades for Exelon show a broad range from Underweight to Buy, with a consensus rating of Hold, indicating mixed but generally neutral sentiment among analysts.
Eversource Energy Grades
Below are recent grades for Eversource Energy from recognized grading companies:
| Grading Company | Action | New Grade | Date |
|---|---|---|---|
| UBS | Maintain | Neutral | 2025-12-17 |
| JP Morgan | Maintain | Underweight | 2025-12-12 |
| Janney Montgomery Scott | Upgrade | Buy | 2025-11-24 |
| Scotiabank | Maintain | Sector Underperform | 2025-11-20 |
| Mizuho | Downgrade | Neutral | 2025-11-20 |
| Wells Fargo | Downgrade | Equal Weight | 2025-11-20 |
| UBS | Downgrade | Neutral | 2025-11-06 |
| BMO Capital | Maintain | Market Perform | 2025-11-06 |
| Scotiabank | Maintain | Sector Underperform | 2025-11-06 |
| Mizuho | Maintain | Outperform | 2025-10-27 |
Eversource’s grades range from Sector Underperform to Buy, with a consensus rating also at Hold, reflecting some volatility and mixed analyst opinions.
Which company has the best grades?
Both companies have a consensus Hold rating, but Exelon shows a more balanced distribution of grades with Buy and Overweight ratings included, while Eversource displays greater variability with several downgrades and Sector Underperform ratings. Investors might interpret Exelon’s steadier grade profile as relatively more stable compared to Eversource’s mixed signals.
Strengths and Weaknesses
The table below summarizes key strengths and weaknesses of Exelon Corporation (EXC) and Eversource Energy (ES) based on their recent financial performance, market presence, and innovation capabilities.
| Criterion | Exelon Corporation (EXC) | Eversource Energy (ES) |
|---|---|---|
| Diversification | Broad utility portfolio with strong regulated electric and gas segments across multiple states | Focused on electric and natural gas distribution with some water services; less diversified geographically |
| Profitability | Moderate net margin (10.7%), ROIC improving but still below WACC, slightly unfavorable overall | Lower net margin (6.8%), declining ROIC below WACC, very unfavorable profitability trend |
| Innovation | Growing ROIC signals improving operational efficiency and potential innovation | Declining ROIC indicates challenges in operational improvements or innovation |
| Global presence | Primarily US-focused but operates across several states with large customer base | Concentrated regional presence in the Northeast US with limited expansion |
| Market Share | Large market share in electric utilities, with strong revenue from Commonwealth Edison and Pepco | Strong regional market share in electric and gas distribution but smaller scale compared to EXC |
Key takeaways: Exelon shows diversification and improving profitability despite current value destruction, making it a cautious buy with growth potential. Eversource faces declining profitability and less diversification, posing higher risk for investors seeking stable returns. Risk management favors Exelon for those prioritizing operational improvement trajectories.
Risk Analysis
Below is a summary table presenting key risks for Exelon Corporation (EXC) and Eversource Energy (ES) based on the most recent 2024 financial data and market context:
| Metric | Exelon Corporation (EXC) | Eversource Energy (ES) |
|---|---|---|
| Market Risk | Moderate (Beta 0.56) | Moderate (Beta 0.77) |
| Debt level | High (D/E 1.73, Neutral) | High (D/E 1.94, Neutral) |
| Regulatory Risk | Elevated (Utility sector) | Elevated (Utility sector) |
| Operational Risk | Moderate (Asset turnover low) | Moderate (Asset turnover low) |
| Environmental Risk | Medium (Nuclear & fossil assets) | Medium (Solar & gas assets) |
| Geopolitical Risk | Low (US/Canada focus) | Low (Northeastern US focus) |
The most likely and impactful risks for both companies are their high debt levels combined with moderate operational inefficiencies, which raise financial vulnerability despite stable market positions. Both operate in the heavily regulated utility sector, exposing them to regulatory shifts. Their Altman Z-Scores indicate financial distress zones, signaling caution for investors. Environmental risks persist due to reliance on traditional energy sources and evolving sustainability standards.
Which Stock to Choose?
Exelon Corporation (EXC) shows a favorable income statement overall, with stable gross and EBIT margins and positive net margin growth over five years. Its financial ratios are slightly unfavorable, reflecting moderate profitability and liquidity concerns, while its debt level and rating remain moderate but stable.
Eversource Energy (ES) also has a favorable income statement but with some volatility, showing a recent rebound in EBIT and net margin growth despite a longer-term decline. Its financial ratios are more unfavorable, especially due to a higher debt burden and valuation concerns, though it holds a very favorable overall rating.
For investors prioritizing stable income and improving profitability, Exelon’s combination of a favorable income statement and better rating might appear more attractive. Conversely, those willing to accept higher risk for potential rebound gains could consider Eversource, given its recent positive income growth but less favorable financial ratios and declining moat.
Disclaimer: Investment carries a risk of loss of initial capital. The past performance is not a reliable indicator of future results. Be sure to understand risks before making an investment decision.
Go Further
I encourage you to read the complete analyses of Exelon Corporation and Eversource Energy to enhance your investment decisions: