Home > Comparison > Utilities > XEL vs EVRG
The strategic rivalry between Xcel Energy Inc. and Evergy, Inc. defines the current trajectory of the regulated electric utilities sector. Xcel operates as a capital-heavy, diversified energy producer with broad geographic reach and multiple generation sources. Evergy, by contrast, focuses on regional electricity transmission and distribution with a leaner operational footprint. This analysis will clarify which company’s business model offers superior risk-adjusted returns for a balanced portfolio amid evolving energy demands.
Table of contents
Companies Overview
Xcel Energy and Evergy dominate the regulated electric utility space in the American Midwest.
Xcel Energy Inc.: Diversified Regulated Utility Powerhouse
Xcel Energy leads with a diversified energy portfolio spanning coal, nuclear, natural gas, hydro, solar, and wind. It generates and sells electricity and natural gas to over 5.8M customers across eight states. In 2026, the company’s strategic focus emphasized expanding renewable generation and enhancing infrastructure to balance sustainability with reliability.
Evergy, Inc.: Regional Electric Utility with Robust Grid
Evergy centers on electricity generation and distribution in Kansas and Missouri. Its core revenue stems from coal, natural gas, nuclear, and renewables powering 1.6M customers. In 2026, Evergy prioritized transmission and distribution network upgrades to support growing renewable integration while maintaining grid resilience.
Strategic Collision: Similarities & Divergences
Both firms operate regulated utilities with a strong push into renewables but differ in scale and geographic reach. Xcel embraces a broader multi-state footprint and diverse fuel mix; Evergy focuses deeply on grid modernization within a two-state region. Their primary market battleground is balancing clean energy investments with reliable service. These differences shape distinct risk profiles and growth trajectories in regulated markets.
Income Statement Comparison
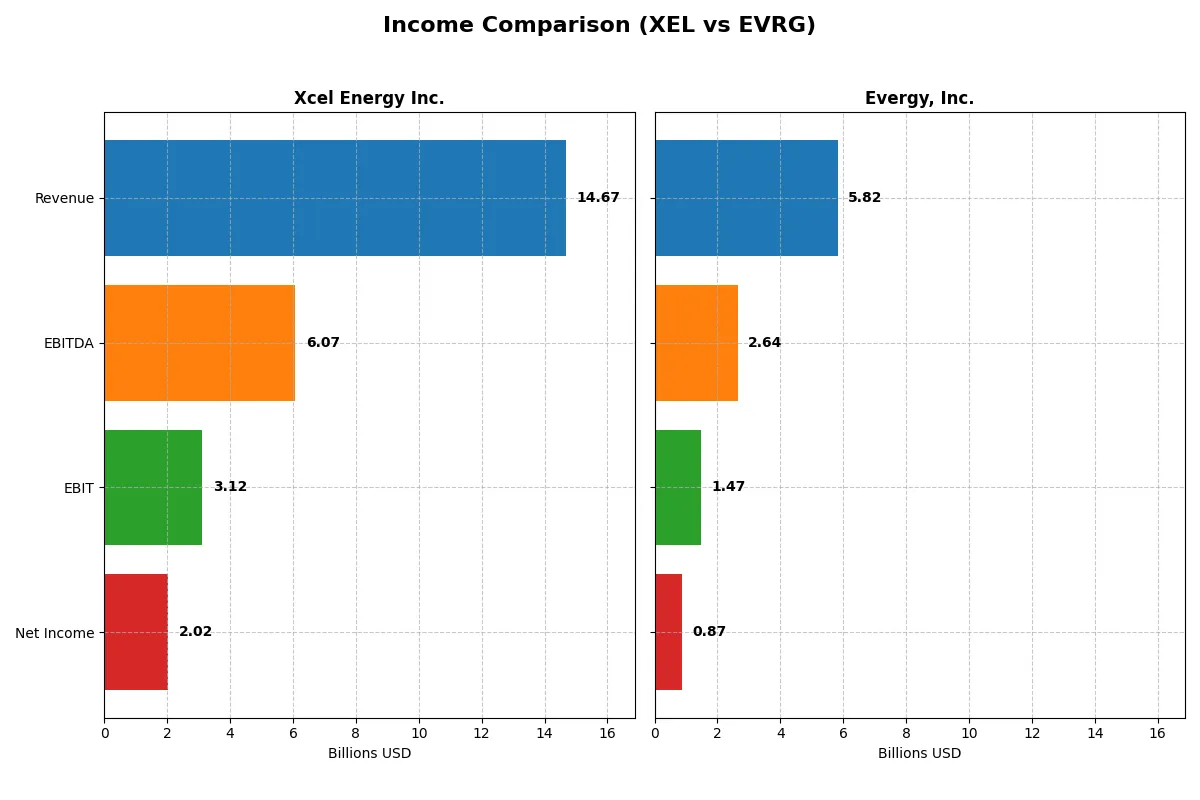
This table dissects the core profitability and scalability of both corporate engines to reveal who dominates the bottom line:
| Metric | Xcel Energy Inc. (XEL) | Evergy, Inc. (EVRG) |
|---|---|---|
| Revenue | 14.67B | 5.82B |
| Cost of Revenue | 11.10B | 3.93B |
| Operating Expenses | 686M | 453M |
| Gross Profit | 3.57B | 1.90B |
| EBITDA | 6.07B | 2.64B |
| EBIT | 3.12B | 1.47B |
| Interest Expense | 1.34B | 563M |
| Net Income | 2.02B | 874M |
| EPS | 3.44 | 3.79 |
| Fiscal Year | 2025 | 2024 |
Income Statement Analysis: The Bottom-Line Duel
This income statement comparison reveals which company converts revenue into profit most efficiently and sustains healthy margins over time.
Xcel Energy Inc. Analysis
Xcel Energy’s revenue grew steadily to $14.7B in 2025, with net income rising to $2.02B. Its gross margin contracted sharply by 42% in one year but remains solid at 24.3%. EBIT margin improved to 21.2%, showing operational efficiency gains. However, net margin dipped slightly to 13.8%, signaling some pressure on bottom-line profitability.
Evergy, Inc. Analysis
Evergy’s revenue expanded moderately to $5.8B in 2024, while net income climbed to $874M. The company boasts a superior gross margin of 32.6% and an EBIT margin of 25.3%, both indicating strong cost control. Net margin increased to 15%, supported by a 12.5% rise in profit margin and notable EPS growth of nearly 20%, reflecting robust earnings momentum.
Margin Strength vs. Growth Trajectory
Evergy leads in margin quality with higher gross and EBIT percentages, signaling stronger cost efficiency and profitability compared to Xcel. Xcel, however, shows greater absolute revenue and net income scale, with favorable long-term growth in net income and EPS. Investors prioritizing margin resilience may prefer Evergy’s profile, while those focused on top-line scale and steady net income growth might lean toward Xcel.
Financial Ratios Comparison
These vital ratios act as a diagnostic tool to expose the underlying fiscal health, valuation premiums, and capital efficiency of the companies compared below:
| Ratios | Xcel Energy Inc. (XEL) | Evergy, Inc. (EVRG) |
|---|---|---|
| ROE | 9.9% (2024) | 8.8% (2024) |
| ROIC | 3.6% (2024) | 4.5% (2024) |
| P/E | 19.6 (2024) | 16.2 (2024) |
| P/B | 1.95 (2024) | 1.42 (2024) |
| Current Ratio | 0.67 (2024) | 0.50 (2024) |
| Quick Ratio | 0.57 (2024) | 0.27 (2024) |
| D/E | 1.55 (2024) | 1.41 (2024) |
| Debt-to-Assets | 43.1% (2024) | 43.6% (2024) |
| Interest Coverage | 2.02 (2024) | 2.57 (2024) |
| Asset Turnover | 0.19 (2024) | 0.18 (2024) |
| Fixed Asset Turnover | 0.23 (2024) | 0.23 (2024) |
| Payout ratio | 82.2% (2025) | 68.3% (2024) |
| Dividend yield | 3.83% (2025) | 4.21% (2024) |
| Fiscal Year | 2024 | 2024 |
Efficiency & Valuation Duel: The Vital Signs
Financial ratios act as a company’s DNA, exposing hidden risks and revealing operational strength that numbers alone can’t show.
Xcel Energy Inc.
Xcel Energy posts a solid net margin of 13.76%, reflecting decent profitability despite a zero ROE and ROIC, which are red flags. Its P/E of 21.48 suggests a fairly valued stock. The 3.83% dividend yield rewards shareholders, indicating a preference for steady income over aggressive growth or buybacks.
Evergy, Inc.
Evergy shows a stronger net margin at 15% but a moderate ROE of 8.77%, signaling modest profitability. Its lower P/E of 16.23 implies relative undervaluation versus peers. The 4.21% dividend yield underscores a shareholder-friendly policy, though elevated debt ratios and weaker liquidity ratios raise caution.
Dividend Yield and Valuation Tradeoff
Both companies present slightly unfavorable overall ratios, yet Xcel balances profitability with consistent dividends, while Evergy offers a cheaper valuation but bears higher leverage risks. Income-focused investors may lean toward Xcel’s steadier profile, whereas value seekers might prefer Evergy’s discount with caution.
Which one offers the Superior Shareholder Reward?
I see Xcel Energy (XEL) yields 3.8% with a high payout ratio of 82%, signaling generous dividends but tight free cash flow coverage. Evergy (EVRG) offers a higher yield at 4.2% with a 68% payout ratio, balancing dividends and buybacks better. Both run intense buyback programs, but EVRG’s slightly lower payout ratio and stronger cash flow coverage suggest a more sustainable shareholder return. I conclude Evergy delivers a superior total return profile in 2026 for income-focused investors seeking durability and growth.
Comparative Score Analysis: The Strategic Profile
The radar chart reveals the fundamental DNA and trade-offs of both firms, highlighting their financial strengths and valuation nuances:
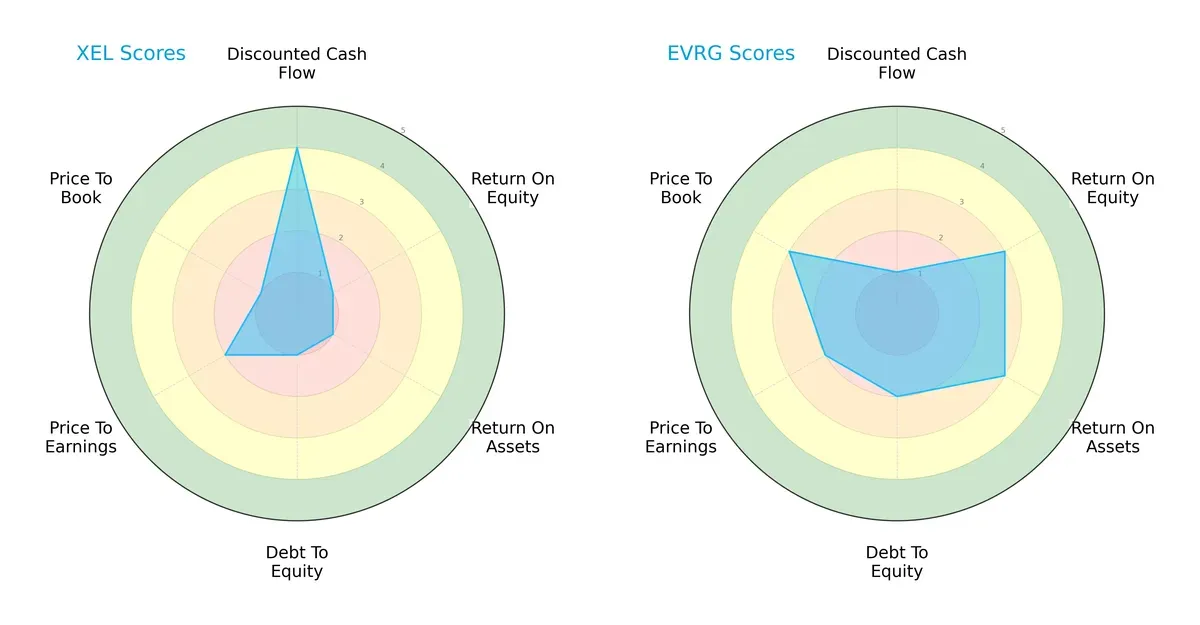
Xcel Energy Inc. (XEL) excels in discounted cash flow (DCF) with a favorable score of 4 but struggles significantly in returns (ROE and ROA scores of 1 each) and leverage (debt-to-equity score of 1). Evergy, Inc. (EVRG) shows moderate operational efficiency with ROE and ROA scores of 3 but falls short on valuation metrics, especially DCF scoring only 1. EVRG presents a more balanced profile with moderate returns and leverage, while XEL relies heavily on cash flow projections despite weak profitability and balance sheet metrics.
Financial Health: Quality of Operations
Xcel Energy and Evergy both show average Piotroski F-Scores, indicating moderate financial health without critical red flags:

XEL scores a 4, while EVRG edges slightly higher with a 5. Both scores suggest neither firm is in peak financial condition, but EVRG’s marginally better internal metrics imply a modest operational advantage. Investors should watch for potential weaknesses in profitability and efficiency for XEL as indicated by its lower score.
How are the two companies positioned?
This section dissects XEL and EVRG’s operational DNA by comparing revenue distribution and internal dynamics of strengths and weaknesses. The goal is to confront their economic moats and reveal which model offers the most resilient competitive advantage today.
Revenue Segmentation: The Strategic Mix
The following visual comparison dissects how Xcel Energy Inc. and Evergy, Inc. diversify their income streams and reveals where their primary sector bets lie:
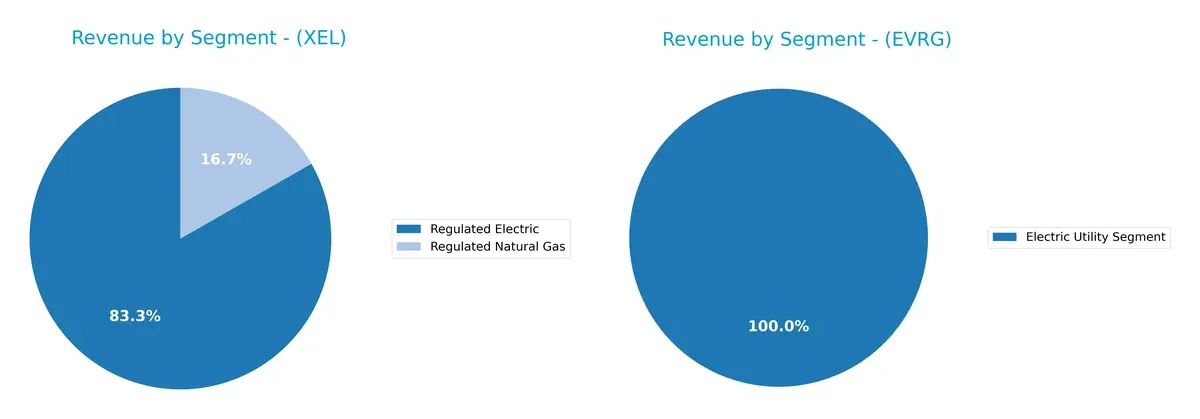
Xcel Energy anchors its revenue in Regulated Electric at $22.3B and Regulated Natural Gas at $4.5B, showing a clear two-pronged focus. Evergy, by contrast, pivots almost entirely on a single Electric Utility Segment around $2.7B. Xcel’s diversified mix reduces concentration risk and signals ecosystem lock-in, while Evergy’s reliance on one segment highlights infrastructure dominance but increases vulnerability to sector-specific shocks.
Strengths and Weaknesses Comparison
This table compares the Strengths and Weaknesses of Xcel Energy Inc. and Evergy, Inc.:
Xcel Energy Inc. Strengths
- Diverse revenue streams from regulated electric and natural gas segments
- Favorable net margin of 13.76%
- Favorable debt-to-equity and debt-to-assets ratios
- Dividend yield of 3.83% supports shareholder returns
Evergy, Inc. Strengths
- Favorable net margin of 15.0%
- Favorable weighted average cost of capital at 5.4%
- Positive price-to-book ratio at 1.42
- Dividend yield of 4.21% indicates steady income
Xcel Energy Inc. Weaknesses
- Unfavorable return on equity and return on invested capital at 0%
- Unavailable WACC data hinders cost of capital assessment
- Poor liquidity ratios with current and quick ratios at 0
- Unfavorable asset and fixed asset turnovers limit operational efficiency
Evergy, Inc. Weaknesses
- Unfavorable return on equity and return on invested capital below cost of capital
- High debt-to-equity ratio of 1.41 raises leverage concerns
- Low current and quick ratios indicate liquidity risk
- Unfavorable asset turnover metrics constrain asset utilization
Both companies show strengths in profitability and dividend yields but face weaknesses in returns on capital and liquidity. These factors suggest strategic focus on improving operational efficiency and balance sheet resilience.
The Moat Duel: Analyzing Competitive Defensibility
A structural moat shields long-term profits from competitive erosion. Without it, market gains quickly vanish. Here’s how Xcel Energy and Evergy stack up:
Xcel Energy Inc.: Intangible Assets and Regulatory Barriers
Xcel leverages regulatory frameworks and diverse energy sources, securing stable margins around 21% EBIT. However, declining ROIC signals pressure on capital efficiency in 2026.
Evergy, Inc.: Infrastructure Scale and Operational Efficiency
Evergy’s moat hinges on extensive transmission networks and operational scale, sustaining superior gross margins above 32%. Its improving ROIC trend suggests growing value despite current slight value destruction.
Infrastructure Scale vs. Regulatory Complexity: Which Moat Holds Deeper?
Evergy’s expanding ROIC and higher margins indicate a deeper moat than Xcel’s challenged capital returns. Evergy is better positioned to defend market share amid evolving energy demands.
Which stock offers better returns?
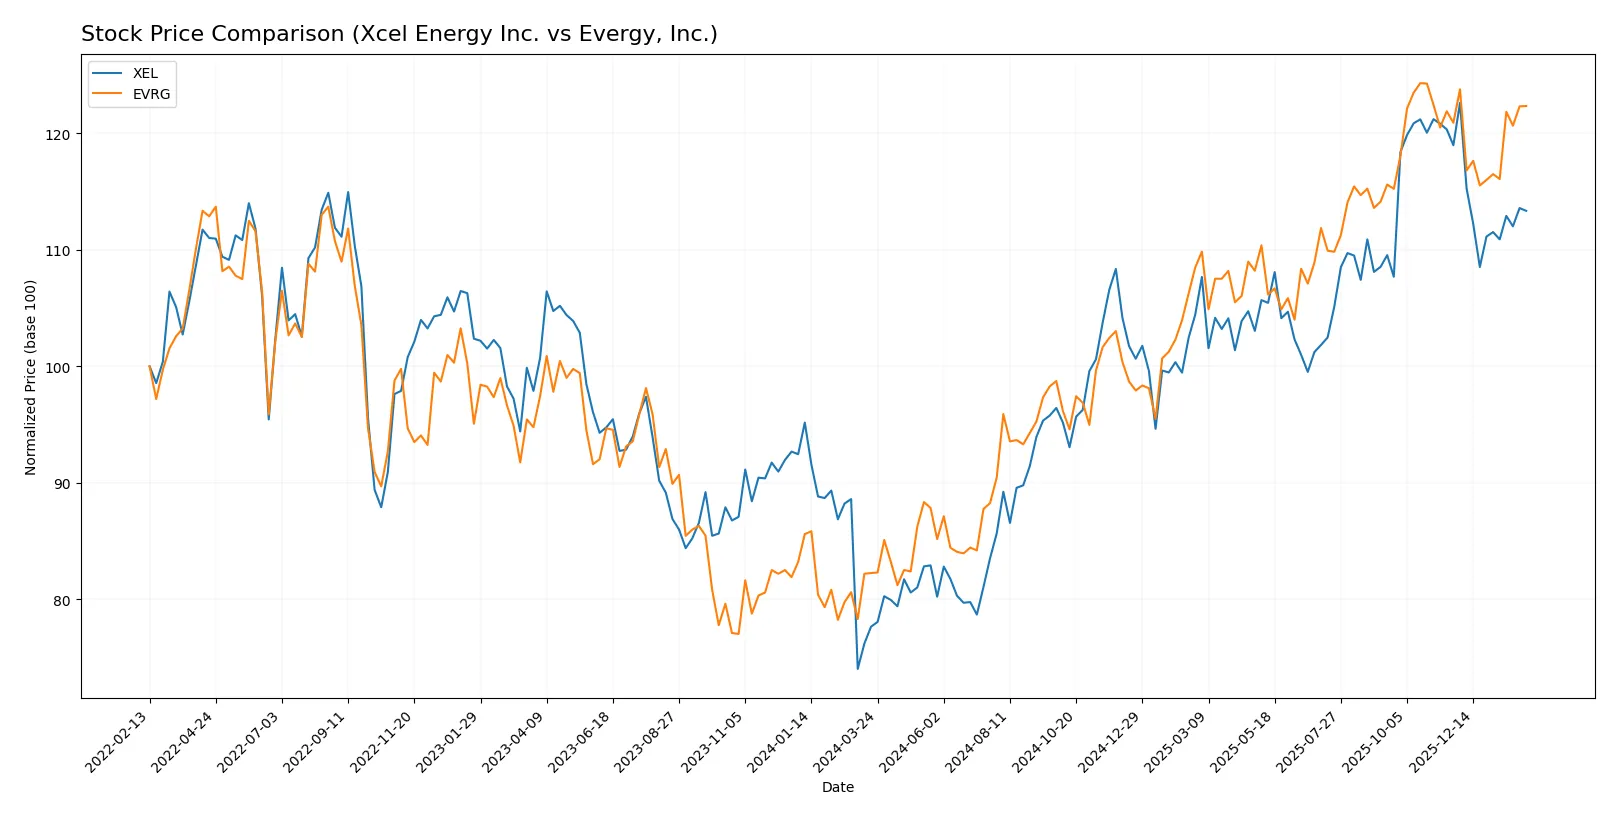
The past year shows strong price appreciation for both stocks, with Xcel Energy and Evergy exhibiting bullish trends but differing recent trading dynamics.
Trend Comparison
Xcel Energy’s stock rose 46% over the last 12 months, marking a bullish trend with decelerating momentum. It peaked at 82.11 and bottomed at 51.99, showing elevated volatility (8.24 std dev).
Evergy’s stock gained 48.7% in the same period, also bullish but with decelerating acceleration. Its highest price reached 77.98 and lowest 50.95, with a slightly lower volatility of 7.8 std dev.
Evergy outperformed Xcel Energy by roughly 2.7% over the last year, delivering the stronger overall market return despite Xcel’s higher trading volume and recent seller dominance.
Target Prices
Analysts present a constructive consensus on target prices for Xcel Energy Inc. and Evergy, Inc.
| Company | Target Low | Target High | Consensus |
|---|---|---|---|
| Xcel Energy Inc. | 81 | 95 | 88 |
| Evergy, Inc. | 76 | 91 | 82.67 |
The consensus targets for both utilities exceed current prices, suggesting moderate upside potential. This aligns with sector stability amid regulatory frameworks.

Don’t Let Luck Decide Your Entry Point
Optimize your entry points with our advanced ProRealTime indicators. You’ll get efficient buy signals with precise price targets for maximum performance. Start outperforming now!
How do institutions grade them?
The following tables summarize recent institutional grades for Xcel Energy Inc. and Evergy, Inc.:
Xcel Energy Inc. Grades
This table presents current grades from established financial institutions for Xcel Energy Inc.
| Grading Company | Action | New Grade | Date |
|---|---|---|---|
| Barclays | Maintain | Overweight | 2026-01-15 |
| UBS | Maintain | Neutral | 2025-12-17 |
| Keybanc | Maintain | Overweight | 2025-12-12 |
| JP Morgan | Maintain | Overweight | 2025-12-11 |
| Barclays | Maintain | Overweight | 2025-11-05 |
| Citigroup | Maintain | Buy | 2025-11-03 |
| UBS | Maintain | Neutral | 2025-10-31 |
| Mizuho | Maintain | Outperform | 2025-10-27 |
| Jefferies | Maintain | Buy | 2025-10-16 |
| Keybanc | Maintain | Overweight | 2025-10-15 |
Evergy, Inc. Grades
This table presents current grades from established financial institutions for Evergy, Inc.
| Grading Company | Action | New Grade | Date |
|---|---|---|---|
| BMO Capital | Maintain | Outperform | 2026-01-27 |
| Barclays | Maintain | Overweight | 2026-01-22 |
| Wells Fargo | Maintain | Equal Weight | 2026-01-20 |
| Mizuho | Downgrade | Neutral | 2025-12-18 |
| UBS | Maintain | Buy | 2025-12-17 |
| Citigroup | Maintain | Buy | 2025-11-10 |
| Jefferies | Maintain | Buy | 2025-10-09 |
| Mizuho | Maintain | Outperform | 2025-08-08 |
| Mizuho | Maintain | Outperform | 2025-07-18 |
| Barclays | Maintain | Overweight | 2025-05-30 |
Which company has the best grades?
Evergy, Inc. holds slightly stronger recent grades, including an Outperform from BMO Capital and several Buy ratings. Xcel Energy shows consistent Overweight and Buy ratings but fewer Outperform endorsements. For investors, Evergy’s higher-tier grades may indicate greater institutional confidence in near-term growth or valuation.
Risks specific to each company
The following categories identify the critical pressure points and systemic threats facing both firms in the 2026 market environment:
1. Market & Competition
Xcel Energy Inc.
- Large customer base of 3.7M, diversified energy sources, strong regional presence across multiple states.
Evergy, Inc.
- Smaller customer base of 1.6M, focused mainly in Kansas and Missouri, less diversified geographic footprint.
2. Capital Structure & Debt
Xcel Energy Inc.
- Favorable debt-to-equity metrics, manageable interest coverage at 2.32x, strong balance sheet indicators.
Evergy, Inc.
- Higher debt-to-equity ratio (1.41), weaker liquidity (current ratio 0.5), interest coverage slightly better at 2.61x but financial risk elevated.
3. Stock Volatility
Xcel Energy Inc.
- Beta of 0.48 signals lower volatility, steady dividend yield of 3.83%.
Evergy, Inc.
- Beta of 0.64 indicates higher volatility, dividend yield slightly higher at 4.21%, implying more cyclical risk.
4. Regulatory & Legal
Xcel Energy Inc.
- Operates in multiple regulated states, subject to evolving environmental regulations impacting coal and gas assets.
Evergy, Inc.
- Regulated mainly in fewer states with similar environmental and energy policy risks, but less geographic regulatory diversification.
5. Supply Chain & Operations
Xcel Energy Inc.
- Broad energy mix including renewables, improving operational efficiency remains a challenge given asset turnover ratios.
Evergy, Inc.
- Reliant on coal and natural gas, asset turnover ratios low, pointing to operational inefficiencies and potential supply chain bottlenecks.
6. ESG & Climate Transition
Xcel Energy Inc.
- Strong push towards renewables and sustainable energy sources; transition risks remain but better positioned.
Evergy, Inc.
- Transition lagging relative to peers, higher exposure to fossil fuels, ESG risks more pronounced amid tightening regulations.
7. Geopolitical Exposure
Xcel Energy Inc.
- Primarily domestic U.S. operations with limited geopolitical risk but exposed to regional policy shifts.
Evergy, Inc.
- Also U.S.-focused, but smaller scale may limit resilience to regional economic or policy disruptions.
Which company shows a better risk-adjusted profile?
Xcel Energy’s strongest risk for investors lies in its operational inefficiencies despite strong capital structure and diversified footprint. Evergy’s critical risk is elevated financial leverage coupled with higher volatility and weaker liquidity. Xcel’s lower beta and more favorable debt metrics give it a superior risk-adjusted profile. However, Evergy’s distress-level Altman Z-score and moderate Piotroski score underscore solvency concerns that heighten investment risk. The data confirms that Xcel’s wider diversification and financial discipline better mitigate market and credit risks in today’s turbulent energy sector.
Final Verdict: Which stock to choose?
Xcel Energy Inc. (XEL) excels as a reliable cash generator with a solid dividend yield, appealing to income-focused investors. Its main point of vigilance is the declining return on invested capital, signaling potential efficiency challenges. XEL suits portfolios prioritizing steady income combined with moderate growth.
Evergy, Inc. (EVRG) boasts a strategic moat through improving profitability and a gradually growing ROIC, despite currently shedding value. Its stronger revenue growth and more favorable earnings trajectory provide a cushion against market volatility. EVRG fits portfolios targeting growth at a reasonable price with a tilt toward financial recovery.
If you prioritize dependable income and a stable dividend, XEL is the compelling choice due to its cash generation and payout consistency. However, if you seek growth potential with improving operational efficiency, EVRG offers better stability in earnings growth and a brighter outlook on value creation. Both carry risks typical of utilities, so matching your risk tolerance to these profiles is key.
Disclaimer: Investment carries a risk of loss of initial capital. The past performance is not a reliable indicator of future results. Be sure to understand risks before making an investment decision.
Go Further
I encourage you to read the complete analyses of Xcel Energy Inc. and Evergy, Inc. to enhance your investment decisions: