WEC Energy Group, Inc. and Evergy, Inc. are two prominent players in the regulated electric utilities sector, both committed to delivering reliable energy through a mix of traditional and renewable sources. Their overlapping markets and strategic focus on innovation in clean energy make them compelling candidates for comparison. In this article, I will analyze their strengths and risks to help you decide which company holds the most promise for your investment portfolio.
Table of contents
Companies Overview
I will begin the comparison between WEC Energy Group, Inc. and Evergy, Inc. by providing an overview of these two companies and their main differences.
WEC Overview
WEC Energy Group, Inc. operates primarily in the regulated electric utility sector, delivering natural gas, electricity, and renewable energy services across multiple U.S. states. With a mission to provide reliable energy, WEC manages extensive infrastructure including over 35,800 miles of overhead and 35,600 miles of underground electric distribution lines. The company’s diversified generation portfolio includes coal, natural gas, oil, hydroelectric, wind, solar, and biomass sources.
EVRG Overview
Evergy, Inc. is a regulated electric utility serving Kansas and Missouri, focusing on generating, transmitting, distributing, and selling electricity. The company’s energy production derives from coal, hydroelectric, landfill gas, uranium, natural gas, oil, solar, wind, and other renewables. Evergy supports approximately 1.6M customers and operates around 10,100 circuit miles of transmission lines, along with 52,800 circuit miles of distribution lines, combining overhead and underground.
Key similarities and differences
Both WEC and Evergy operate in the regulated electric utility sector with diverse energy portfolios including renewables and fossil fuels. They maintain extensive transmission and distribution networks to serve residential, commercial, and industrial customers. However, WEC has a larger market capitalization and broader geographic presence across several states, while Evergy focuses mainly on Kansas and Missouri, serving a smaller customer base but with a comparable mix of generation sources.
Income Statement Comparison
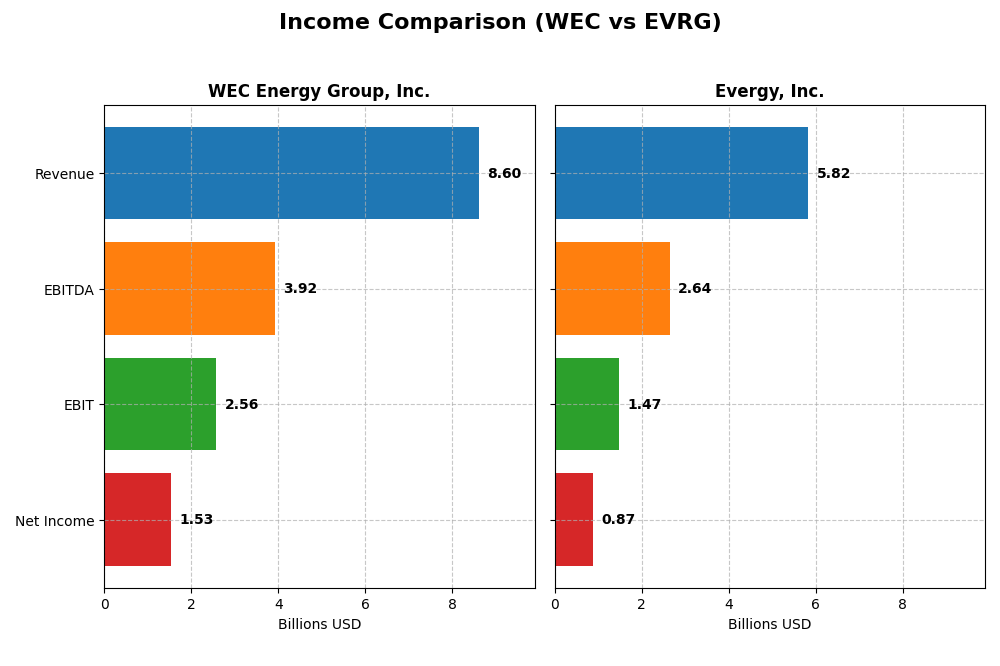
The table below presents a side-by-side comparison of key income statement metrics for WEC Energy Group, Inc. and Evergy, Inc. for the fiscal year 2024.
| Metric | WEC Energy Group, Inc. | Evergy, Inc. |
|---|---|---|
| Market Cap | 33.5B | 16.8B |
| Revenue | 8.60B | 5.82B |
| EBITDA | 3.92B | 2.64B |
| EBIT | 2.56B | 1.47B |
| Net Income | 1.53B | 874M |
| EPS | 4.81 | 3.79 |
| Fiscal Year | 2024 | 2024 |
Income Statement Interpretations
WEC Energy Group, Inc.
WEC Energy Group showed overall revenue growth of 18.76% from 2020 to 2024, with net income rising 27.25% over the same period. Margins remain largely favorable, with a gross margin of 44.02% and net margin of 17.77% in 2024. Despite a slight 3.3% revenue decline in 2024, net income and margins improved significantly, reflecting stronger profitability and efficient cost management.
Evergy, Inc.
Evergy reported 18.53% revenue growth and a more pronounced 41.27% net income increase from 2020 to 2024. Gross and net margins stood at 32.57% and 15.0% respectively in 2024, both favorable. The latest year showed a 6.17% revenue rise, though operating expenses grew similarly, slightly pressuring margins; still, EBIT and net margin improvements indicate enhanced earnings quality.
Which one has the stronger fundamentals?
Both companies present favorable income statement trends, but WEC exhibits higher margins and more stable cost control, while Evergy’s net income growth and EPS gains are stronger. WEC’s minor recent revenue dip contrasts with Evergy’s revenue growth but rising expenses. Overall, WEC’s superior margin profile balances Evergy’s aggressive earnings expansion, providing distinct fundamental strengths for each.
Financial Ratios Comparison
The table below presents the most recent financial ratios for WEC Energy Group, Inc. and Evergy, Inc., reflecting their performance and financial health as of fiscal year 2024.
| Ratios | WEC Energy Group, Inc. | Evergy, Inc. |
|---|---|---|
| ROE | 12.3% | 8.8% |
| ROIC | 4.1% | 4.5% |
| P/E | 19.5 | 16.2 |
| P/B | 2.39 | 1.42 |
| Current Ratio | 0.60 | 0.50 |
| Quick Ratio | 0.43 | 0.27 |
| D/E (Debt-to-Equity) | 1.64 | 1.41 |
| Debt-to-Assets | 42.9% | 43.6% |
| Interest Coverage | 2.64 | 2.57 |
| Asset Turnover | 0.18 | 0.18 |
| Fixed Asset Turnover | 0.25 | 0.23 |
| Payout Ratio | 69.1% | 68.3% |
| Dividend Yield | 3.55% | 4.21% |
Interpretation of the Ratios
WEC Energy Group, Inc.
WEC exhibits a mixed ratio profile with strong net margin (17.77%, favorable) and dividend yield (3.55%, favorable), but weak liquidity ratios (current ratio 0.6, unfavorable) and leverage (debt-to-equity 1.64, unfavorable). Return on equity is neutral at 12.3%, while return on invested capital is unfavorable at 4.14%. The company pays dividends with a solid yield, but some financial ratios suggest caution.
Evergy, Inc.
Evergy shows favorable net margin (15.0%) and price-to-book ratio (1.42), but weak profitability metrics such as return on equity (8.77%, unfavorable) and return on invested capital (4.52%, unfavorable). Liquidity ratios are low (current ratio 0.5, unfavorable), and leverage remains high (debt-to-equity 1.41, unfavorable). It also pays dividends with a higher yield (4.21%), balancing some financial risks.
Which one has the best ratios?
Both companies have slightly unfavorable overall ratio profiles due to weak liquidity and leverage metrics. WEC shows stronger profitability and return on equity, while Evergy benefits from a better price-to-book ratio and higher dividend yield. The balance of favorable and unfavorable ratios is close, with no clear superior choice based solely on these metrics.
Strategic Positioning
This section compares the strategic positioning of WEC and EVRG, including market position, key segments, and exposure to technological disruption:
WEC
- Larger market cap of 33.5B; faces regulated electric utility competition with moderate beta of 0.573.
- Diverse segments: Wisconsin, Illinois, Other States, Non-Utility Energy Infrastructure generating revenue.
- Operates with multiple energy sources including coal, natural gas, oil, renewables; exposure to energy transition pressures.
EVRG
- Smaller market cap of 16.8B; operates in regulated electric sector with slightly higher beta of 0.646.
- Concentrated in Electric Utility segment serving Kansas and Missouri customers across generation and distribution.
- Uses coal, natural gas, uranium, renewables; exposed to shifts in energy generation technologies.
WEC vs EVRG Positioning
WEC shows a diversified segment approach across multiple states and infrastructure sectors, while EVRG focuses on a more concentrated regional electric utility business. WEC’s broader footprint may offer varied revenue streams; EVRG’s focus could mean operational specialization but less segment diversity.
Which has the best competitive advantage?
Both companies have slightly unfavorable moat evaluations, shedding value but showing improving ROIC trends. Neither currently demonstrates a strong economic moat, indicating competitive advantages are limited and profitability is under pressure.
Stock Comparison
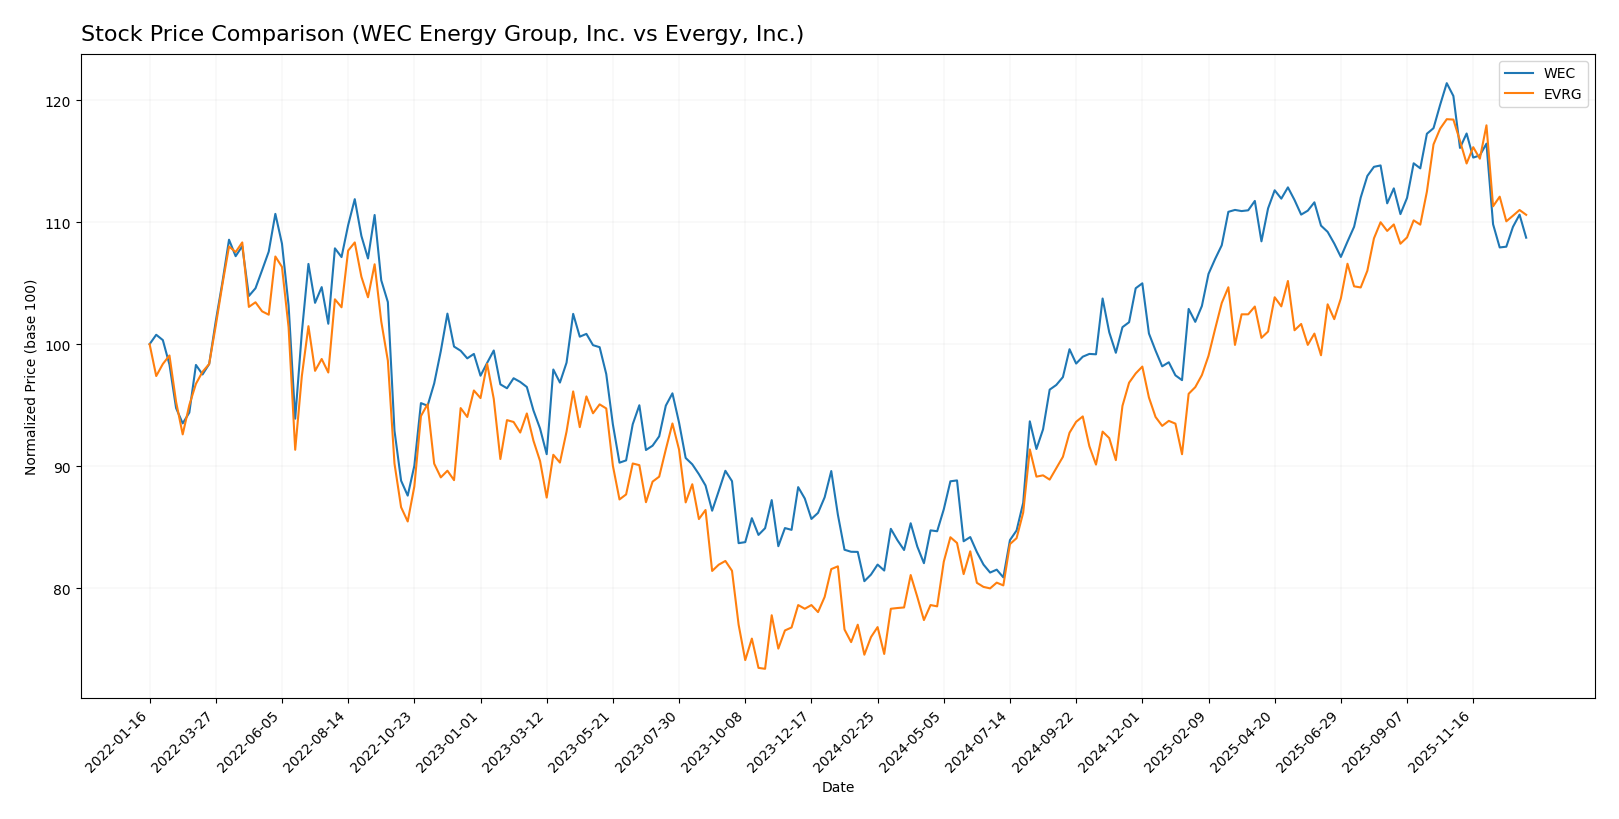
The stock prices of WEC Energy Group, Inc. and Evergy, Inc. have shown notable bullish trends over the past 12 months, with both experiencing deceleration in momentum and recent short-term declines in price.
Trend Analysis
WEC Energy Group, Inc. exhibited a bullish trend with a 34.05% price increase over the past year, though this growth has decelerated. The stock reached a high of 116.84 and a low of 77.85, with recent weeks showing a 9.65% decline.
Evergy, Inc. demonstrated a stronger bullish trend, gaining 45.55% over the same period but also experiencing deceleration. Its price ranged from 49.12 to 77.98, with a recent 6.59% drop in value.
Comparing both, Evergy, Inc. delivered higher market performance over the past year, despite similar deceleration and recent downward trends in their stock prices.
Target Prices
The current analyst consensus suggests moderate upside potential for both WEC Energy Group, Inc. and Evergy, Inc.
| Company | Target High | Target Low | Consensus |
|---|---|---|---|
| WEC Energy Group, Inc. | 136 | 105 | 122.67 |
| Evergy, Inc. | 93 | 76 | 82.67 |
Analysts expect WEC’s stock to rise from its current price of $104.65 toward a consensus target of $122.67. Evergy’s consensus target of $82.67 also indicates upside from its current $72.82 price.
Analyst Opinions Comparison
This section compares analysts’ ratings and grades for WEC Energy Group, Inc. (WEC) and Evergy, Inc. (EVRG):
Rating Comparison
WEC Rating
- Rating: B- with a very favorable status.
- Discounted Cash Flow Score: 1, very unfavorable, indicating potential overvaluation.
- ROE Score: 4, favorable, showing strong profit generation from equity.
- ROA Score: 4, favorable, indicating efficient asset utilization.
- Debt To Equity Score: 2, moderate, reflecting balanced financial risk.
- Overall Score: 3, moderate, summarizing the company’s financial standing.
EVRG Rating
- Rating: B- with a very favorable status.
- Discounted Cash Flow Score: 1, very unfavorable, indicating potential overvaluation.
- ROE Score: 3, moderate, showing average profit generation from equity.
- ROA Score: 3, moderate, indicating average asset utilization.
- Debt To Equity Score: 2, moderate, reflecting balanced financial risk.
- Overall Score: 2, moderate, summarizing the company’s financial standing.
Which one is the best rated?
Based strictly on the data, WEC has higher scores in return on equity, return on assets, and overall score compared to EVRG, indicating a slightly stronger financial evaluation by analysts.
Scores Comparison
The following table compares the Altman Z-Score and Piotroski Score for WEC and EVRG:
WEC Scores
- Altman Z-Score: 1.14, in distress zone indicating higher bankruptcy risk
- Piotroski Score: 6, average financial strength
EVRG Scores
- Altman Z-Score: 0.82, in distress zone indicating higher bankruptcy risk
- Piotroski Score: 5, average financial strength
Which company has the best scores?
WEC has a higher Altman Z-Score (1.14 vs. 0.82) and a slightly better Piotroski Score (6 vs. 5) than EVRG. Both are in the distress zone with average Piotroski scores, but WEC’s scores indicate marginally better financial health.
Grades Comparison
Here is a comparison of recent grades assigned by reputable grading companies for the two energy companies:
WEC Energy Group, Inc. Grades
The following table summarizes the latest grades and actions from major grading firms for WEC Energy Group, Inc.:
| Grading Company | Action | New Grade | Date |
|---|---|---|---|
| B of A Securities | Maintain | Neutral | 2025-12-31 |
| UBS | Maintain | Neutral | 2025-12-17 |
| Barclays | Maintain | Underweight | 2025-12-16 |
| Keybanc | Maintain | Overweight | 2025-12-12 |
| JP Morgan | Maintain | Neutral | 2025-12-11 |
| Scotiabank | Maintain | Sector Outperform | 2025-10-31 |
| BMO Capital | Maintain | Market Perform | 2025-10-21 |
| Barclays | Maintain | Equal Weight | 2025-10-21 |
| Keybanc | Maintain | Overweight | 2025-10-15 |
| UBS | Maintain | Neutral | 2025-10-10 |
Overall, WEC’s grades show a generally neutral to slightly positive stance, with multiple firms maintaining “Neutral” or “Overweight” ratings and no recent upgrades or downgrades.
Evergy, Inc. Grades
The following table summarizes recent grades and actions from major grading firms for Evergy, Inc.:
| Grading Company | Action | New Grade | Date |
|---|---|---|---|
| Mizuho | Downgrade | Neutral | 2025-12-18 |
| UBS | Maintain | Buy | 2025-12-17 |
| Citigroup | Maintain | Buy | 2025-11-10 |
| Jefferies | Maintain | Buy | 2025-10-09 |
| Mizuho | Maintain | Outperform | 2025-08-08 |
| Mizuho | Maintain | Outperform | 2025-07-18 |
| Barclays | Maintain | Overweight | 2025-05-30 |
| Citigroup | Maintain | Buy | 2025-05-16 |
| UBS | Upgrade | Buy | 2025-04-28 |
| Barclays | Maintain | Overweight | 2025-04-22 |
Evergy’s ratings reveal a generally positive outlook with multiple “Buy” and “Outperform” grades sustained over time, though one downgrade from “Outperform” to “Neutral” was noted recently.
Which company has the best grades?
Evergy, Inc. holds the stronger overall grades, with more consistent “Buy” and “Outperform” ratings compared to WEC Energy Group’s largely “Neutral” and “Hold” consensus. This suggests investors may perceive Evergy as having higher growth or value potential.
Strengths and Weaknesses
Below is a comparison of WEC Energy Group, Inc. (WEC) and Evergy, Inc. (EVRG) based on key investment criteria.
| Criterion | WEC Energy Group, Inc. (WEC) | Evergy, Inc. (EVRG) |
|---|---|---|
| Diversification | Moderate diversification across Illinois, Wisconsin, Other States, and Non-Utility Energy Infrastructure segments. | Concentrated mainly in Electric Utility segment with limited diversification. |
| Profitability | Net margin at 17.77% (favorable), ROE neutral at 12.3%, but ROIC unfavorable at 4.14% below WACC. | Net margin slightly lower at 15.0% (favorable), ROE unfavorable at 8.77%, ROIC also unfavorable at 4.52%. |
| Innovation | Limited data on innovation; steady growth in ROIC trend suggests improving operational efficiency. | Similar to WEC, ROIC shows strong growth trend but still below WACC, indicating room for improvement. |
| Global presence | Focused on U.S. regional markets, especially Wisconsin and Illinois; no global footprint. | Also U.S.-focused with no international presence, concentrated in Midwestern utility markets. |
| Market Share | Strong presence in Wisconsin and Illinois markets, with significant revenue from Wisconsin (~$6.3B in 2024). | Smaller scale with revenues around $2.7B in Electric Utility segment, indicating smaller market share. |
Key takeaways: Both companies show slightly unfavorable moat status, with ROIC below WACC but improving profitability trends. WEC offers more diversification and larger market share, while EVRG’s focused utility model presents higher risk but improving returns. Investors should weigh growth potential against current value destruction cautiously.
Risk Analysis
Below is a table summarizing key risks for WEC Energy Group, Inc. and Evergy, Inc. based on recent financial and operational data for 2024.
| Metric | WEC Energy Group, Inc. | Evergy, Inc. |
|---|---|---|
| Market Risk | Moderate (Beta 0.57) | Moderate (Beta 0.65) |
| Debt Level | High (D/E 1.64, 43% debt/assets) | High (D/E 1.41, 44% debt/assets) |
| Regulatory Risk | Elevated (regulated electric sector) | Elevated (regulated electric sector) |
| Operational Risk | Medium (complex infrastructure) | Medium (extensive transmission lines) |
| Environmental Risk | Significant (coal and natural gas reliance) | Significant (coal, natural gas, uranium) |
| Geopolitical Risk | Low (domestic US operations) | Low (domestic US operations) |
The most impactful risks are the high debt levels combined with environmental exposure to fossil fuels, which could increase costs or liabilities if regulations tighten. Both companies operate in regulated markets, heightening regulatory risk, while operational complexities underline the need for robust management to avoid disruptions.
Which Stock to Choose?
WEC Energy Group, Inc. shows a generally favorable income statement with strong net margin growth and profitability, despite a slight revenue decline recently. Its financial ratios reveal a mixed picture with several unfavorable metrics, including leverage and liquidity issues, while maintaining moderate profitability and a very favorable overall rating. The company appears to be shedding value as ROIC remains below WACC, though its ROIC trend is positive.
Evergy, Inc. also presents a favorable income statement with solid net income and EPS growth. Its financial ratios suggest more unfavorable factors than WEC, particularly in profitability and leverage, but it benefits from a favorable dividend yield and lower valuation multiples. Like WEC, EVRG is currently value-destroying with ROIC below WACC, but shows a stronger upward ROIC trend.
For investors prioritizing income statement strength and moderate financial stability, WEC might appear more favorable given its superior profitability and rating scores. Conversely, those focused on dividend yield and valuation could find Evergy’s profile more attractive despite its weaker profitability metrics. Both companies show value destruction presently but improving profitability trends, indicating different risk and growth considerations depending on investor preferences.
Disclaimer: Investment carries a risk of loss of initial capital. The past performance is not a reliable indicator of future results. Be sure to understand risks before making an investment decision.
Go Further
I encourage you to read the complete analyses of WEC Energy Group, Inc. and Evergy, Inc. to enhance your investment decisions: