In the regulated electric utility sector, The Southern Company (SO) and Evergy, Inc. (EVRG) stand out as key players with overlapping markets and distinct innovation approaches. Southern Company boasts a broad customer base and extensive renewable assets, while Evergy focuses on a more concentrated regional footprint with diversified energy sources. This comparison will help investors identify which company offers the most compelling opportunity amid evolving energy trends. Let’s explore their potential together.
Table of contents
Companies Overview
I will begin the comparison between The Southern Company and Evergy, Inc. by providing an overview of these two companies and their main differences.
The Southern Company Overview
The Southern Company, headquartered in Atlanta, Georgia, operates in the regulated electric industry. It engages in electricity generation, transmission, and distribution, serving around 8.7M electric and gas utility customers. The company manages diverse power generation assets including renewable energy projects, and extensive natural gas infrastructure. Founded in 1945, it is a major utility player with a market cap near 95.7B USD.
Evergy, Inc. Overview
Evergy, Inc., based in Kansas City, Missouri, is also in the regulated electric sector. It provides electricity generation, transmission, and distribution primarily in Kansas and Missouri, serving roughly 1.62M customers. Evergy’s generation sources include coal, hydro, natural gas, and renewables. Founded in 2017, this smaller company has a market cap of approximately 16.8B USD and operates extensive transmission and distribution lines.
Key similarities and differences
Both companies operate in the regulated electric utilities industry, focusing on generation, transmission, and distribution of electricity with a mix of fossil and renewable energy sources. The Southern Company is significantly larger, with broader geographic coverage and a larger customer base. Evergy is more regionally focused with fewer customers and employees. Both maintain diversified energy portfolios but differ in scale and infrastructure footprint.
Income Statement Comparison
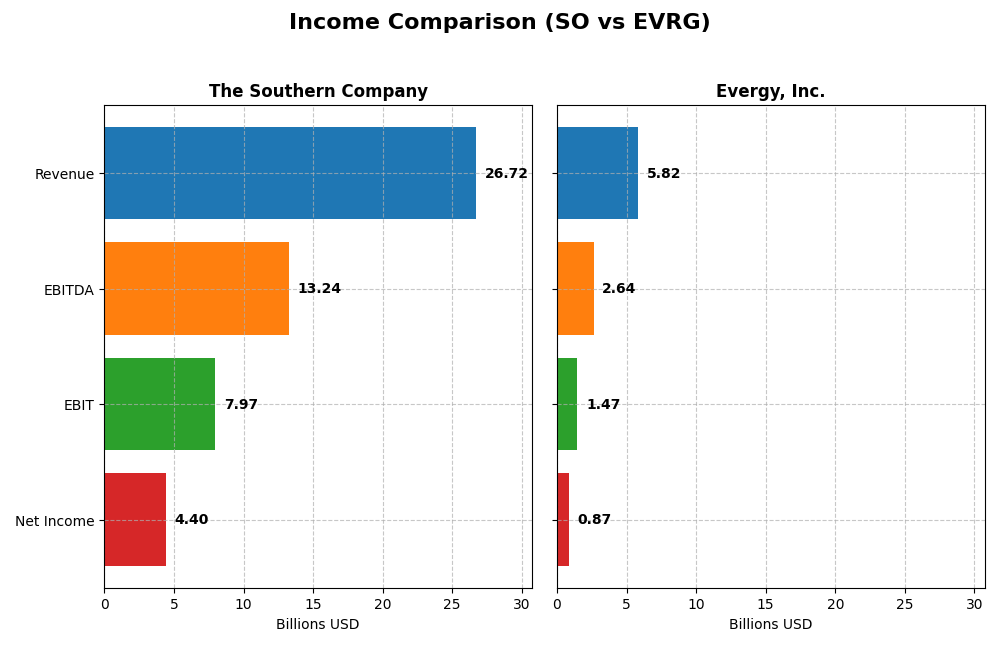
The table below compares key income statement metrics for The Southern Company and Evergy, Inc. for the fiscal year 2024, providing a snapshot of their financial performance.
| Metric | The Southern Company | Evergy, Inc. |
|---|---|---|
| Market Cap | 95.7B | 16.8B |
| Revenue | 26.7B | 5.82B |
| EBITDA | 13.2B | 2.64B |
| EBIT | 7.97B | 1.47B |
| Net Income | 4.40B | 874M |
| EPS | 4.02 | 3.79 |
| Fiscal Year | 2024 | 2024 |
Income Statement Interpretations
The Southern Company
The Southern Company’s revenue increased by 31.16% from 2020 to 2024, with net income rising 40.43% over the same period. Gross margin remained strong near 49.93%, while net margin showed moderate improvement. In 2024, revenue grew 5.83% year-over-year and net income increased by 10.22%, reflecting solid operational performance despite rising operating expenses.
Evergy, Inc.
Evergy’s revenue rose 18.53% over the 2020–2024 period, with net income growth of 41.27%. Gross margin was steady at 32.57%, and net margin improved significantly by 19.19% overall. In 2024, revenue grew 6.17% year-over-year and net income advanced 19.56%, supported by favorable margin expansion and efficient cost management despite slightly higher operating expenses.
Which one has the stronger fundamentals?
Both companies demonstrate favorable income statement trends with solid revenue and net income growth alongside improving margins. The Southern Company benefits from higher gross and net margins, while Evergy shows stronger net margin growth and EPS improvement. Evergy’s lower interest expense ratio is neutral, contrasting with Southern’s unfavorable interest expense, reflecting differing financial structures affecting fundamentals.
Financial Ratios Comparison
This table presents a side-by-side comparison of key financial ratios for The Southern Company (SO) and Evergy, Inc. (EVRG), based on their most recent fiscal year data (2024).
| Ratios | The Southern Company (SO) | Evergy, Inc. (EVRG) |
|---|---|---|
| ROE | 13.3% | 8.8% |
| ROIC | 4.3% | 4.5% |
| P/E | 20.5 | 16.2 |
| P/B | 2.72 | 1.42 |
| Current Ratio | 0.67 | 0.50 |
| Quick Ratio | 0.46 | 0.27 |
| D/E (Debt-to-Equity) | 2.00 | 1.41 |
| Debt-to-Assets | 45.7% | 43.6% |
| Interest Coverage | 2.58 | 2.57 |
| Asset Turnover | 0.18 | 0.18 |
| Fixed Asset Turnover | 0.25 | 0.23 |
| Payout Ratio | 67.1% | 68.3% |
| Dividend Yield | 3.27% | 4.21% |
Interpretation of the Ratios
The Southern Company
The Southern Company shows mixed financial ratios with a favorable net margin of 16.47% and a solid dividend yield of 3.27%, but weaknesses include a low current ratio (0.67) and high debt-to-equity ratio of 2.0, indicating liquidity and leverage concerns. Dividend payments appear sustainable but watch for risks linked to heavy leverage and cash flow coverage.
Evergy, Inc.
Evergy presents a favorable net margin of 15.0% and a higher dividend yield at 4.21%, but suffers from lower returns on equity (8.77%) and invested capital, alongside a weak current ratio of 0.5 and debt-to-equity at 1.41. The company maintains dividend payments, though leverage and liquidity indicators signal caution in shareholder returns sustainability.
Which one has the best ratios?
Both companies face liquidity challenges and moderate leverage, with Evergy showing a slightly better dividend yield and price-to-book ratio. However, Southern Company outperforms on return on equity and net margin. Overall, each has strengths and weaknesses, resulting in a slightly unfavorable global ratios opinion for both with no clear superiority.
Strategic Positioning
This section compares the strategic positioning of The Southern Company and Evergy, Inc., focusing on market position, key segments, and exposure to technological disruption:
The Southern Company
- Larger market cap of 95.7B with diversified operations across multiple states and segments, facing regulated electric competition.
- Key segments include gas distribution, gas marketing, pipeline investments, and diverse power generation including renewable energy projects.
- Operates a broad energy portfolio including hydro, fossil, nuclear, solar, wind, fuel cells, and battery storage, indicating moderate disruption exposure.
Evergy, Inc.
- Smaller market cap of 16.8B focused on Kansas and Missouri markets, operating under regulated electric industry pressure.
- Primarily focused on electricity generation, transmission, and distribution with mixed energy sources including renewables.
- Generates electricity via coal, hydro, landfill gas, uranium, natural gas, oil, solar, and wind, showing exposure to energy transition trends.
The Southern Company vs Evergy, Inc. Positioning
The Southern Company demonstrates a diversified business model spanning multiple energy sources and gas operations, while Evergy concentrates on electricity generation and distribution in two states. Southern’s scale offers broader segment exposure, contrasting with Evergy’s regional focus.
Which has the best competitive advantage?
Both companies exhibit a slightly unfavorable moat status, shedding value yet showing growing ROIC trends. Neither currently holds a strong competitive advantage based on return on invested capital relative to cost of capital.
Stock Comparison
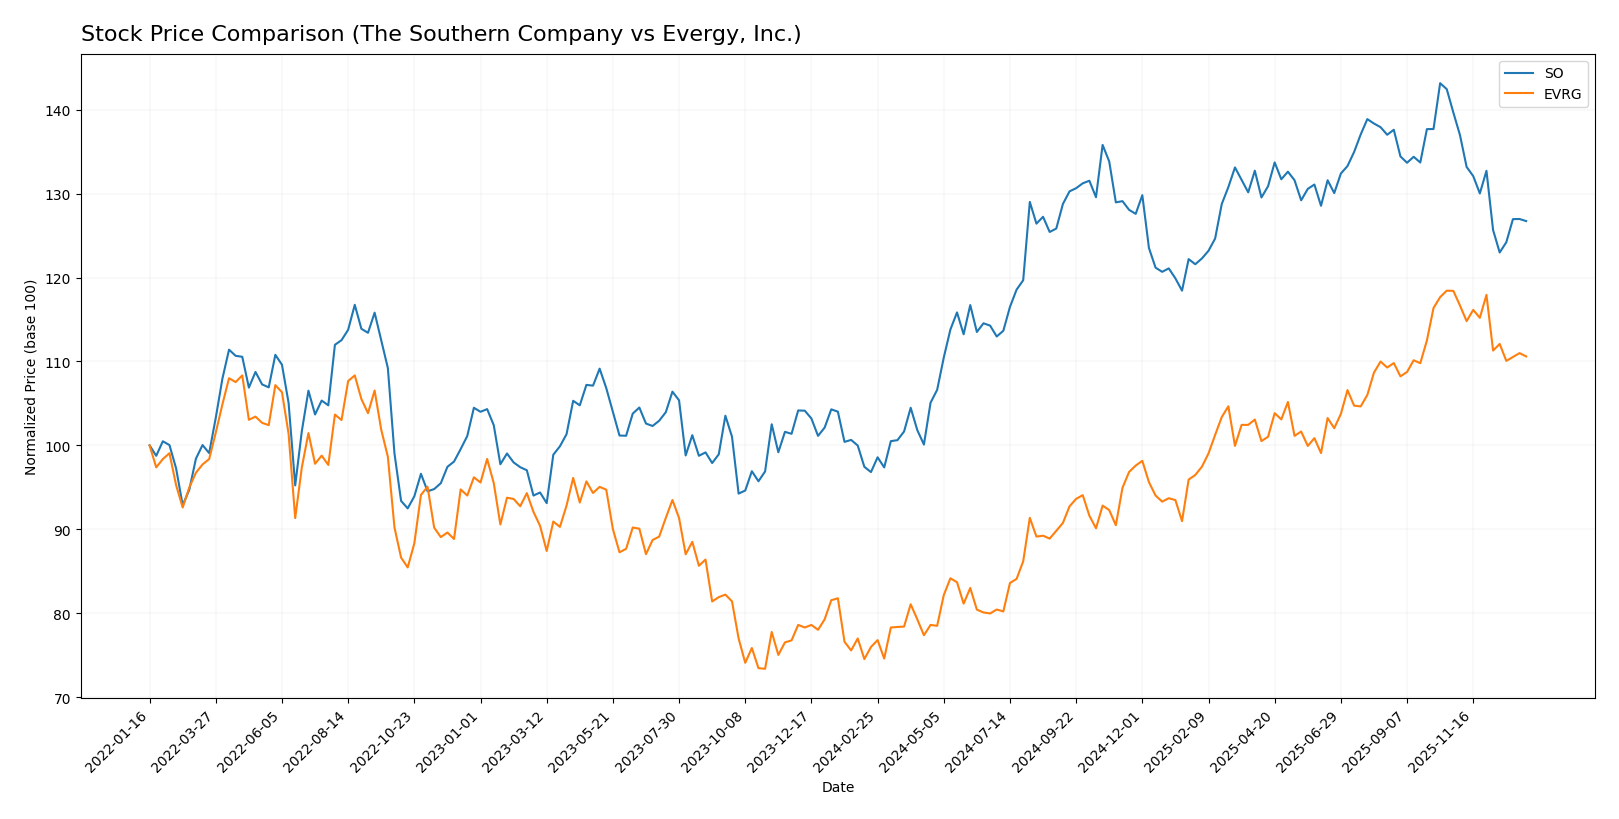
The stock price movements of The Southern Company (SO) and Evergy, Inc. (EVRG) over the past 12 months reveal significant bullish trends with deceleration in momentum, followed by recent declines in both equities, reflecting shifting trading dynamics.
Trend Analysis
The Southern Company (SO) showed a 30.88% price increase over the past year, indicating a bullish trend with deceleration. Recent weeks reflect a -9.25% decline, confirming a short-term bearish slope.
Evergy, Inc. (EVRG) experienced a 45.55% price increase over the same period, also bullish with deceleration. Recently, the stock declined by -6.59%, marking a mild bearish trend in the near term.
Comparing both stocks, EVRG delivered the highest market performance with a 45.55% gain versus SO’s 30.88%, despite both showing recent downward momentum.
Target Prices
Analysts present a clear target price consensus for both The Southern Company and Evergy, Inc.
| Company | Target High | Target Low | Consensus |
|---|---|---|---|
| The Southern Company | 103 | 76 | 93.1 |
| Evergy, Inc. | 93 | 76 | 82.67 |
The Southern Company’s consensus target of 93.1 is modestly above its current price of 87.01, indicating moderate upside potential. Evergy’s consensus target of 82.67 also suggests upside from the current 72.82 price, reflecting generally positive analyst expectations.
Analyst Opinions Comparison
This section compares analysts’ ratings and grades for The Southern Company and Evergy, Inc.:
Rating Comparison
The Southern Company Rating
- Rating: B- with a Very Favorable status
- Discounted Cash Flow Score: 3, assessed as Moderate
- ROE Score: 4, rated as Favorable
- ROA Score: 3, rated as Moderate
- Debt To Equity Score: 1, rated as Very Unfavorable
- Overall Score: 3, rated as Moderate
Evergy, Inc. Rating
- Rating: B- with a Very Favorable status
- Discounted Cash Flow Score: 1, assessed as Very Unfavorable
- ROE Score: 3, rated as Moderate
- ROA Score: 3, rated as Moderate
- Debt To Equity Score: 2, rated as Moderate
- Overall Score: 2, rated as Moderate
Which one is the best rated?
Based strictly on the provided data, The Southern Company has higher scores in discounted cash flow, return on equity, and overall score, while Evergy, Inc. shows a better debt-to-equity score. Overall, Southern Company is better rated.
Scores Comparison
Here is the comparison of the Altman Z-Score and Piotroski Score for The Southern Company and Evergy, Inc.:
The Southern Company Scores
- Altman Z-Score: 0.98, indicating financial distress and high bankruptcy risk.
- Piotroski Score: 6, reflecting average financial strength.
Evergy, Inc. Scores
- Altman Z-Score: 0.82, indicating financial distress and high bankruptcy risk.
- Piotroski Score: 5, reflecting average financial strength.
Which company has the best scores?
Both companies are in the distress zone for Altman Z-Score, signaling high bankruptcy risk. The Southern Company has a slightly higher Piotroski Score (6 vs. 5), indicating marginally stronger financial health based on available data.
Grades Comparison
The following presents the latest reliable grades assigned by recognized financial institutions for The Southern Company and Evergy, Inc.:
The Southern Company Grades
This table shows recent grade updates from major grading companies for The Southern Company.
| Grading Company | Action | New Grade | Date |
|---|---|---|---|
| UBS | Maintain | Neutral | 2025-12-17 |
| JP Morgan | Maintain | Neutral | 2025-12-15 |
| Jefferies | Maintain | Neutral | 2025-12-15 |
| RBC Capital | Maintain | Sector Perform | 2025-12-12 |
| Keybanc | Maintain | Underweight | 2025-12-12 |
| Mizuho | Maintain | Neutral | 2025-12-11 |
| Barclays | Maintain | Equal Weight | 2025-11-20 |
| Jefferies | Downgrade | Neutral | 2025-11-05 |
| Ladenburg Thalmann | Downgrade | Neutral | 2025-10-17 |
| Keybanc | Maintain | Underweight | 2025-10-15 |
The Southern Company’s grades primarily indicate a neutral or cautious stance, with several maintain actions and a recent downgrade from buy ratings to neutral.
Evergy, Inc. Grades
This table presents recent grade updates from recognized grading companies for Evergy, Inc.
| Grading Company | Action | New Grade | Date |
|---|---|---|---|
| Mizuho | Downgrade | Neutral | 2025-12-18 |
| UBS | Maintain | Buy | 2025-12-17 |
| Citigroup | Maintain | Buy | 2025-11-10 |
| Jefferies | Maintain | Buy | 2025-10-09 |
| Mizuho | Maintain | Outperform | 2025-08-08 |
| Mizuho | Maintain | Outperform | 2025-07-18 |
| Barclays | Maintain | Overweight | 2025-05-30 |
| Citigroup | Maintain | Buy | 2025-05-16 |
| UBS | Upgrade | Buy | 2025-04-28 |
| Barclays | Maintain | Overweight | 2025-04-22 |
Evergy’s grades mostly favor a buy or outperform rating, with consistent maintain actions and only a recent downgrade from outperform to neutral by Mizuho.
Which company has the best grades?
Evergy, Inc. has received consistently higher grades, with multiple buy and outperform ratings compared to The Southern Company’s predominantly neutral and underweight grades. This suggests potentially stronger market confidence in Evergy’s outlook, which could influence investor sentiment and portfolio decisions accordingly.
Strengths and Weaknesses
Below is a comparison table summarizing the key strengths and weaknesses of The Southern Company (SO) and Evergy, Inc. (EVRG) based on their latest financial and operational data.
| Criterion | The Southern Company (SO) | Evergy, Inc. (EVRG) |
|---|---|---|
| Diversification | Moderate: Mainly electric utilities and gas segments, with Gas Distribution Operations at $3.9B and Southern Company Gas at $4.46B | Limited: Primarily focused on Electric Utility Segment with $2.7B revenue |
| Profitability | Moderate: Net margin favorable at 16.47%, ROIC 4.25% (unfavorable vs WACC 4.96%) | Moderate: Net margin favorable at 15.0%, ROIC 4.52% (unfavorable vs WACC 5.36%) |
| Innovation | Slightly Unfavorable moat status; growing ROIC trend suggests improving efficiency | Slightly Unfavorable moat status; growing ROIC trend indicates improving profitability |
| Global presence | Primarily regional U.S. presence; no significant global footprint | Primarily regional U.S. presence; limited geographic diversification |
| Market Share | Strong local market share in electric utilities and gas distribution | Moderate local market share, focused on electric utilities |
Key takeaways: Both companies operate mainly in regional utility markets with similar profitability profiles and slightly unfavorable economic moats. Southern Company has a more diversified revenue base in gas operations, while Evergy’s focus is on electric utilities. Both show improving ROIC trends, indicating potential for enhanced value creation despite current challenges.
Risk Analysis
Below is a comparative table outlining key risks for The Southern Company (SO) and Evergy, Inc. (EVRG) based on the most recent 2024 data and contextual company profiles.
| Metric | The Southern Company (SO) | Evergy, Inc. (EVRG) |
|---|---|---|
| Market Risk | Low beta (0.447) indicates lower volatility but sensitive to regulated utility market shifts | Moderate beta (0.646) with some sensitivity to market fluctuations |
| Debt Level | High debt-to-equity ratio (2.0), interest coverage moderate (2.91x), Altman Z-score in distress zone (0.98) | High debt-to-equity (1.41), interest coverage 2.61x, Altman Z-score also in distress zone (0.82) |
| Regulatory Risk | Significant exposure due to operations in multiple states with evolving energy policies | Similar regulatory exposure focused on Kansas and Missouri with renewable energy mandates |
| Operational Risk | Large asset base with diverse generation mix; some unfavorable asset turnover ratios | Smaller scale but complex transmission and distribution network; also unfavorable asset turnover |
| Environmental Risk | Ongoing transition to renewables but fossil fuel assets remain substantial | Growing renewable portfolio but still reliant on fossil fuels, potential carbon regulation impacts |
| Geopolitical Risk | Mostly domestic U.S. operations, limited direct geopolitical risk | Same domestic focus, limited exposure to geopolitical conflicts |
The most impactful and likely risks for both companies center on their high debt levels combined with moderate interest coverage, placing them in the financial distress zone per Altman Z-scores. Regulatory shifts toward cleaner energy and operational efficiency improvements will heavily influence future performance. Investors should monitor debt management and policy changes closely.
Which Stock to Choose?
The Southern Company (SO) shows a favorable income evolution with a 31.16% revenue growth over 2020-2024 and a strong net margin of 16.47%. Its financial ratios are slightly unfavorable overall, with notable debt concerns and a low current ratio, while profitability is moderate and its rating is very favorable (B-).
Evergy, Inc. (EVRG) also displays favorable income growth, with 18.53% revenue growth and a 15.0% net margin. Its financial ratios are slightly unfavorable, mainly due to leverage and liquidity metrics, but it benefits from a better price-to-book ratio and a very favorable rating (B-), although profitability is somewhat lower than SO’s.
Investors focused on growth might find Evergy’s stronger recent stock appreciation and improving profitability appealing, while those prioritizing stable income and higher net margins could lean toward The Southern Company. Both companies show signs of value destruction despite growing ROIC, suggesting cautious interpretation based on individual risk tolerance.
Disclaimer: Investment carries a risk of loss of initial capital. The past performance is not a reliable indicator of future results. Be sure to understand risks before making an investment decision.
Go Further
I encourage you to read the complete analyses of The Southern Company and Evergy, Inc. to enhance your investment decisions: