In the competitive regulated electric utility sector, PPL Corporation and Evergy, Inc. stand out as prominent players delivering essential energy services across different U.S. regions. Both companies emphasize a blend of traditional and renewable energy sources, reflecting their innovation strategies amid evolving market demands. This article will dissect their strengths and risks, guiding you to identify which company presents the most compelling investment opportunity in 2026.
Table of contents
Companies Overview
I will begin the comparison between PPL Corporation and Evergy, Inc. by providing an overview of these two companies and their main differences.
PPL Overview
PPL Corporation is a utility holding company delivering electricity and natural gas in the United States and the United Kingdom. It operates primarily through its Kentucky and Pennsylvania regulated segments, serving over 1.2M electric and natural gas customers. Founded in 1920 and headquartered in Allentown, PA, PPL generates electricity from coal, gas, hydro, and solar sources, positioning itself as a diversified energy provider within regulated markets.
Evergy Overview
Evergy, Inc. engages in the generation, transmission, distribution, and sale of electricity in Kansas and Missouri. The company serves around 1.6M customers and operates extensive transmission and distribution networks. Established in 2017 and based in Kansas City, MO, Evergy generates power from coal, hydroelectric, landfill gas, uranium, natural gas, oil, solar, wind, and other renewables, reflecting a broad portfolio in regulated electric utilities.
Key similarities and differences
Both PPL and Evergy operate in the regulated electric utility industry within the US, providing electricity to residential, commercial, and industrial customers. Each company employs diverse energy generation methods, including renewables, coal, and gas. However, PPL also supplies natural gas and has operations in the UK, while Evergy focuses solely on electric utility services in Kansas and Missouri, maintaining a larger transmission and distribution network despite its younger corporate history.
Income Statement Comparison
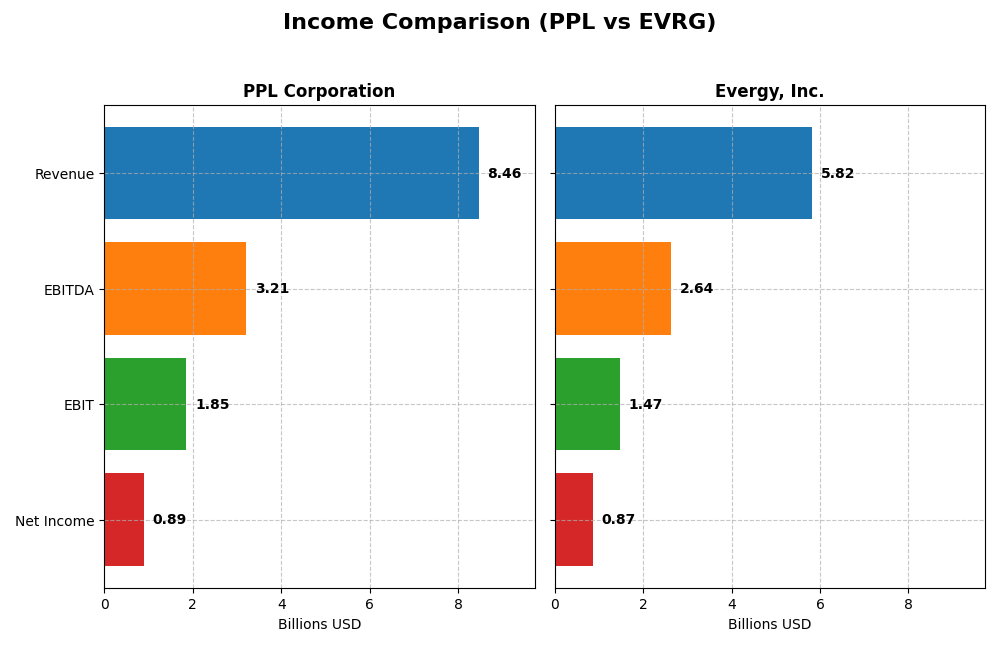
The table below compares the key financial metrics from the most recent fiscal year for PPL Corporation and Evergy, Inc., providing a snapshot of their income statements.
| Metric | PPL Corporation | Evergy, Inc. |
|---|---|---|
| Market Cap | 25.6B | 16.8B |
| Revenue | 8.46B | 5.82B |
| EBITDA | 3.21B | 2.64B |
| EBIT | 1.85B | 1.47B |
| Net Income | 888M | 874M |
| EPS | 1.20 | 3.79 |
| Fiscal Year | 2024 | 2024 |
Income Statement Interpretations
PPL Corporation
PPL Corporation’s revenue increased steadily from 5.47B in 2020 to 8.46B in 2024, showing a 54.6% growth over the period, though net income declined overall by 39.6%. Gross and EBIT margins remained favorable, with the 2024 net margin improving by 17.9% despite a slight slowdown in revenue growth to 1.8%. EPS grew 20% in 2024, highlighting margin and profitability improvements.
Evergy, Inc.
Evergy, Inc. demonstrated consistent revenue growth from 4.91B in 2020 to 5.82B in 2024, an 18.5% increase, alongside a 41.3% rise in net income. Margins improved, with gross margin at 32.6% and net margin at 15% in 2024. The company’s 2024 revenue grew moderately by 6.2%, with favorable EBIT and EPS growth rates of 15.2% and 19.6%, respectively, indicating solid operational performance.
Which one has the stronger fundamentals?
Both companies present favorable income statements, but Evergy exhibits more consistent net income and margin growth over the period, with fewer unfavorable signals. PPL shows stronger revenue growth but weaker net income trends and margin declines overall. Evergy’s higher proportion of positive growth indicators suggests relatively stronger fundamentals based on income statement metrics.
Financial Ratios Comparison
The table below presents key financial ratios for PPL Corporation and Evergy, Inc. based on their most recent fiscal year data ending December 31, 2024.
| Ratios | PPL Corporation | Evergy, Inc. |
|---|---|---|
| ROE | 6.31% | 8.77% |
| ROIC | 3.59% | 4.52% |
| P/E | 27.0 | 16.2 |
| P/B | 1.70 | 1.42 |
| Current Ratio | 0.86 | 0.50 |
| Quick Ratio | 0.71 | 0.27 |
| D/E (Debt to Equity) | 1.19 | 1.41 |
| Debt-to-Assets | 41.0% | 43.6% |
| Interest Coverage | 2.36 | 2.57 |
| Asset Turnover | 0.21 | 0.18 |
| Fixed Asset Turnover | 0.26 | 0.23 |
| Payout Ratio | 84.1% | 68.3% |
| Dividend yield | 3.12% | 4.21% |
Interpretation of the Ratios
PPL Corporation
PPL Corporation’s financial ratios present a mixed picture with a strong net margin of 10.49% and a favorable dividend yield of 3.12%. However, several key metrics such as return on equity (6.31%), return on invested capital (3.59%), and liquidity ratios are unfavorable, indicating potential concerns around profitability efficiency and short-term financial health. The company pays dividends, but the payout sustainability should be monitored due to limited free cash flow coverage.
Evergy, Inc.
Evergy, Inc. shows a more favorable net margin at 15.0% and a higher dividend yield of 4.21%, reflecting good profitability and shareholder returns. Nevertheless, return on equity (8.77%) and return on invested capital (4.52%) remain unfavorable, signaling room for improvement in capital efficiency. Liquidity ratios are weak, and debt levels are relatively high. The company maintains dividend payments, but free cash flow coverage calls for attention.
Which one has the best ratios?
Evergy, Inc. holds a slight edge with a higher net margin, better dividend yield, and more favorable price-to-book ratio, indicating stronger profitability and valuation metrics. However, both companies face weaknesses in liquidity and capital efficiency ratios. PPL’s higher payout risk and weaker returns contrast with Evergy’s slightly better overall ratio profile, resulting in a nuanced comparison without a clear superior.
Strategic Positioning
This section compares the strategic positioning of PPL Corporation and Evergy, Inc., including market position, key segments, and exposure to technological disruption:
PPL Corporation
- Operates in regulated electric markets in US and UK with moderate competitive pressure.
- Revenue driven by Kentucky, Pennsylvania, and Rhode Island regulated segments.
- Generates electricity from coal, gas, hydro, and solar sources, showing some diversification.
Evergy, Inc.
- Focuses on regulated electric markets in Kansas and Missouri with stable competition.
- Primarily from a single electric utility segment serving 1.6M customers.
- Uses coal, hydro, landfill gas, uranium, natural gas, solar, wind, and other renewables.
PPL Corporation vs Evergy, Inc. Positioning
PPL shows a geographically diversified regulatory footprint across multiple states and the UK, while Evergy concentrates on two US states with a broad mix of generation sources. PPL’s multi-segment approach contrasts with Evergy’s single-segment focus, reflecting varied strategic scopes.
Which has the best competitive advantage?
Both companies currently shed value with ROIC below WACC but show improving profitability trends. Their slightly unfavorable moat status suggests limited but growing competitive advantages, with neither exhibiting a clear superior economic moat.
Stock Comparison
The stock price movements of PPL Corporation and Evergy, Inc. over the past year reveal distinct bullish trends with decelerating momentum, marked by significant gains and recent short-term declines in both securities.

Trend Analysis
PPL Corporation exhibited a bullish trend with a 29.84% price increase over the past 12 months, despite a recent 7.39% decline and decelerating momentum; volatility was moderate with a 3.24 standard deviation.
Evergy, Inc. showed a stronger bullish trend, gaining 45.55% over the last year, also with deceleration and higher volatility at a 7.94 standard deviation; recent losses reached 6.59%, reflecting short-term weakness.
Comparing both, Evergy, Inc. outperformed PPL Corporation in market performance with the highest total price appreciation during the analyzed period.
Target Prices
Analysts provide a clear consensus on target prices for both PPL Corporation and Evergy, Inc.
| Company | Target High | Target Low | Consensus |
|---|---|---|---|
| PPL Corporation | 45 | 36 | 41.29 |
| Evergy, Inc. | 93 | 76 | 82.67 |
The consensus target prices suggest upside potential for both stocks compared to current prices: PPL trades at $34.59, well below its $41.29 consensus, and Evergy at $72.82 versus an $82.67 consensus. This reflects positive analyst expectations for utility sector growth.
Analyst Opinions Comparison
This section compares analysts’ ratings and grades for PPL Corporation and Evergy, Inc.:
Rating Comparison
PPL Rating
- Rating: C+ indicating a very favorable status overall.
- Discounted Cash Flow Score: 1, rated very unfavorable for both companies.
- ROE Score: 3, showing moderate efficiency in generating profit from equity.
- ROA Score: 3, reflecting moderate effectiveness in utilizing assets to generate earnings.
- Debt To Equity Score: 2, indicating moderate financial risk with balanced debt levels.
- Overall Score: 2, reflecting a moderate summary assessment of financial standing.
EVRG Rating
- Rating: B- indicating a very favorable status overall.
- Discounted Cash Flow Score: 1, rated very unfavorable for both companies.
- ROE Score: 3, showing moderate efficiency in generating profit from equity.
- ROA Score: 3, reflecting moderate effectiveness in utilizing assets to generate earnings.
- Debt To Equity Score: 2, indicating moderate financial risk with balanced debt levels.
- Overall Score: 2, reflecting a moderate summary assessment of financial standing.
Which one is the best rated?
Based strictly on the provided data, Evergy (EVRG) holds a higher rating of B- compared to PPL’s C+, although both share identical scores for DCF, ROE, ROA, debt-to-equity, and overall financial standing.
Scores Comparison
Here is a comparison of the Altman Z-Score and Piotroski Score for PPL Corporation and Evergy, Inc.:
PPL Scores
- Altman Z-Score: 0.97, distress zone indicating high bankruptcy risk.
- Piotroski Score: 6, average financial strength and value.
EVRG Scores
- Altman Z-Score: 0.82, distress zone indicating high bankruptcy risk.
- Piotroski Score: 5, average financial strength and value.
Which company has the best scores?
Both PPL and Evergy are in the distress zone for Altman Z-Score, signaling elevated bankruptcy risk. PPL has a slightly higher Piotroski Score (6 vs. 5), indicating marginally stronger financial health based on available data.
Grades Comparison
Here is a comparison of the recent grades assigned to PPL Corporation and Evergy, Inc.:
PPL Corporation Grades
The following table summarizes the recent grades assigned to PPL Corporation by reputable grading companies:
| Grading Company | Action | New Grade | Date |
|---|---|---|---|
| UBS | Maintain | Neutral | 2025-12-17 |
| Wells Fargo | Maintain | Overweight | 2025-12-12 |
| JP Morgan | Maintain | Overweight | 2025-12-11 |
| BMO Capital | Maintain | Outperform | 2025-10-21 |
| B of A Securities | Maintain | Buy | 2025-10-16 |
| Barclays | Maintain | Equal Weight | 2025-10-14 |
| UBS | Maintain | Neutral | 2025-10-10 |
| Morgan Stanley | Maintain | Overweight | 2025-09-25 |
| Barclays | Maintain | Equal Weight | 2025-07-01 |
| Morgan Stanley | Maintain | Overweight | 2025-06-18 |
Overall, PPL Corporation’s grades consistently show a positive trend with multiple “Overweight,” “Buy,” and “Outperform” ratings and no downgrades.
Evergy, Inc. Grades
The following table summarizes the recent grades assigned to Evergy, Inc. by recognized grading companies:
| Grading Company | Action | New Grade | Date |
|---|---|---|---|
| Mizuho | Downgrade | Neutral | 2025-12-18 |
| UBS | Maintain | Buy | 2025-12-17 |
| Citigroup | Maintain | Buy | 2025-11-10 |
| Jefferies | Maintain | Buy | 2025-10-09 |
| Mizuho | Maintain | Outperform | 2025-08-08 |
| Mizuho | Maintain | Outperform | 2025-07-18 |
| Barclays | Maintain | Overweight | 2025-05-30 |
| Citigroup | Maintain | Buy | 2025-05-16 |
| UBS | Upgrade | Buy | 2025-04-28 |
| Barclays | Maintain | Overweight | 2025-04-22 |
Evergy, Inc. shows a generally positive rating trend with several “Buy” and “Outperform” grades but includes a recent downgrade from “Outperform” to “Neutral” by Mizuho.
Which company has the best grades?
PPL Corporation exhibits a more stable and consistently positive grading trend with no recent downgrades, while Evergy, Inc. has a mixed pattern including a notable recent downgrade. This suggests PPL’s outlook is viewed with slightly more confidence, which may influence investor sentiment toward steadier expectations.
Strengths and Weaknesses
Below is a comparison of key strengths and weaknesses for PPL Corporation and Evergy, Inc. based on recent financial data and market positioning.
| Criterion | PPL Corporation | Evergy, Inc. |
|---|---|---|
| Diversification | Moderate regional focus with strong regulated segments in Kentucky, Pennsylvania, Rhode Island | Concentrated in electric utility segment, less diversified geographically |
| Profitability | Net margin 10.5% (favorable), ROIC 3.6% (unfavorable), slightly unfavorable ROIC vs WACC | Higher net margin 15.0% (favorable), ROIC 4.5% (unfavorable), slightly unfavorable ROIC vs WACC |
| Innovation | Limited public data on innovation initiatives; focus on regulated utilities | Similar limited innovation focus, prioritizing stable utility operations |
| Global presence | Primarily US-focused with a past UK presence divested | Operates mainly in the US Midwest region |
| Market Share | Strong presence in regulated markets, steady revenue growth in key states | Solid market share in its territory with steady revenue growth |
Key takeaways: Both companies operate in regulated utility sectors with stable revenues but limited diversification and innovation. Evergy shows slightly better profitability margins. However, both are currently shedding value as ROIC remains below WACC despite improving trends, indicating cautious investment consideration.
Risk Analysis
Below is a comparative table outlining the key risks associated with PPL Corporation and Evergy, Inc. as of 2024:
| Metric | PPL Corporation | Evergy, Inc. |
|---|---|---|
| Market Risk | Moderate (Beta 0.716) | Moderate (Beta 0.646) |
| Debt Level | High (D/E 1.19, Neutral debt-to-assets 41%) | High (D/E 1.41, Neutral debt-to-assets 44%) |
| Regulatory Risk | Elevated (Utility sector, US/UK regulations) | Elevated (Utility sector, US regulations) |
| Operational Risk | Moderate (Aging assets, low asset turnover) | Moderate (Aging assets, low asset turnover) |
| Environmental Risk | Moderate (Coal and gas generation exposure) | Moderate (Coal, gas, nuclear, and renewables mix) |
| Geopolitical Risk | Low (US/UK focus) | Low (US focus) |
Both companies face significant market and regulatory risks typical of regulated electric utilities. Debt levels are relatively high for both, raising financial risk, compounded by low liquidity ratios and low Altman Z-Scores indicating financial distress risk. Environmental risks stem from continued reliance on fossil fuels, although Evergy’s more diversified generation mix offers some mitigation. Operational risks are linked to asset efficiency challenges. Geopolitical risks remain low given their domestic and UK market focus. Investors should weigh these risks carefully alongside dividend yields and sector stability.
Which Stock to Choose?
PPL Corporation shows a mixed income evolution with favorable margins but overall declining net income and EPS over 2020-2024. Its financial ratios reveal more unfavorable than favorable metrics, with a high net debt to EBITDA and moderate profitability. The company is rated C+ with moderate overall scores but in a distress zone for bankruptcy risk.
Evergy, Inc. reports a more consistent income growth with favorable margins and positive net income and EPS growth over the period. Its financial ratios are slightly more balanced, with a larger share of favorable indicators including a better price-to-book ratio but also a distress zone Altman Z-score. The company holds a B- rating with moderate overall scores.
For investors, Evergy might appear more favorable for those seeking growth and stronger income trends, while PPL could be interpreted as more suitable for investors focusing on dividend yield despite its weaker ratio profile. Both show signs of value destruction but improving profitability, suggesting caution for risk-averse profiles.
Disclaimer: Investment carries a risk of loss of initial capital. The past performance is not a reliable indicator of future results. Be sure to understand risks before making an investment decision.
Go Further
I encourage you to read the complete analyses of PPL Corporation and Evergy, Inc. to enhance your investment decisions: