In the evolving landscape of regulated electric utilities, Evergy, Inc. (EVRG) and Pinnacle West Capital Corporation (PNW) stand out as prominent players with strong regional footholds. Both companies focus on electricity generation, transmission, and distribution, serving over a million customers each while incorporating renewable energy sources into their portfolios. Comparing their market strategies and innovation efforts offers valuable insight. Join me as we explore which company presents the most compelling investment opportunity today.
Table of contents
Companies Overview
I will begin the comparison between Evergy and Pinnacle West by providing an overview of these two companies and their main differences.
Evergy Overview
Evergy, Inc. is a regulated electric utility operating primarily in Kansas and Missouri. It focuses on electricity generation, transmission, distribution, and sales using diverse energy sources including coal, hydroelectric, landfill gas, uranium, natural gas, oil, solar, wind, and other renewables. The company serves about 1.62M customers and maintains extensive transmission and distribution networks, positioning itself as a significant regional energy provider.
Pinnacle West Overview
Pinnacle West Capital Corporation, through its subsidiary Arizona Public Service, delivers retail and wholesale electric services mainly in Arizona. Its operations cover generation, transmission, and distribution using coal, nuclear, gas, oil, and solar energy. Pinnacle West serves approximately 1.3M customers and manages a large infrastructure of overhead and underground lines, substations, and a regulated generation capacity of around 6,323 MW, emphasizing its strong foothold in the southwestern U.S. market.
Key similarities and differences
Both Evergy and Pinnacle West are regulated electric utilities focused on generation, transmission, and distribution of electricity using a mix of traditional and renewable energy sources. They serve over one million customers each and operate extensive infrastructure networks. However, Evergy’s operations span Kansas and Missouri with a broader mix of energy sources, while Pinnacle West is concentrated in Arizona with a notable emphasis on nuclear power and a larger employee base. Their market caps and scale of operations also differ, reflecting regional market sizes.
Income Statement Comparison
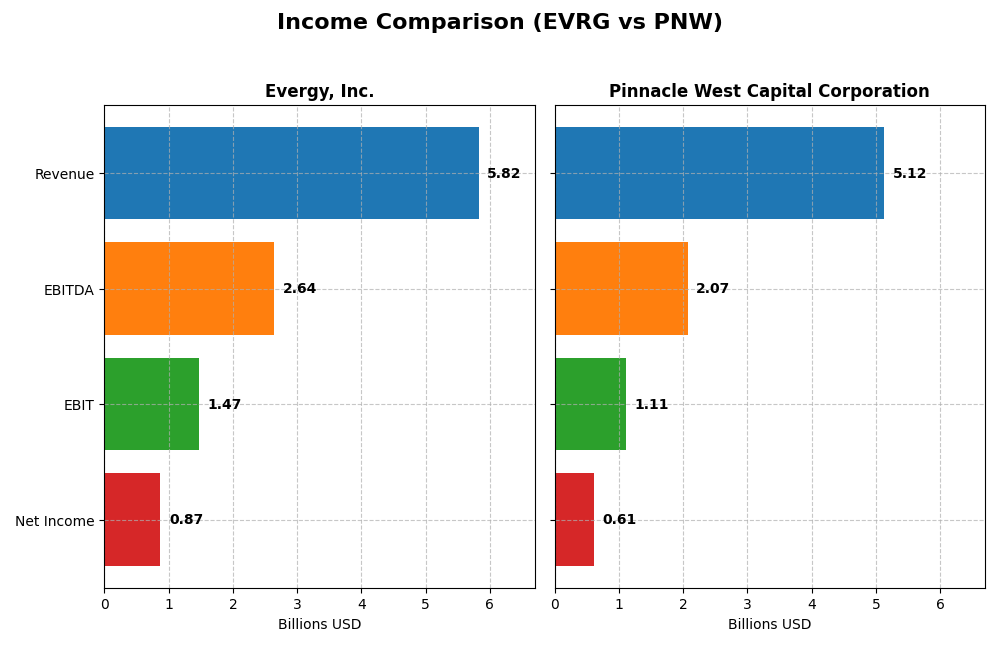
This table compares the key income statement metrics for Evergy, Inc. and Pinnacle West Capital Corporation for the fiscal year 2024, providing a snapshot of their financial performance.
| Metric | Evergy, Inc. (EVRG) | Pinnacle West Capital Corporation (PNW) |
|---|---|---|
| Market Cap | 16.8B | 10.7B |
| Revenue | 5.82B | 5.12B |
| EBITDA | 2.64B | 2.07B |
| EBIT | 1.47B | 1.11B |
| Net Income | 873.5M | 608.8M |
| EPS | 3.79 | 5.35 |
| Fiscal Year | 2024 | 2024 |
Income Statement Interpretations
Evergy, Inc.
Evergy’s revenue rose by 18.53% from 2020 to 2024, with net income increasing 41.27% over the same period, signaling robust growth. Margins improved notably, with a gross margin of 32.57% and a net margin reaching 15.0%, both marked as favorable. In 2024, growth momentum remained positive, with a 6.17% revenue increase and a 12.5% net margin expansion, supported by a 19.56% EPS growth.
Pinnacle West Capital Corporation
Pinnacle West saw a 42.88% revenue increase from 2020 to 2024, though net income grew more modestly by 10.58%. Gross margin stood strong at 41.7%, while the net margin was 11.88%, both favorable. The latest year showed a 9.13% revenue growth and an 11.22% rise in net margin, despite a notable 22.6% decline in net margin growth over the full period, indicating some margin pressure.
Which one has the stronger fundamentals?
Both companies exhibit favorable income statement evaluations with solid growth and margins. Evergy shows stronger net income growth and margin improvements over the period, while Pinnacle West leads in gross margin but struggles with long-term net margin decline. Evergy’s consistent margin enhancements and higher net income growth suggest more resilient fundamentals compared to Pinnacle West’s mixed margin trends.
Financial Ratios Comparison
The table below presents key financial ratios for Evergy, Inc. and Pinnacle West Capital Corporation based on their most recent fiscal year data, allowing for a clear side-by-side comparison.
| Ratios | Evergy, Inc. (EVRG) | Pinnacle West Capital Corporation (PNW) |
|---|---|---|
| ROE | 8.8% | 9.0% |
| ROIC | 4.5% | 3.5% |
| P/E | 16.2 | 15.9 |
| P/B | 1.42 | 1.43 |
| Current Ratio | 0.50 | 0.59 |
| Quick Ratio | 0.27 | 0.42 |
| D/E | 1.41 | 1.64 |
| Debt-to-Assets | 43.6% | 42.3% |
| Interest Coverage | 2.57 | 2.68 |
| Asset Turnover | 0.18 | 0.20 |
| Fixed Asset Turnover | 0.23 | 0.25 |
| Payout ratio | 68.3% | 64.8% |
| Dividend yield | 4.21% | 4.09% |
Interpretation of the Ratios
Evergy, Inc.
Evergy shows strong net margin (15%) and favorable WACC and PB ratios, but it faces concerns with low ROE (8.77%), ROIC (4.52%), and liquidity ratios (current ratio 0.5, quick ratio 0.27). Debt levels and asset turnover are also unfavorable. The company offers a dividend yield of 4.21%, indicating a consistent shareholder return with manageable payout risks.
Pinnacle West Capital Corporation
Pinnacle West exhibits a favorable net margin (11.88%), WACC, and PB ratio, yet it also struggles with low ROE (9.01%), ROIC (3.48%), and liquidity (current ratio 0.59, quick ratio 0.42). Debt levels and asset turnover remain concerns. The dividend yield at 4.09% reflects steady returns, supported by reasonable payout sustainability in line with industry peers.
Which one has the best ratios?
Both Evergy and Pinnacle West present a mix of favorable and unfavorable ratios, each scoring 28.57% favorable and 50% unfavorable ratios, resulting in a slightly unfavorable overall assessment. Their dividend yields are comparable, and both face challenges in profitability and liquidity metrics, suggesting no clear superiority in ratio strength between the two.
Strategic Positioning
This section compares the strategic positioning of Evergy, Inc. and Pinnacle West Capital Corporation, focusing on market position, key segments, and exposure to disruption:
Evergy, Inc.
- Larger market cap of 16.8B, serving 1.62M customers, facing moderate competitive pressure in regulated electric markets.
- Primarily focused on electric utility segment with revenues around 2.7B; diversified generation sources including renewables and fossil fuels.
- Exposure includes traditional and renewable generation but no explicit mention of advanced technological disruption risks.
Pinnacle West Capital Corporation
- Smaller market cap of 10.7B, serving 1.3M customers, competing mainly in Arizona’s regulated electric market.
- Revenue diversified across electric service, transmission, and wholesale energy, totaling around 2.7B in latest fiscal year.
- Similar exposure to coal, nuclear, gas, oil, and solar generation; no specific technological disruption highlighted.
Evergy, Inc. vs Pinnacle West Capital Corporation Positioning
Evergy shows a broader geographic and customer base with a focus on multiple renewable sources, while Pinnacle West has a more concentrated market in Arizona with diversified revenue streams. Evergy’s larger infrastructure contrasts with Pinnacle West’s focused regional operations.
Which has the best competitive advantage?
Both companies are shedding value relative to their cost of capital. Evergy exhibits improving profitability trends, whereas Pinnacle West faces declining profitability, indicating Evergy holds a slightly stronger competitive advantage based on current MOAT evaluation.
Stock Comparison
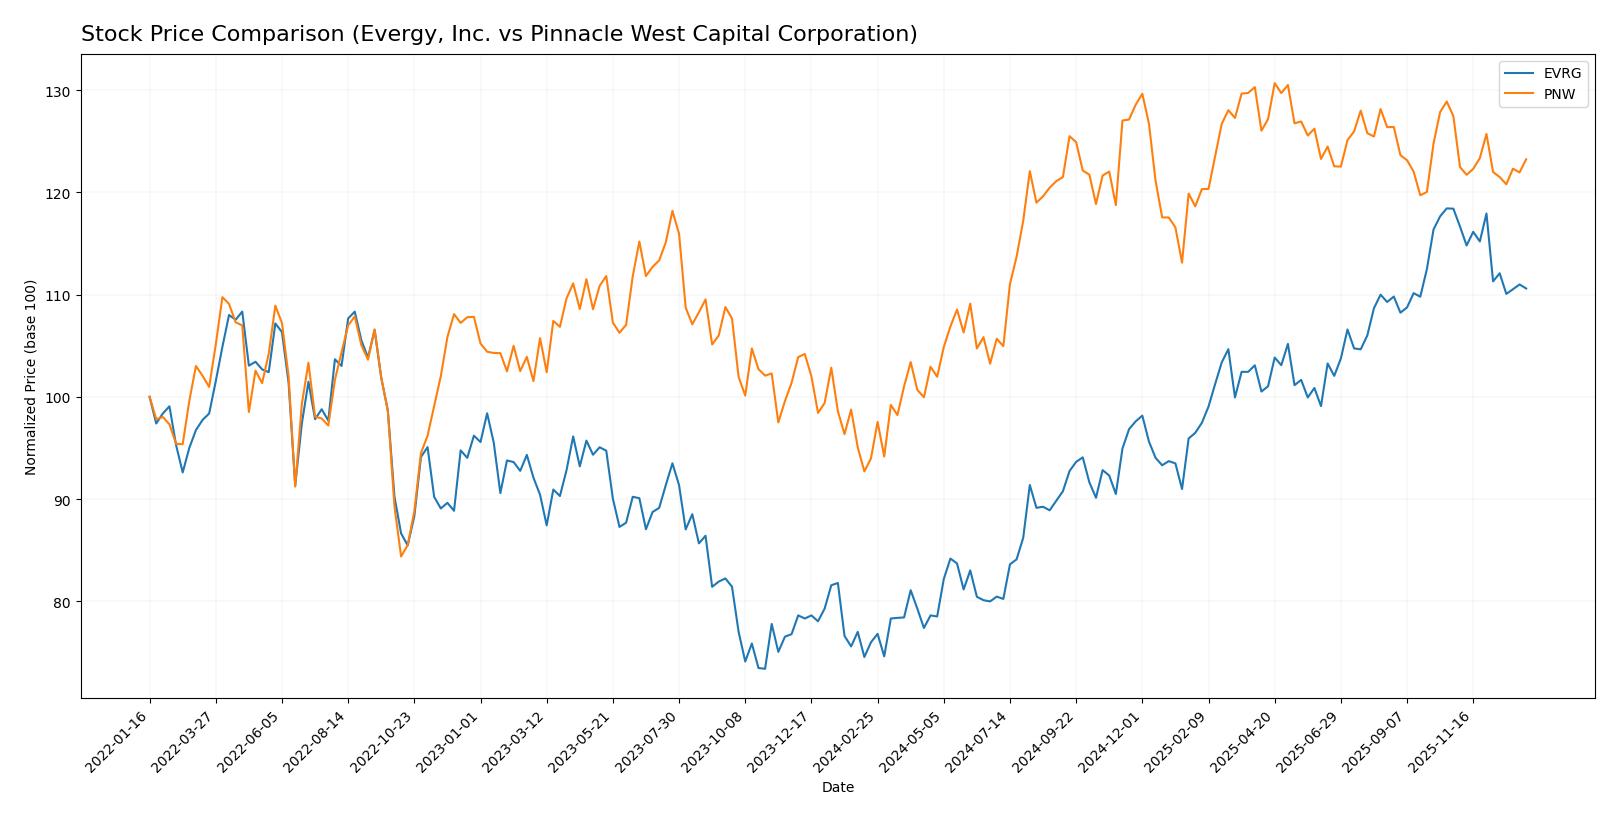
The stock price chart highlights significant bullish trends for both Evergy, Inc. and Pinnacle West Capital Corporation over the past 12 months, with recent deceleration and slight downward movements in the last quarter.
Trend Analysis
Evergy, Inc. (EVRG) showed a strong bullish trend over the past 12 months with a 45.55% price increase, though this momentum has decelerated recently, showing a 6.59% decline from late October 2025 to mid-January 2026.
Pinnacle West Capital Corporation (PNW) also experienced a bullish trend with a 31.14% gain over the past year, but like EVRG, its recent trend indicates a modest 3.31% decrease and decelerating momentum.
Comparatively, EVRG delivered the highest market performance over the past year, outperforming PNW by over 14 percentage points despite both stocks showing recent short-term declines.
Target Prices
Analysts provide a cautiously optimistic target consensus for Evergy, Inc. and Pinnacle West Capital Corporation.
| Company | Target High | Target Low | Consensus |
|---|---|---|---|
| Evergy, Inc. | 93 | 76 | 82.67 |
| Pinnacle West Capital Corporation | 115 | 85 | 96.33 |
The consensus targets for Evergy and Pinnacle West suggest upside potential of approximately 13.5% and 8.2%, respectively, compared to their current prices of $72.82 and $89.07. This indicates moderate growth expectations from analysts relative to market prices.
Analyst Opinions Comparison
This section compares analysts’ ratings and grades for Evergy, Inc. and Pinnacle West Capital Corporation:
Rating Comparison
EVRG Rating
- Rated B- with a very favorable overall rating status.
- Discounted Cash Flow Score is 1, indicating very unfavorable valuation.
- Return on Equity Score is 3, reflecting moderate efficiency generating profit.
- Return on Assets Score is 3, showing moderate asset utilization.
- Debt To Equity Score is 2, indicating moderate financial risk.
- Overall Score is 2, which is moderate.
PNW Rating
- Rated C+ with a very favorable overall rating status.
- Discounted Cash Flow Score is 1, also very unfavorable.
- Return on Equity Score is 3, reflecting moderate efficiency generating profit.
- Return on Assets Score is 3, showing moderate asset utilization.
- Debt To Equity Score is 1, indicating very unfavorable financial risk.
- Overall Score is 2, which is moderate.
Which one is the best rated?
Evergy, Inc. holds a higher rating of B- compared to Pinnacle West Capital’s C+, although both share an overall moderate score of 2. Evergy’s debt-to-equity score is stronger, suggesting relatively lower financial risk.
Scores Comparison
Here is a comparison of the Altman Z-Score and Piotroski Score for Evergy and Pinnacle West:
Evergy Scores
- Altman Z-Score: 0.82, in distress zone, high bankruptcy risk
- Piotroski Score: 5, average financial strength
Pinnacle West Scores
- Altman Z-Score: 0.73, in distress zone, high bankruptcy risk
- Piotroski Score: 4, average financial strength
Which company has the best scores?
Evergy shows a slightly higher Altman Z-Score and Piotroski Score than Pinnacle West, though both remain in the distress zone and average range respectively. Neither company demonstrates strong financial health based on these scores.
Grades Comparison
Here is a comparison of the latest grades from reputable grading companies for Evergy, Inc. and Pinnacle West Capital Corporation:
Evergy, Inc. Grades
This table presents recent grades and rating actions from established financial institutions for Evergy, Inc.:
| Grading Company | Action | New Grade | Date |
|---|---|---|---|
| Mizuho | Downgrade | Neutral | 2025-12-18 |
| UBS | Maintain | Buy | 2025-12-17 |
| Citigroup | Maintain | Buy | 2025-11-10 |
| Jefferies | Maintain | Buy | 2025-10-09 |
| Mizuho | Maintain | Outperform | 2025-08-08 |
| Mizuho | Maintain | Outperform | 2025-07-18 |
| Barclays | Maintain | Overweight | 2025-05-30 |
| Citigroup | Maintain | Buy | 2025-05-16 |
| UBS | Upgrade | Buy | 2025-04-28 |
| Barclays | Maintain | Overweight | 2025-04-22 |
Evergy’s grades predominantly indicate a buy or outperform stance, with a recent slight downgrade to neutral by Mizuho, reflecting some caution.
Pinnacle West Capital Corporation Grades
This table summarizes recent grades and rating actions for Pinnacle West Capital Corporation from recognized grading firms:
| Grading Company | Action | New Grade | Date |
|---|---|---|---|
| UBS | Maintain | Neutral | 2025-12-17 |
| Keybanc | Downgrade | Sector Weight | 2025-12-12 |
| Keybanc | Maintain | Overweight | 2025-10-15 |
| UBS | Maintain | Neutral | 2025-10-10 |
| Barclays | Maintain | Equal Weight | 2025-10-07 |
| Argus Research | Maintain | Buy | 2025-09-30 |
| Morgan Stanley | Maintain | Equal Weight | 2025-09-25 |
| UBS | Maintain | Neutral | 2025-09-12 |
| Mizuho | Downgrade | Neutral | 2025-09-09 |
| Barclays | Maintain | Equal Weight | 2025-08-13 |
Pinnacle West’s grades mostly range between neutral and equal weight, with fewer buy ratings and recent downgrades indicating a more cautious outlook.
Which company has the best grades?
Evergy, Inc. has received generally more favorable grades, with multiple buy and outperform ratings compared to Pinnacle West’s predominantly neutral and equal weight assessments. This suggests Evergy might be perceived as having better growth or stability prospects, which could influence investor confidence.
Strengths and Weaknesses
Below is a comparison of key strengths and weaknesses for Evergy, Inc. (EVRG) and Pinnacle West Capital Corporation (PNW) based on their latest financial and operational data.
| Criterion | Evergy, Inc. (EVRG) | Pinnacle West Capital Corporation (PNW) |
|---|---|---|
| Diversification | Primarily electric utility segment with limited diversification; stable revenue base around $2.7B (2017) | More segmented: Electric Service, Transmission, Wholesale Energy; total revenue over $2.7B (2024) |
| Profitability | Moderate net margin (15%), but ROIC (4.52%) below WACC (5.36%), indicating value destruction | Net margin 11.9%, ROIC (3.48%) also below WACC (4.68%), with declining profitability trend |
| Innovation | Limited innovation indicators; stable but low asset turnover (0.18) suggests operational inefficiencies | Similar low asset turnover (0.20) and declining ROIC trend; innovation impact appears limited |
| Global presence | Regional utility focus in the US, no significant global footprint | Also a US-focused utility company with no notable international operations |
| Market Share | Strong regional presence but no major expansion noted | Stable regional market share with consistent revenue growth in core segments |
In summary, both companies operate primarily in regional electric utilities with limited diversification and innovation impact. Evergy shows a growing ROIC but still destroys value overall, while Pinnacle West is facing declining profitability. Investors should weigh these factors carefully, considering operational efficiency and market positioning risks.
Risk Analysis
Below is a comparative risk overview for Evergy, Inc. (EVRG) and Pinnacle West Capital Corporation (PNW) based on the most recent 2024 data.
| Metric | Evergy, Inc. (EVRG) | Pinnacle West Capital Corporation (PNW) |
|---|---|---|
| Market Risk | Beta 0.646 (moderate) | Beta 0.543 (moderate) |
| Debt Level | Debt/Equity 1.41 (high) | Debt/Equity 1.64 (very high) |
| Regulatory Risk | High — regulated electric sector | High — regulated electric sector |
| Operational Risk | Moderate — large transmission network | Moderate — extensive infrastructure |
| Environmental Risk | Elevated — coal and fossil fuel reliance | Elevated — coal, nuclear, and fossil fuel use |
| Geopolitical Risk | Low — US-based operations | Low — US-based operations |
Both utilities face significant regulatory and environmental risks due to their energy mix, which includes coal and fossil fuels, exposing them to stricter environmental regulations and transition risks. Pinnacle West’s higher debt ratio (1.64 vs. 1.41) and lower liquidity ratios increase financial risk. Additionally, both companies’ Altman Z-Scores place them in the distress zone, signaling a higher bankruptcy risk that investors should monitor closely. The most impactful risks remain regulatory changes and financial leverage.
Which Stock to Choose?
Evergy, Inc. (EVRG) shows favorable income evolution with 78.57% positive income statement metrics, including strong net margin and EPS growth. Financial ratios are slightly unfavorable overall, with high debt and low liquidity. Its rating is very favorable with a B- grade.
Pinnacle West Capital Corporation (PNW) also has favorable income trends, though with a lower net margin growth and some unfavorable income statement aspects. Its financial ratios mirror EVRG’s slightly unfavorable stance, with higher debt-to-equity concerns. The rating is very favorable, rated C+.
For investors, EVRG might appear more attractive for those seeking growth due to stronger income growth and improving profitability, while PNW could be preferred by those with a focus on stable dividend yield and moderate risk, despite its declining profitability and value destruction signals.
Disclaimer: Investment carries a risk of loss of initial capital. The past performance is not a reliable indicator of future results. Be sure to understand risks before making an investment decision.
Go Further
I encourage you to read the complete analyses of Evergy, Inc. and Pinnacle West Capital Corporation to enhance your investment decisions: