Investors seeking opportunities in the regulated electric utility sector will find Pacific Gas & Electric Co. (PCG) and Evergy, Inc. (EVRG) compelling candidates. Both companies operate in the US, providing essential electricity services with a focus on integrating renewable energy and innovation in grid management. This comparison explores their market positions, growth strategies, and risk profiles to help you decide which utility stock deserves a place in your portfolio. Let’s uncover which company stands out as the smarter investment choice.

Table of contents
Companies Overview
I will begin the comparison between Pacific Gas & Electric Co. and Evergy, Inc. by providing an overview of these two companies and their main differences.
Pacific Gas & Electric Co. Overview
Pacific Gas & Electric Co. operates in the regulated electric industry, serving northern and central California. Founded in 1905, it generates and distributes electricity and natural gas using nuclear, hydroelectric, fossil fuel, and photovoltaic sources. The company also develops advanced microgrid backup power devices, targeting residential, commercial, industrial, and agricultural customers. It is a subsidiary of PG&E Corporation with a market cap of 34.8B USD.
Evergy, Inc. Overview
Evergy, Inc. is a regulated electric utility serving Kansas and Missouri. Established in 2017, it generates power from coal, hydroelectric, landfill gas, uranium, natural gas, oil, solar, wind, and other renewables. The company manages extensive transmission and distribution networks, serving about 1.62M customers across residences, commercial, industrial, and municipal sectors. Evergy’s market cap stands at 16.8B USD.
Key similarities and differences
Both companies operate in the regulated electric utilities sector, focusing on electricity generation, transmission, and distribution across distinct U.S. regions. Pacific Gas & Electric has a longer corporate history and a larger market cap, while Evergy emphasizes a broader renewable energy mix and serves fewer customers. Both serve diverse customer bases, but their geographic footprints and energy source compositions differ notably.
Income Statement Comparison
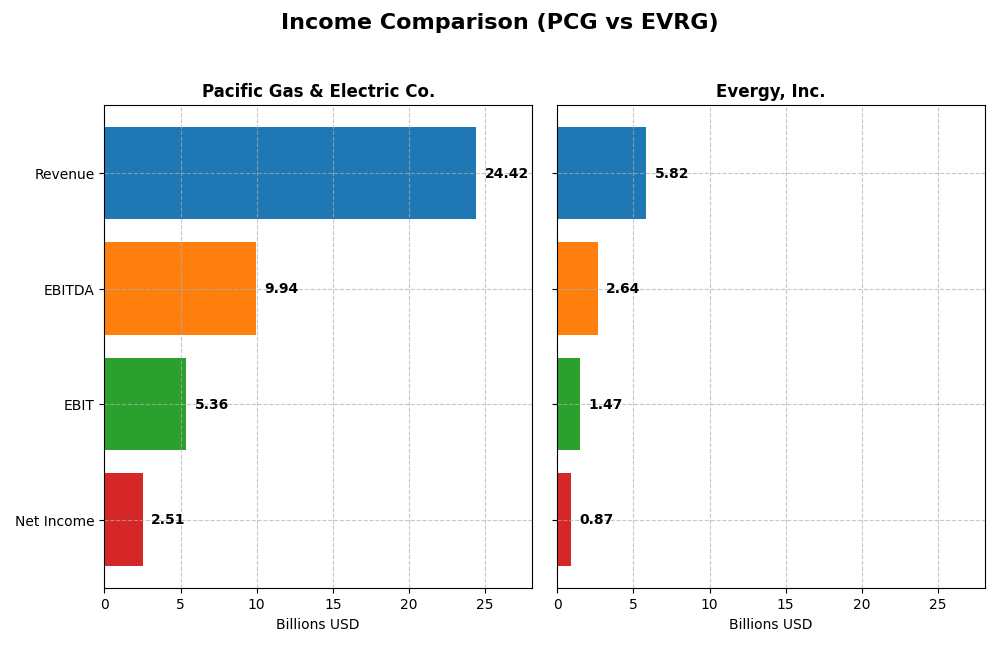
This table compares the key income statement metrics for Pacific Gas & Electric Co. and Evergy, Inc. for the fiscal year 2024, providing a snapshot of their financial performance.
| Metric | Pacific Gas & Electric Co. (PCG) | Evergy, Inc. (EVRG) |
|---|---|---|
| Market Cap | 34.8B | 16.8B |
| Revenue | 24.4B | 5.8B |
| EBITDA | 9.9B | 2.6B |
| EBIT | 5.4B | 1.5B |
| Net Income | 2.5B | 874M |
| EPS | 1.16 | 3.79 |
| Fiscal Year | 2024 | 2024 |
Income Statement Interpretations
Pacific Gas & Electric Co.
Pacific Gas & Electric Co. (PCG) showed a 32.22% revenue growth over 2020-2024, with net income surging 292.64%. Margins improved significantly, gross margin reached 37.5%, and net margin 10.29%. Despite a slight 0.04% revenue decline in 2024, gross profit and EBIT grew by 128.84% and 51.11%, respectively, reflecting stronger profitability and margin expansion.
Evergy, Inc.
Evergy, Inc. (EVRG) posted an 18.53% revenue increase and a 41.27% net income growth over the same period. Its gross margin stood at 32.57%, with a favorable EBIT margin of 25.26%. In 2024, revenue rose by 6.17%, while gross profit and EBIT improved 13.86% and 15.15%, respectively. Net margin growth of 12.5% indicates enhanced operational efficiency.
Which one has the stronger fundamentals?
Both companies exhibit favorable income statement trends, with PCG showing higher overall revenue and net income growth and stronger margin improvements. EVRG maintains higher EBIT and net margins, signaling efficient operations. PCG faces a higher interest expense burden, while EVRG’s interest expense is neutral. Each presents strong fundamentals, differing in growth scale and margin stability.
Financial Ratios Comparison
The table below compares key financial ratios for Pacific Gas & Electric Co. (PCG) and Evergy, Inc. (EVRG) based on their most recent fiscal year data from 2024.
| Ratios | Pacific Gas & Electric Co. (PCG) | Evergy, Inc. (EVRG) |
|---|---|---|
| ROE | 8.33% | 8.77% |
| ROIC | 3.98% | 4.52% |
| P/E | 17.20 | 16.23 |
| P/B | 1.43 | 1.42 |
| Current Ratio | 1.05 | 0.50 |
| Quick Ratio | 1.00 | 0.27 |
| D/E (Debt-to-Equity) | 1.94 | 1.41 |
| Debt-to-Assets | 43.65% | 43.58% |
| Interest Coverage | 1.46 | 2.57 |
| Asset Turnover | 0.18 | 0.18 |
| Fixed Asset Turnover | 0.28 | 0.23 |
| Payout Ratio | 3.42% | 68.31% |
| Dividend Yield | 0.20% | 4.21% |
Interpretation of the Ratios
Pacific Gas & Electric Co.
Pacific Gas & Electric Co. shows mixed financial ratios with strengths in net margin (10.29%, favorable) and WACC (4.68%, favorable), but weaknesses in ROE (8.33%, unfavorable) and interest coverage (1.76, unfavorable). The current ratio is neutral at 1.05. Dividend yield is low at 0.2%, indicating modest shareholder returns supported by a cautious payout approach.
Evergy, Inc.
Evergy, Inc. exhibits a favorable net margin of 15.0% and a strong dividend yield of 4.21%, reflecting attractive shareholder returns. However, it faces challenges with liquidity ratios, including a low current ratio of 0.5 and quick ratio of 0.27, both unfavorable. ROE is slightly better than PCG at 8.77%, though still marked unfavorable.
Which one has the best ratios?
Both companies share a slightly unfavorable global ratio profile with 50% unfavorable ratios and 28.57% favorable. Evergy leads on dividend yield and net margin, while Pacific Gas & Electric has a better liquidity position. Each has notable weaknesses, suggesting balanced but cautious assessment of their financial health.
Strategic Positioning
This section compares the strategic positioning of Pacific Gas & Electric Co. and Evergy, Inc., including market position, key segments, and exposure to technological disruption:
Pacific Gas & Electric Co.
- Leading regulated electric utility in northern and central California with significant market capitalization and low beta.
- Key segments: electricity generation (nuclear, hydro, fossil, photovoltaic) and natural gas distribution. Revenue driven by diverse energy sources.
- Developing advanced personal microgrid backup power integrated with SmartMeter technology, indicating moderate exposure to tech disruption.
Evergy, Inc.
- Regulated electric utility focusing on Kansas and Missouri markets, smaller market cap, moderate beta.
- Key segment: electric utility services with generation from coal, hydro, landfill gas, uranium, natural gas, solar, wind.
- Focus on traditional and renewable energy generation with extensive transmission and distribution infrastructure, less emphasis on advanced tech integration.
Pacific Gas & Electric Co. vs Evergy, Inc. Positioning
Pacific Gas & Electric Co. operates a more diversified business with significant electricity and natural gas segments, while Evergy concentrates on electricity generation and distribution in two states. PCG’s technology integration may offer adaptability; EVRG relies on extensive infrastructure and mixed energy sources.
Which has the best competitive advantage?
Both companies have slightly unfavorable MOAT evaluations, shedding value despite growing ROIC trends. Pacific Gas & Electric Co. shows a smaller negative ROIC vs WACC gap and higher ROIC growth, suggesting a marginally stronger competitive advantage based on current profitability metrics.
Stock Comparison
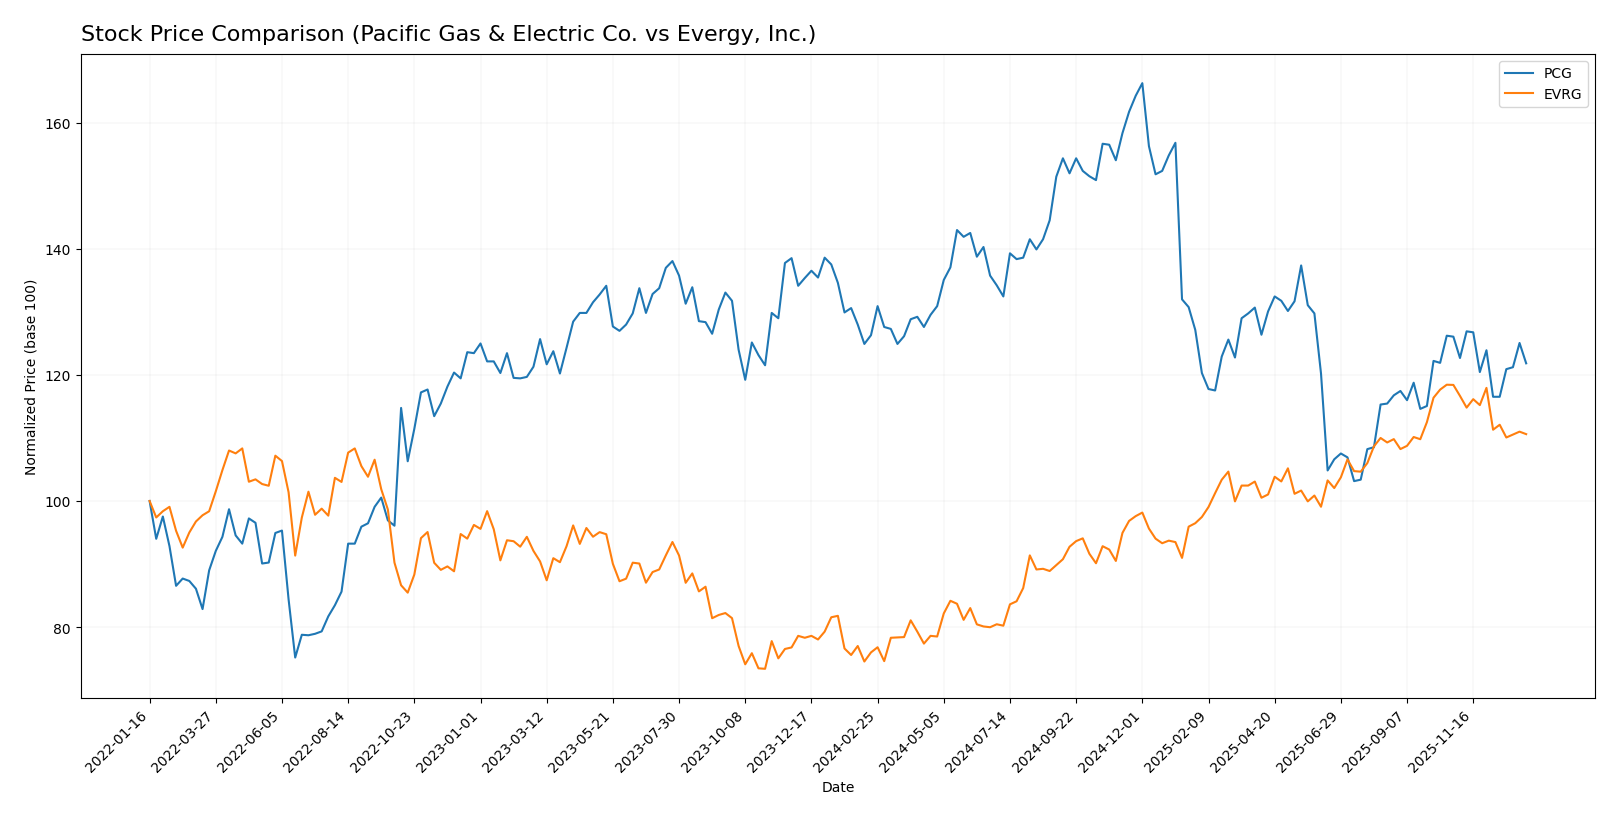
The stock price chart over the past 12 months highlights notable divergences in price movement and trading dynamics between Pacific Gas & Electric Co. and Evergy, Inc., reflecting contrasting market performances and investor sentiment.
Trend Analysis
Pacific Gas & Electric Co. (PCG) experienced a bearish trend with a 3.53% price decline over the past year, showing deceleration and a standard deviation of 1.93. Its price ranged between 13.42 and 21.63.
Evergy, Inc. (EVRG) reported a bullish trend with a 45.55% increase over the same period, though the trend showed deceleration and higher volatility with a 7.94 standard deviation. Prices fluctuated from 49.12 to 77.98.
Comparing the two, Evergy delivered the highest market performance with a strong bullish trend, while Pacific Gas & Electric Co. faced a modest bearish trend throughout the year.
Target Prices
Analysts present a clear target price consensus for Pacific Gas & Electric Co. and Evergy, Inc.
| Company | Target High | Target Low | Consensus |
|---|---|---|---|
| Pacific Gas & Electric Co. | 25 | 18 | 21.5 |
| Evergy, Inc. | 93 | 76 | 82.67 |
The target consensus for PCG at 21.5 significantly exceeds its current price of 15.85, indicating potential upside. Similarly, Evergy’s consensus target of 82.67 is well above the present price of 72.82, reflecting positive analyst expectations.
Analyst Opinions Comparison
This section compares analysts’ ratings and grades for Pacific Gas & Electric Co. (PCG) and Evergy, Inc. (EVRG):
Rating Comparison
PCG Rating
- Rating: B- with a very favorable overall rating status.
- Discounted Cash Flow Score: 1, indicating a very unfavorable valuation based on future cash flows.
- ROE Score: 3, reflecting moderate efficiency in generating profit from shareholders’ equity.
- ROA Score: 3, showing moderate effectiveness in using assets to generate earnings.
- Debt To Equity Score: 1, indicating very unfavorable financial stability due to higher debt.
- Overall Score: 3, moderate overall financial standing.
EVRG Rating
- Rating: B- with a very favorable overall rating status.
- Discounted Cash Flow Score: 1, also very unfavorable regarding future cash flow valuation.
- ROE Score: 3, similarly moderate efficiency in profit generation from equity.
- ROA Score: 3, likewise moderate asset utilization effectiveness.
- Debt To Equity Score: 2, a moderate score, suggesting better financial stability than PCG.
- Overall Score: 2, slightly lower moderate overall financial standing.
Which one is the best rated?
Both PCG and EVRG share the same B- rating with very favorable status. PCG scores higher overall (3 vs. 2), but EVRG has a better debt-to-equity score, indicating relatively stronger financial stability.
Scores Comparison
The comparison of Altman Z-Score and Piotroski Score for the two companies is as follows:
PCG Scores
- Altman Z-Score: 0.48, in the distress zone indicating high bankruptcy risk.
- Piotroski Score: 5, reflecting average financial strength.
EVRG Scores
- Altman Z-Score: 0.82, also in the distress zone with high bankruptcy risk.
- Piotroski Score: 5, reflecting average financial strength.
Which company has the best scores?
Both PCG and EVRG have Altman Z-Scores in the distress zone, indicating financial distress. Their Piotroski Scores are identical at 5, showing average financial health. Neither company shows a clear advantage based on these scores.
Grades Comparison
Here is the detailed comparison of stock grades for Pacific Gas & Electric Co. and Evergy, Inc.:
Pacific Gas & Electric Co. Grades
The following table summarizes recent grades from reliable financial institutions for Pacific Gas & Electric Co.:
| Grading Company | Action | New Grade | Date |
|---|---|---|---|
| JP Morgan | Maintain | Overweight | 2025-12-12 |
| UBS | Maintain | Neutral | 2025-10-24 |
| Jefferies | Maintain | Buy | 2025-10-22 |
| BMO Capital | Maintain | Outperform | 2025-10-14 |
| Jefferies | Maintain | Buy | 2025-10-03 |
| Barclays | Maintain | Overweight | 2025-10-01 |
| Morgan Stanley | Maintain | Equal Weight | 2025-09-25 |
| Morgan Stanley | Upgrade | Equal Weight | 2025-09-18 |
| UBS | Maintain | Neutral | 2025-09-18 |
| Barclays | Maintain | Overweight | 2025-07-22 |
Pacific Gas & Electric Co. shows a consistent pattern of buy and overweight ratings, reflecting a stable positive outlook among analysts.
Evergy, Inc. Grades
Below is the table of recent grades from recognized financial firms for Evergy, Inc.:
| Grading Company | Action | New Grade | Date |
|---|---|---|---|
| Mizuho | Downgrade | Neutral | 2025-12-18 |
| UBS | Maintain | Buy | 2025-12-17 |
| Citigroup | Maintain | Buy | 2025-11-10 |
| Jefferies | Maintain | Buy | 2025-10-09 |
| Mizuho | Maintain | Outperform | 2025-08-08 |
| Mizuho | Maintain | Outperform | 2025-07-18 |
| Barclays | Maintain | Overweight | 2025-05-30 |
| Citigroup | Maintain | Buy | 2025-05-16 |
| UBS | Upgrade | Buy | 2025-04-28 |
| Barclays | Maintain | Overweight | 2025-04-22 |
Evergy, Inc. grades indicate mostly buy and outperform ratings, though a recent downgrade from Mizuho to neutral is notable.
Which company has the best grades?
Both Pacific Gas & Electric Co. and Evergy, Inc. hold predominantly positive ratings with consensus “Buy” from analysts. Pacific Gas & Electric Co. maintains a stronger consistency in overweight and buy grades, while Evergy has a slight recent downgrade trend. Investors may view Pacific Gas & Electric Co.’s steadier grades as a sign of more stable analyst confidence.
Strengths and Weaknesses
Below is a comparison table highlighting the key strengths and weaknesses of Pacific Gas & Electric Co. (PCG) and Evergy, Inc. (EVRG) based on the most recent financial and operational data.
| Criterion | Pacific Gas & Electric Co. (PCG) | Evergy, Inc. (EVRG) |
|---|---|---|
| Diversification | Moderate – Electricity and Natural Gas segments with $18.6B and $6.6B revenue respectively in 2024 | Low – Primarily electric utility segment with $2.7B revenue (2017 data) |
| Profitability | Net margin 10.29% (favorable); ROIC 3.98% (unfavorable) | Net margin 15.0% (favorable); ROIC 4.52% (unfavorable) |
| Innovation | Limited insight – stable but modest asset turnover (0.18) and unfavorable fixed asset turnover (0.28) | Limited insight – similarly low asset turnover (0.18) and fixed asset turnover (0.23) |
| Global presence | Primarily US regional utility focus | Primarily US regional utility focus |
| Market Share | Large scale with $25B+ total revenue (2024) | Smaller scale with ~$2.7B revenue (latest available) |
Key takeaways: Both companies operate mainly in US regional utilities with limited diversification. EVRG shows slightly better profitability metrics but both have low returns on invested capital relative to their cost of capital, indicating slight value destruction despite improving profitability trends. Investors should weigh scale and revenue stability against operational efficiency challenges.
Risk Analysis
Below is a comparative table highlighting key risks for Pacific Gas & Electric Co. (PCG) and Evergy, Inc. (EVRG) based on the latest 2024 financial and operational data.
| Metric | Pacific Gas & Electric Co. (PCG) | Evergy, Inc. (EVRG) |
|---|---|---|
| Market Risk | Low beta (0.38) reduces volatility risk | Moderate beta (0.65) implies moderate market sensitivity |
| Debt level | High debt/equity (1.94), very unfavorable leverage | Moderate debt/equity (1.41), moderate financial risk |
| Regulatory Risk | High, due to California wildfire liabilities and strict state regulations | Moderate, with regulatory environment in Kansas and Missouri |
| Operational Risk | High, with aging infrastructure and complex energy mix | Moderate, diversified generation but reliance on coal and gas |
| Environmental Risk | Significant, wildfire risk and fossil fuel reliance | Moderate, ongoing shift toward renewables but still coal-heavy |
| Geopolitical Risk | Low, US-based with no major foreign exposure | Low, primarily regional US operations |
The most impactful and likely risks for both companies are their high debt levels and regulatory challenges. PCG faces particularly acute regulatory and environmental risks due to California wildfire liabilities, reflected in its distress-zone Altman Z-Score (0.48). EVRG also shows financial distress signs but benefits from a slightly stronger balance sheet and diversified energy sources. Both require cautious risk management for long-term investment stability.
Which Stock to Choose?
Pacific Gas & Electric Co. (PCG) shows a favorable income statement with strong growth in net income (+293%) and net margin (10.29%) but suffers from slightly unfavorable financial ratios, including high debt levels and weak return on invested capital. Its rating is very favorable overall, despite moderate scores on return metrics and a distress-zone Altman Z-Score.
Evergy, Inc. (EVRG) displays a favorable income statement with solid net margin (15.0%) and steady revenue growth, though some operational expenses grew unfavorably. Its financial ratios are similarly slightly unfavorable with moderate debt and liquidity concerns, yet it shares the same very favorable rating and an Altman Z-Score indicating financial distress.
For investors, EVRG’s higher net margin and stronger recent price appreciation might appeal to those tolerating moderate risk and seeking growth. Conversely, PCG’s improving profitability amid financial challenges could be more suitable for investors prioritizing potential value recovery. Both companies have slightly unfavorable moat evaluations, suggesting caution regarding capital efficiency.
Disclaimer: Investment carries a risk of loss of initial capital. The past performance is not a reliable indicator of future results. Be sure to understand risks before making an investment decision.
Go Further
I encourage you to read the complete analyses of Pacific Gas & Electric Co. and Evergy, Inc. to enhance your investment decisions: