In the evolving energy sector, Evergy, Inc. and Oklo Inc. represent two distinct yet overlapping approaches to power generation. Evergy, a traditional utility giant, integrates renewable sources with conventional energy, while Oklo pioneers advanced fission technology for clean, scalable nuclear power. Comparing these companies reveals insights into innovation and market positioning in regulated electric utilities. Join me as we explore which presents the most compelling opportunity for investors today.
Table of contents
Companies Overview
I will begin the comparison between Evergy and Oklo by providing an overview of these two companies and their main differences.
Evergy Overview
Evergy, Inc. operates in the regulated electric industry, generating, transmitting, distributing, and selling electricity primarily in Kansas and Missouri. It uses diverse energy sources including coal, hydroelectric, landfill gas, uranium, natural gas, oil, solar, and wind. Serving about 1.62M customers, Evergy manages extensive transmission and distribution lines, positioning itself as a key utility provider in the Midwestern US.
Oklo Overview
Oklo Inc. focuses on designing and developing fission power plants to deliver reliable, commercial-scale energy in the US. The company also offers used nuclear fuel recycling services. Founded in 2013 and based in Santa Clara, California, Oklo operates with a smaller workforce but targets innovation in nuclear energy within the regulated electric sector, emphasizing advanced technology solutions.
Key similarities and differences
Both Evergy and Oklo operate in the regulated electric utilities sector in the US, aiming to provide dependable energy solutions. Evergy relies on a broad mix of energy sources and serves a large customer base with extensive infrastructure, while Oklo specializes in nuclear fission technology and recycling, with a niche focus on advanced power plants. Their scale, technology focus, and geographic reach differ significantly, reflecting distinct business models within the same industry.
Income Statement Comparison
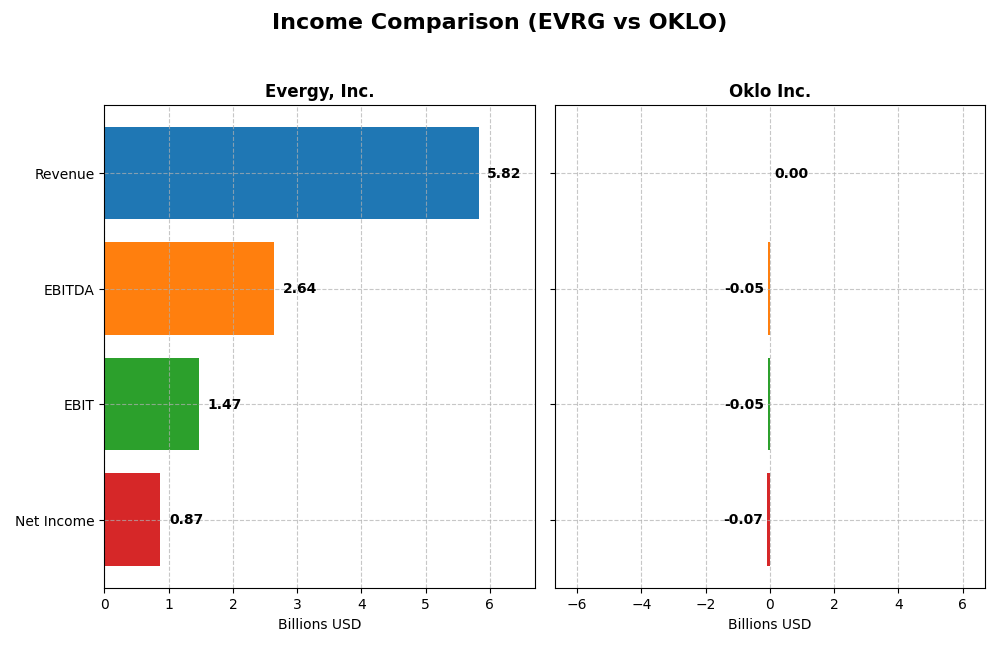
This table presents the latest fiscal year income statement figures for Evergy, Inc. and Oklo Inc., enabling a direct comparison of their financial performance in 2024.
| Metric | Evergy, Inc. (EVRG) | Oklo Inc. (OKLO) |
|---|---|---|
| Market Cap | 16.8B | 16.5B |
| Revenue | 5.82B | 0 |
| EBITDA | 2.64B | -52.5M |
| EBIT | 1.47B | -52.8M |
| Net Income | 874M | -73.6M |
| EPS | 3.79 | -0.74 |
| Fiscal Year | 2024 | 2024 |
Income Statement Interpretations
Evergy, Inc.
Evergy’s revenue showed a favorable growth of 18.53% over 2020-2024, reaching $5.82B in 2024. Net income rose 41.27% overall, with a net margin of 15.0%. Margins improved, particularly EBIT margin to 25.26%. In 2024, revenue growth slowed to 6.17%, but gross profit and net margin growth remained favorable, reflecting operational efficiency gains.
Oklo Inc.
Oklo reported no revenue from 2021 through 2024, resulting in consistent net losses, with net income deteriorating by over 1300% overall. Margins remained at zero, reflecting the absence of sales. The 2024 net loss widened to $73.6M, with EBIT margin and EPS sharply negative. Expense ratios and growth metrics were unfavorable throughout the period.
Which one has the stronger fundamentals?
Evergy displays stronger fundamentals, with favorable income growth, improving margins, and positive net income trends. Oklo continues to operate at a loss with no revenue generation and unfavorable margin metrics. Evergy’s stable utility business contrasts with Oklo’s developmental stage financials, highlighting Evergy’s more robust income statement profile.
Financial Ratios Comparison
The table below presents a side-by-side comparison of key financial ratios for Evergy, Inc. and Oklo Inc. based on their most recent fiscal year data (2024).
| Ratios | Evergy, Inc. (EVRG) | Oklo Inc. (OKLO) |
|---|---|---|
| ROE | 8.77% | -29.35% |
| ROIC | 4.52% | -19.23% |
| P/E | 16.23 | -28.52 |
| P/B | 1.42 | 8.37 |
| Current Ratio | 0.50 | 43.47 |
| Quick Ratio | 0.27 | 43.47 |
| D/E | 1.41 | 0.005 |
| Debt-to-Assets | 43.58% | 0.46% |
| Interest Coverage | 2.57 | 0 |
| Asset Turnover | 0.18 | 0 |
| Fixed Asset Turnover | 0.23 | 0 |
| Payout Ratio | 68.31% | 0 |
| Dividend Yield | 4.21% | 0 |
Interpretation of the Ratios
Evergy, Inc.
Evergy exhibits a mixed ratio profile with favorable net margin (15%) and dividend yield (4.21%), but shows weaknesses in return on equity (8.77%), return on invested capital (4.52%), and liquidity ratios below 1. The payout ratio and dividend have been supported, but free cash flow to equity is negative, indicating potential risk in sustaining dividends or buybacks.
Oklo Inc.
Oklo’s ratios indicate financial challenges, with negative returns on equity (-29.35%) and invested capital (-19.23%), zero net margin, and no dividend payments. Its very high current and quick ratios reflect strong liquidity but may signal excess cash or inefficiency. The firm prioritizes reinvestment and growth, with no dividends or buybacks currently reported.
Which one has the best ratios?
Evergy presents a slightly unfavorable but more balanced set of ratios with positive profitability and dividend yield, while Oklo’s ratios are largely unfavorable due to losses and negative profitability metrics. Liquidity is stronger at Oklo, but overall, Evergy’s financial ratios appear more stable and consistent with a mature utility firm.
Strategic Positioning
This section compares the strategic positioning of Evergy and Oklo, including market position, key segments, and exposure to technological disruption:
Evergy, Inc.
- Established regulated electric utility serving 1.6M customers in Kansas and Missouri with stable competitive pressure.
- Focused on electricity generation, transmission, and distribution with diverse energy sources, including renewables and fossil fuels.
- Moderate exposure to technological disruption, operating with traditional and renewable energy technologies within regulated markets.
Oklo Inc.
- Emerging designer and developer of fission power plants with limited scale and higher competitive uncertainty.
- Concentrated on advanced nuclear energy and used nuclear fuel recycling services as core business drivers.
- Higher exposure to technological disruption due to innovative nuclear fission power technology development.
Evergy vs Oklo Positioning
Evergy maintains a diversified, large-scale utility operation with a broad energy mix and established customer base, offering stability but moderate disruption risk. Oklo’s concentrated focus on novel nuclear technology implies higher innovation potential but greater operational and market risks.
Which has the best competitive advantage?
Evergy shows a slightly unfavorable moat with growing profitability, indicating some value destruction but improving returns. Oklo faces a very unfavorable moat with declining profitability and significant value destruction, reflecting weaker competitive advantage.
Stock Comparison
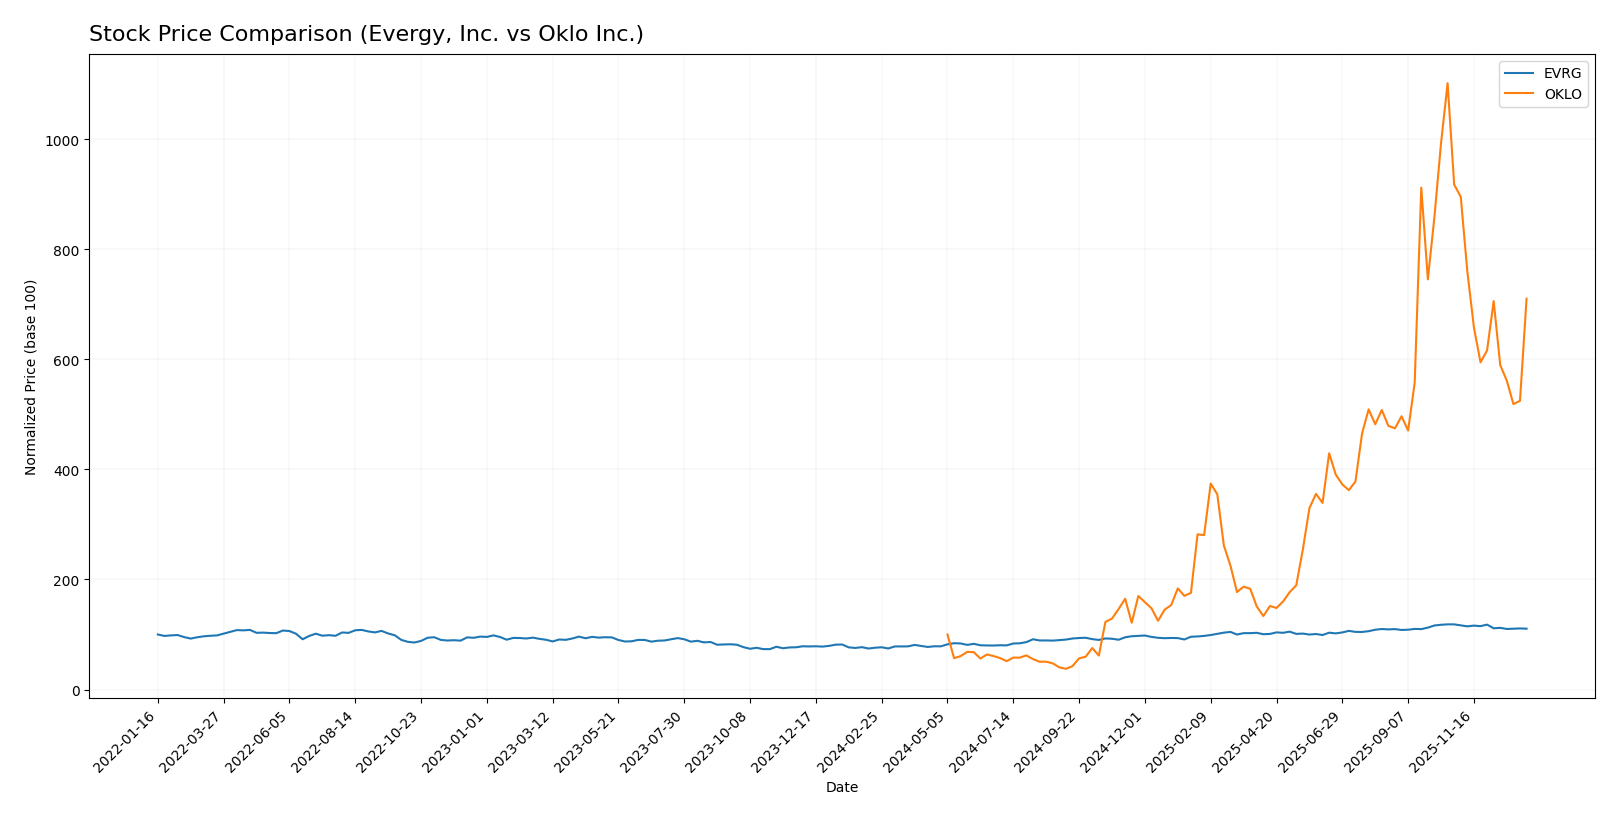
Over the past 12 months, Evergy, Inc. and Oklo Inc. exhibited significant price movements characterized by strong gains followed by recent declines, reflecting contrasting trading dynamics and volatility profiles.
Trend Analysis
Evergy, Inc. showed a bullish trend with a 45.55% price increase over the past year, though the trend decelerated toward recent months with a -6.59% decline and lower volatility. Oklo Inc. recorded a substantial 610.11% price rise, also with deceleration, but experienced a sharper recent drop of -22.59% amid high volatility. Comparing these stocks reveals Oklo Inc. delivered the highest market performance, despite recent downward pressure on both.
Target Prices
The current consensus target prices reflect positive analyst expectations for both Evergy, Inc. and Oklo Inc.
| Company | Target High | Target Low | Consensus |
|---|---|---|---|
| Evergy, Inc. | 93 | 76 | 82.67 |
| Oklo Inc. | 150 | 95 | 125.67 |
Analysts see Evergy’s stock target roughly 13% above its current price of $72.82, while Oklo’s target suggests a potential upside of about 19% from $105.31. Both indicate moderate growth expectations.
Analyst Opinions Comparison
This section compares analysts’ ratings and financial scores for Evergy, Inc. and Oklo Inc.:
Rating Comparison
Evergy, Inc. Rating
- Rating: B-, considered very favorable by analysts.
- Discounted Cash Flow Score: 1, very unfavorable status.
- ROE Score: 3, moderate status indicating decent equity returns.
- ROA Score: 3, moderate, effective asset utilization.
- Debt To Equity Score: 2, moderate, some financial risk.
- Overall Score: 2, moderate overall financial standing.
Oklo Inc. Rating
- Rating: C+, also considered very favorable overall.
- Discounted Cash Flow Score: 3, moderate status.
- ROE Score: 1, very unfavorable, poor equity returns.
- ROA Score: 1, very unfavorable, weak asset utilization.
- Debt To Equity Score: 5, very favorable, strong balance sheet.
- Overall Score: 2, moderate overall financial standing.
Which one is the best rated?
Based on the provided data, Evergy holds a higher rating (B-) compared to Oklo’s (C+). Evergy shows stronger returns on equity and assets, though Oklo has a better debt-to-equity score. Overall, both companies share a moderate overall score.
Scores Comparison
Here is a comparison of the Altman Z-Score and Piotroski Score for Evergy and Oklo:
Evergy Scores
- Altman Z-Score: 0.82, in distress zone, high bankruptcy risk
- Piotroski Score: 5, average financial strength
Oklo Scores
- Altman Z-Score: 339.43, in safe zone, very low bankruptcy risk
- Piotroski Score: 2, very weak financial strength
Which company has the best scores?
Oklo shows a much stronger Altman Z-Score indicating financial safety, but Evergy has a higher Piotroski Score suggesting better financial strength. Scores favor Oklo’s stability, while Evergy’s score indicates moderate health.
Grades Comparison
Here is a detailed comparison of the recent grades for Evergy, Inc. and Oklo Inc.:
Evergy, Inc. Grades
The following table summarizes the latest grades assigned by recognized grading companies for Evergy, Inc.:
| Grading Company | Action | New Grade | Date |
|---|---|---|---|
| Mizuho | Downgrade | Neutral | 2025-12-18 |
| UBS | Maintain | Buy | 2025-12-17 |
| Citigroup | Maintain | Buy | 2025-11-10 |
| Jefferies | Maintain | Buy | 2025-10-09 |
| Mizuho | Maintain | Outperform | 2025-08-08 |
| Mizuho | Maintain | Outperform | 2025-07-18 |
| Barclays | Maintain | Overweight | 2025-05-30 |
| Citigroup | Maintain | Buy | 2025-05-16 |
| UBS | Upgrade | Buy | 2025-04-28 |
| Barclays | Maintain | Overweight | 2025-04-22 |
Evergy’s grades predominantly show a Buy consensus with some recent downgrades to Neutral by Mizuho, indicating a mixed but generally positive outlook.
Oklo Inc. Grades
The table below lists the latest grades from verified grading firms for Oklo Inc.:
| Grading Company | Action | New Grade | Date |
|---|---|---|---|
| Seaport Global | Upgrade | Buy | 2025-12-08 |
| UBS | Maintain | Neutral | 2025-12-03 |
| B of A Securities | Maintain | Neutral | 2025-11-12 |
| B. Riley Securities | Maintain | Buy | 2025-11-12 |
| Wedbush | Maintain | Outperform | 2025-11-12 |
| B of A Securities | Downgrade | Neutral | 2025-09-30 |
| Seaport Global | Downgrade | Neutral | 2025-09-23 |
| Wedbush | Maintain | Outperform | 2025-09-22 |
| Wedbush | Maintain | Outperform | 2025-08-14 |
| Wedbush | Maintain | Outperform | 2025-08-12 |
Oklo’s ratings reflect a strong presence of Outperform and Buy grades, with downgrades to Neutral in recent months, suggesting cautious optimism.
Which company has the best grades?
Both Evergy and Oklo have a consensus rating of Buy. Evergy’s grades mostly cluster around Buy with some Neutral downgrades, while Oklo shows a higher proportion of Outperform grades along with Buy and Neutral ratings. Investors might interpret Oklo’s stronger Outperform trend as a signal of relatively higher confidence from analysts, whereas Evergy presents a steadier but slightly more cautious profile.
Strengths and Weaknesses
Below is a comparative overview of the key strengths and weaknesses of Evergy, Inc. (EVRG) and Oklo Inc. (OKLO) based on the most recent financial and operational data.
| Criterion | Evergy, Inc. (EVRG) | Oklo Inc. (OKLO) |
|---|---|---|
| Diversification | Moderate, focused mainly on electric utility segment (~$2.7B revenue) | Limited, early-stage with no significant product diversification |
| Profitability | Moderate net margin (15%) but ROIC (4.52%) below WACC (5.36%) indicates slight value destruction | Negative profitability, declining ROIC, and negative net margin reflect value destruction |
| Innovation | Stable but traditional utility business model, limited innovation indication | High risk due to nascent technology and business model, innovation potential but unproven |
| Global presence | Primarily regional U.S. electric utility with stable market position | Very limited or no global presence at this stage |
| Market Share | Established market share in regional electric utility sector | Minimal market share, early development phase |
Key takeaways: Evergy exhibits a stable but slightly unfavorable profitability profile with a focused electric utility offering, while Oklo remains a high-risk innovator with significant challenges in profitability and market presence. Investors should weigh Evergy’s steady income against Oklo’s uncertain growth prospects and risk.
Risk Analysis
Below is a comparative table of key risks for Evergy, Inc. (EVRG) and Oklo Inc. (OKLO) based on the most recent financial and operational data from 2024.
| Metric | Evergy, Inc. (EVRG) | Oklo Inc. (OKLO) |
|---|---|---|
| Market Risk | Moderate (Beta 0.65, regulated electric sector) | Moderate (Beta 0.77, emerging tech in nuclear energy) |
| Debt level | High (Debt/Equity 1.41, 44% debt to assets) | Very Low (Debt/Equity 0.01, <1% debt to assets) |
| Regulatory Risk | Moderate (Utility regulations in US Midwest) | High (Nuclear energy licensing and compliance) |
| Operational Risk | Moderate (Aging infrastructure, large grid) | High (Early-stage tech, limited operational history) |
| Environmental Risk | Moderate (Coal and fossil fuel generation exposure) | Low to Moderate (Nuclear power, strict standards) |
| Geopolitical Risk | Low (US-focused, stable regions) | Low (US-focused, stable region) |
The most impactful risks differ: Evergy faces significant debt and operational aging infrastructure risks, while Oklo’s main challenges are regulatory hurdles and operational risks due to its nascent technology. Evergy’s financial distress signals caution despite a favorable dividend yield, whereas Oklo’s extremely low debt mitigates financial risk but its weak profitability and regulatory environment heighten uncertainty. Both require careful risk management before investment.
Which Stock to Choose?
Evergy, Inc. (EVRG) shows a favorable income evolution with consistent revenue and net income growth, supported by a solid gross margin of 32.57% and a net margin of 15.0%. Its profitability ratios such as ROE at 8.77% and ROIC at 4.52% are slightly unfavorable, impacted by a debt-to-equity ratio of 1.41 and a current ratio of 0.5. The company’s rating is very favorable (B-) despite moderate scores in cash flow and equity returns, indicating stable financial health but with some leverage concerns.
Oklo Inc. (OKLO) presents an unfavorable income statement, with zero gross and EBIT margins and negative earnings growth over the period. Its profitability ratios are deeply negative, including an ROE of -29.35% and ROIC of -19.23%, although it maintains a low debt-to-equity ratio of 0.01. The rating stands at very favorable (C+) but masks underlying financial weakness, with a high current ratio of 43.47 contrasting poor operating efficiency and declining profitability.
From an investor’s perspective, Evergy might appear more suitable for those prioritizing income stability and moderate growth, given its favorable income trends and manageable financial ratios. Conversely, Oklo could be of interest to risk-tolerant investors seeking high volatility and potential turnaround scenarios, despite its unfavorable income and profitability metrics. The differing risk profiles imply that preference could depend significantly on individual investment strategies and risk tolerance.
Disclaimer: Investment carries a risk of loss of initial capital. The past performance is not a reliable indicator of future results. Be sure to understand risks before making an investment decision.
Go Further
I encourage you to read the complete analyses of Evergy, Inc. and Oklo Inc. to enhance your investment decisions: