Home > Comparison > Utilities > NEE vs EVRG
The strategic rivalry between NextEra Energy, Inc. and Evergy, Inc. defines the current trajectory of the U.S. regulated electric sector. NextEra operates as a capital-intensive clean energy powerhouse with a diverse generation mix, including wind and solar. Evergy focuses on regional electric generation and distribution, balancing traditional and renewable sources. This analysis assesses which business model offers a superior risk-adjusted return for a diversified utilities portfolio in today’s evolving energy landscape.
Table of contents
Companies Overview
NextEra Energy and Evergy stand as key players in the regulated electric utilities market, serving millions across distinct U.S. regions.
NextEra Energy, Inc.: The Clean Energy Leader
NextEra Energy dominates the regulated electric sector with a diversified energy portfolio spanning wind, solar, nuclear, coal, and natural gas. Its core revenue comes from generating and selling electricity to retail and wholesale customers, supported by 28,564 MW of net generating capacity and a vast transmission network. In 2021, its strategic focus emphasized expanding clean energy solutions and battery storage projects to capitalize on the energy transition.
Evergy, Inc.: Regional Power Provider
Evergy operates as a regional utility, supplying electricity primarily in Kansas and Missouri. It generates revenue through electricity sales from coal, hydro, natural gas, uranium, and renewables. Serving over 1.6M customers, Evergy’s strategy in 2021 centered on maintaining a balanced energy mix while investing in renewable sources and modernizing its extensive transmission and distribution infrastructure.
Strategic Collision: Similarities & Divergences
Both companies rely on regulated electric utilities but diverge in scale and strategic ambition. NextEra pursues a clean energy growth model with a national footprint, while Evergy focuses on regional reliability and a balanced fuel mix. The primary battleground is renewable integration versus traditional energy stability. Investors face distinct profiles: NextEra offers growth through innovation, Evergy through steady regional service.
Income Statement Comparison
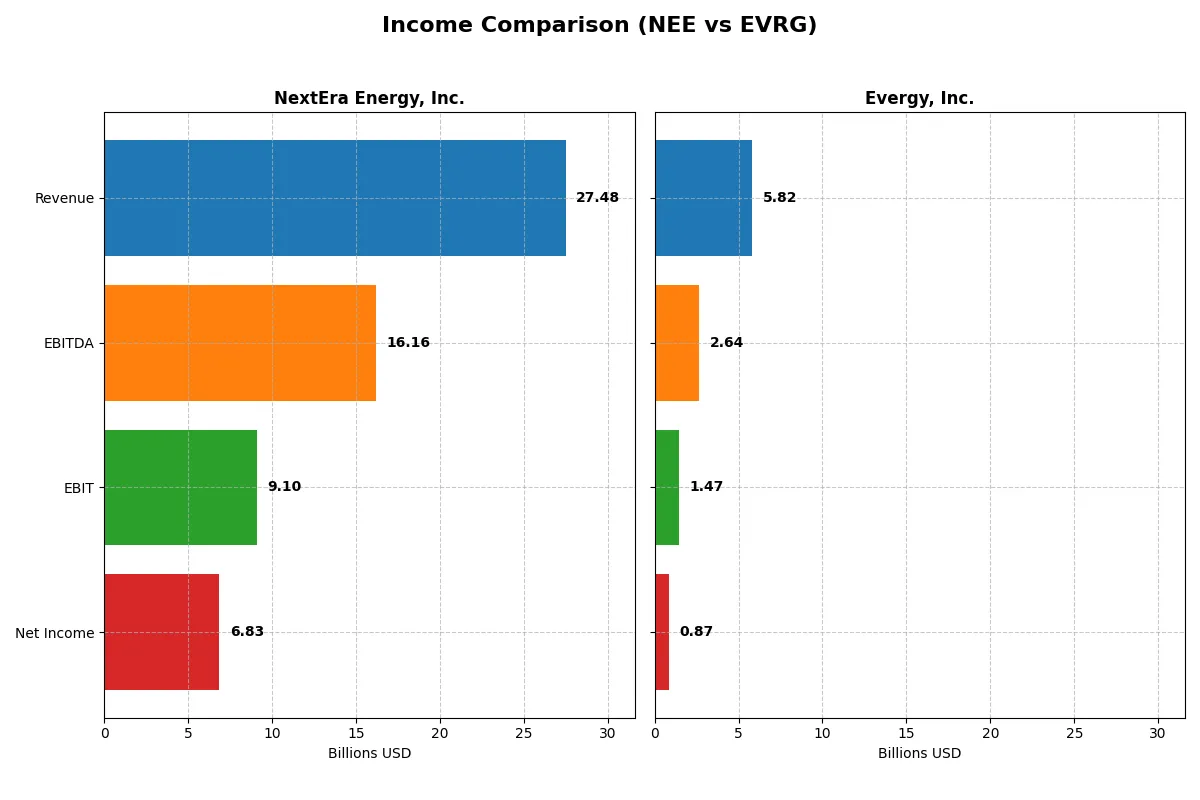
This data dissects the core profitability and scalability of both corporate engines to reveal who dominates the bottom line:
| Metric | NextEra Energy, Inc. (NEE) | Evergy, Inc. (EVRG) |
|---|---|---|
| Revenue | 27.48B | 5.82B |
| Cost of Revenue | 10.22B | 3.93B |
| Operating Expenses | 8.98B | 0.45B |
| Gross Profit | 17.25B | 1.90B |
| EBITDA | 16.17B | 2.64B |
| EBIT | 9.10B | 1.47B |
| Interest Expense | 4.57B | 0.56B |
| Net Income | 6.83B | 0.87B |
| EPS | 3.31 | 3.79 |
| Fiscal Year | 2025 | 2024 |
Income Statement Analysis: The Bottom-Line Duel
The following income statement comparison reveals which company converts revenue into profit most efficiently and sustains growth momentum.
NextEra Energy, Inc. Analysis
NextEra’s revenue climbed from 17.1B in 2021 to 27.5B in 2025, reflecting robust expansion. Net income doubled over five years, reaching 6.8B in 2025. Gross margin remains strong at 62.8%, with a solid EBIT margin of 33.1%. Despite rising interest expenses, NextEra maintains healthy profitability and momentum.
Evergy, Inc. Analysis
Evergy’s revenue grew steadily from 4.9B in 2020 to 5.8B in 2024, with net income rising 41% to 873M. Gross margin stands at a modest 32.6%, while EBIT margin hits 25.3%. The company shows consistent margin improvement and EPS growth, indicating operational efficiency gains amid moderate top-line growth.
Verdict: Margin Power vs. Revenue Scale
NextEra outpaces Evergy in scale, margin, and absolute profit, boasting double-digit revenue growth and superior net margins near 25%. Evergy’s performance shows solid margin expansion but on a smaller revenue base. For investors, NextEra’s blend of strong profitability and growth offers a more compelling profile.
Financial Ratios Comparison
These vital ratios act as a diagnostic tool to expose the underlying fiscal health, valuation premiums, and capital efficiency of the companies compared below:
| Ratios | NextEra Energy, Inc. (NEE) | Evergy, Inc. (EVRG) |
|---|---|---|
| ROE | 13.9% | 8.8% |
| ROIC | 4.0% | 4.5% |
| P/E | 21.2 | 16.2 |
| P/B | 2.94 | 1.42 |
| Current Ratio | 0.47 | 0.50 |
| Quick Ratio | 0.38 | 0.27 |
| D/E | 1.64 | 1.41 |
| Debt-to-Assets | 43.3% | 43.6% |
| Interest Coverage | 3.35 | 2.57 |
| Asset Turnover | 0.13 | 0.18 |
| Fixed Asset Turnover | 0.18 | 0.23 |
| Payout ratio | 61.0% | 68.3% |
| Dividend yield | 2.87% | 4.21% |
| Fiscal Year | 2024 | 2024 |
Efficiency & Valuation Duel: The Vital Signs
Financial ratios act as a company’s DNA, exposing hidden risks and operational strengths that shape investment decisions.
NextEra Energy, Inc.
NextEra shows a solid net margin of 28.1% and a neutral 13.9% ROE, indicating decent profitability. Its P/E of 21.2 and P/B of 2.94 suggest a fairly valued stock, though slightly stretched. The 2.87% dividend yield highlights steady shareholder returns amid reinvestments in capital assets.
Evergy, Inc.
Evergy posts a lower net margin at 15% and an unfavorable 8.8% ROE, signaling weaker profitability. Its P/E of 16.2 and attractive P/B of 1.42 reflect a more reasonably priced valuation. The 4.21% dividend yield underscores a stronger income focus, compensating for modest growth prospects.
Balanced Yield vs. Growth Potential
NextEra offers higher profitability with a reasonable valuation and moderate dividend yield, while Evergy provides a cheaper entry with a higher yield but weaker returns. Investors seeking growth may lean toward NextEra; income-focused profiles might prefer Evergy’s dividend emphasis.
Which one offers the Superior Shareholder Reward?
NextEra Energy (NEE) delivers a balanced distribution with a 2.87% dividend yield and a 61% payout ratio, supported by positive free cash flow of 2.3B. Its buybacks complement dividends, sustaining long-term value. Evergy (EVRG) offers a higher 4.21% yield but with a stretched payout ratio near 68% and negative free cash flow of -1.5B, relying heavily on dividends without meaningful buybacks. Historically, I’ve observed that NextEra’s disciplined capital allocation and sustainable payout make it a superior choice for total return in 2026.
Comparative Score Analysis: The Strategic Profile
The radar chart reveals the fundamental DNA and trade-offs of NextEra Energy, Inc. and Evergy, Inc., highlighting their core financial strengths and vulnerabilities:
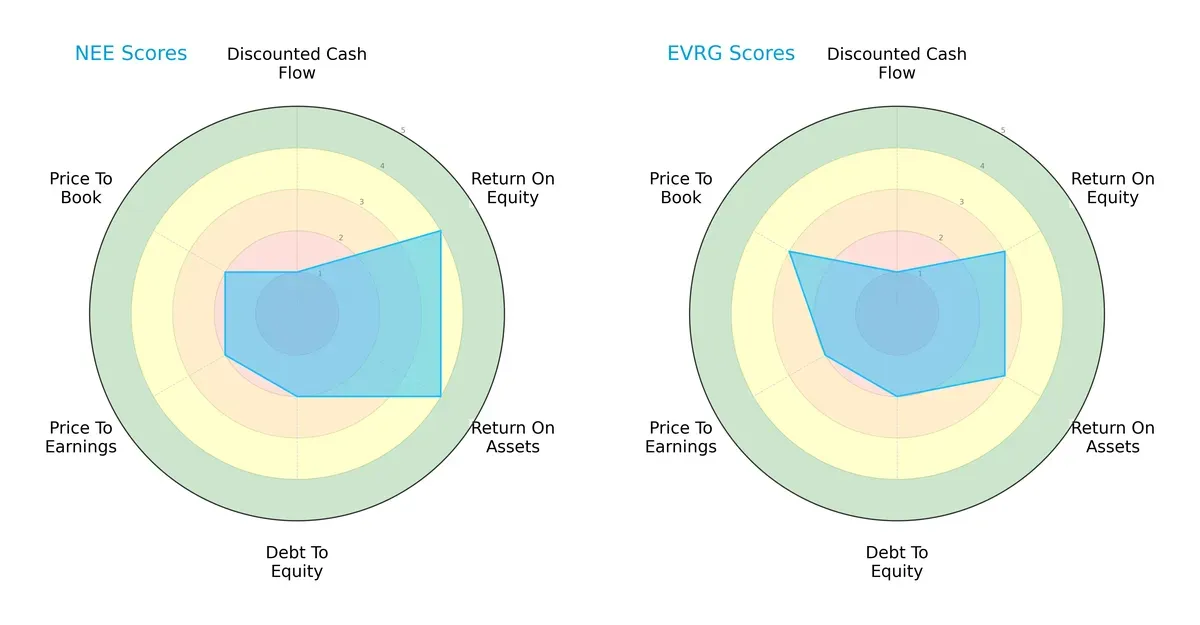
NextEra Energy shows stronger profitability with higher ROE and ROA scores (4 vs. 3), signaling more efficient asset and equity use. Both firms share weak DCF scores (1), indicating undervaluation concerns. Debt-to-Equity scores match (2), reflecting moderate leverage risk. Evergy edges slightly on Price-to-Book (3 vs. 2), suggesting marginally better valuation metrics. Overall, NextEra presents a more balanced financial profile, while Evergy leans on valuation advantages.
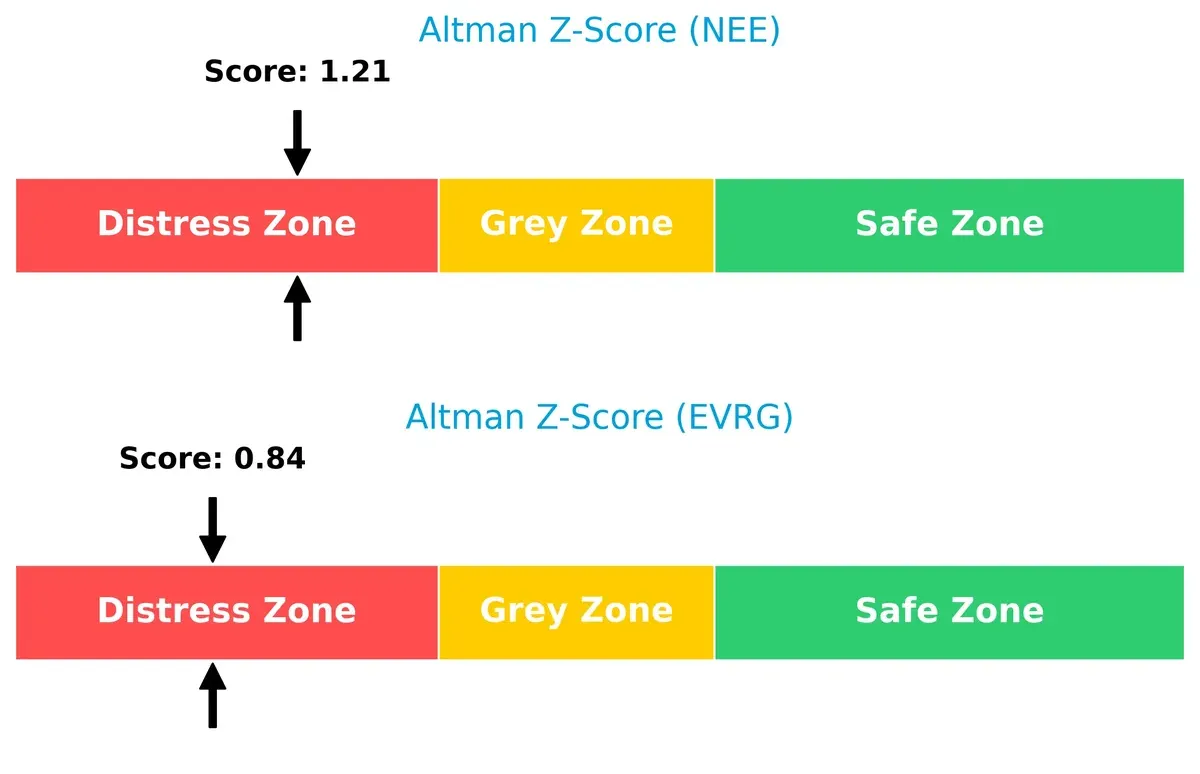
Bankruptcy Risk: Solvency Showdown
NextEra’s Altman Z-Score (1.21) slightly outperforms Evergy’s (0.84), but both remain in distress territory. This signals elevated bankruptcy risk amid the current economic cycle and underscores caution for long-term investors:
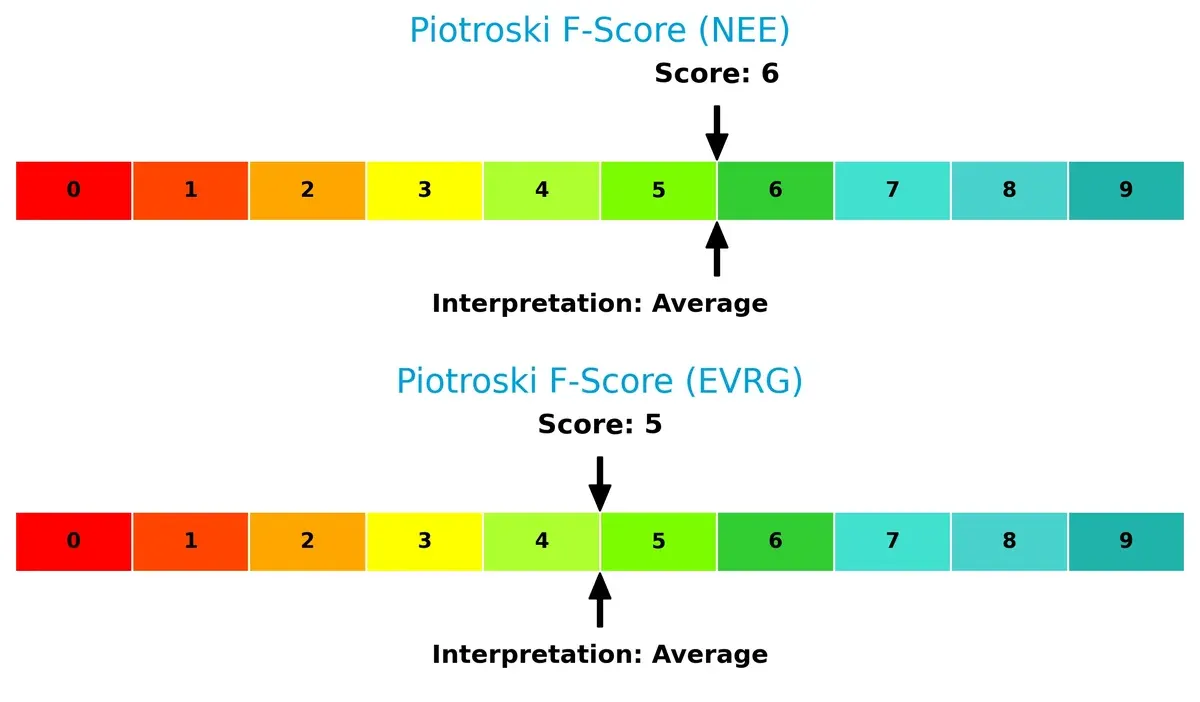
Financial Health: Quality of Operations
NextEra posts a marginally higher Piotroski F-Score of 6 compared to Evergy’s 5, indicating somewhat better operational quality and financial strength. Neither firm shows acute red flags, but both remain only average in internal financial robustness:
How are the two companies positioned?
This section dissects the operational DNA of NextEra Energy and Evergy by comparing their revenue distribution and internal dynamics. The goal is to confront their economic moats to reveal which model offers a more resilient, sustainable competitive advantage today.
Revenue Segmentation: The Strategic Mix
This visual comparison dissects how NextEra Energy, Inc. and Evergy, Inc. diversify their income streams and where their primary sector bets lie:
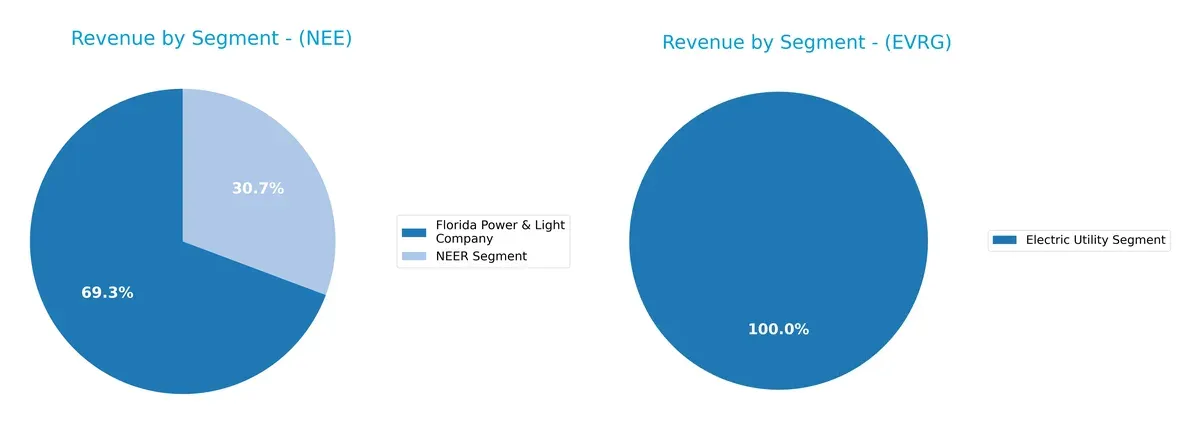
NextEra Energy anchors revenue with its Florida Power & Light Company segment at $17B, dwarfs its $7.5B NEER segment, showing moderate diversification. Evergy relies almost entirely on its Electric Utility Segment at $2.7B, indicating high concentration risk. NextEra’s mix supports ecosystem lock-in through regulated utilities and renewables, while Evergy’s narrower exposure suggests vulnerability to sector-specific shifts. The contrast highlights NextEra’s strategic breadth versus Evergy’s focused infrastructure play.
Strengths and Weaknesses Comparison
This table compares the strengths and weaknesses of NextEra Energy, Inc. and Evergy, Inc.:
NextEra Energy Strengths
- Diversified revenue from Florida Power & Light and NextEra Energy Resources
- Favorable net margin at 28.06%
- WACC lower than ROIC
- Dividend yield of 2.87% signals shareholder return
Evergy Strengths
- Favorable net margin at 15.0%
- Lower PE ratio at 16.23
- Favorable price-to-book at 1.42
- Dividend yield of 4.21% higher than peer
NextEra Energy Weaknesses
- Unfavorable ROIC below WACC at 4.04% vs. 6.4%
- Low liquidity ratios under 0.5
- High debt-to-equity at 1.64
- Weak asset turnover and interest coverage
Evergy Weaknesses
- Unfavorable ROE at 8.77%
- Low liquidity ratios under 0.5
- High debt-to-equity at 1.41
- Unfavorable asset turnover despite better interest coverage
NextEra Energy shows strength in diversification and profitability but struggles with capital efficiency and liquidity. Evergy delivers better valuation metrics and dividend yield but faces challenges in profitability and operational efficiency. Both companies must address liquidity and asset utilization to improve financial resilience.
The Moat Duel: Analyzing Competitive Defensibility
A structural moat is the only reliable shield protecting long-term profits from relentless competitive erosion in capital-intensive industries:
NextEra Energy, Inc.: Renewable Scale and Regulatory Backbone
NextEra’s moat centers on its scale in renewable assets and regulated transmission lines. This manifests in high gross margins (63%) and stable EBIT margins (33%). However, declining ROIC versus WACC signals value destruction, threatening moat durability in 2026.
Evergy, Inc.: Operational Efficiency with Regional Focus
Evergy leverages cost advantages through operational efficiency and a focused regional footprint. Its improving ROIC trend and expanding net margin (15%) contrast with NextEra’s decline, suggesting a strengthening moat amid moderate scale limits.
Scale Dominance vs. Operational Momentum
NextEra commands a wider moat through unparalleled renewable capacity but suffers declining capital efficiency. Evergy’s improving profitability reflects a deeper moat in operational execution. I see Evergy better positioned to defend market share amid evolving industry dynamics.
Which stock offers better returns?
The past year showed strong price gains for both stocks, with notable highs and a decelerating upward momentum in trading dynamics.
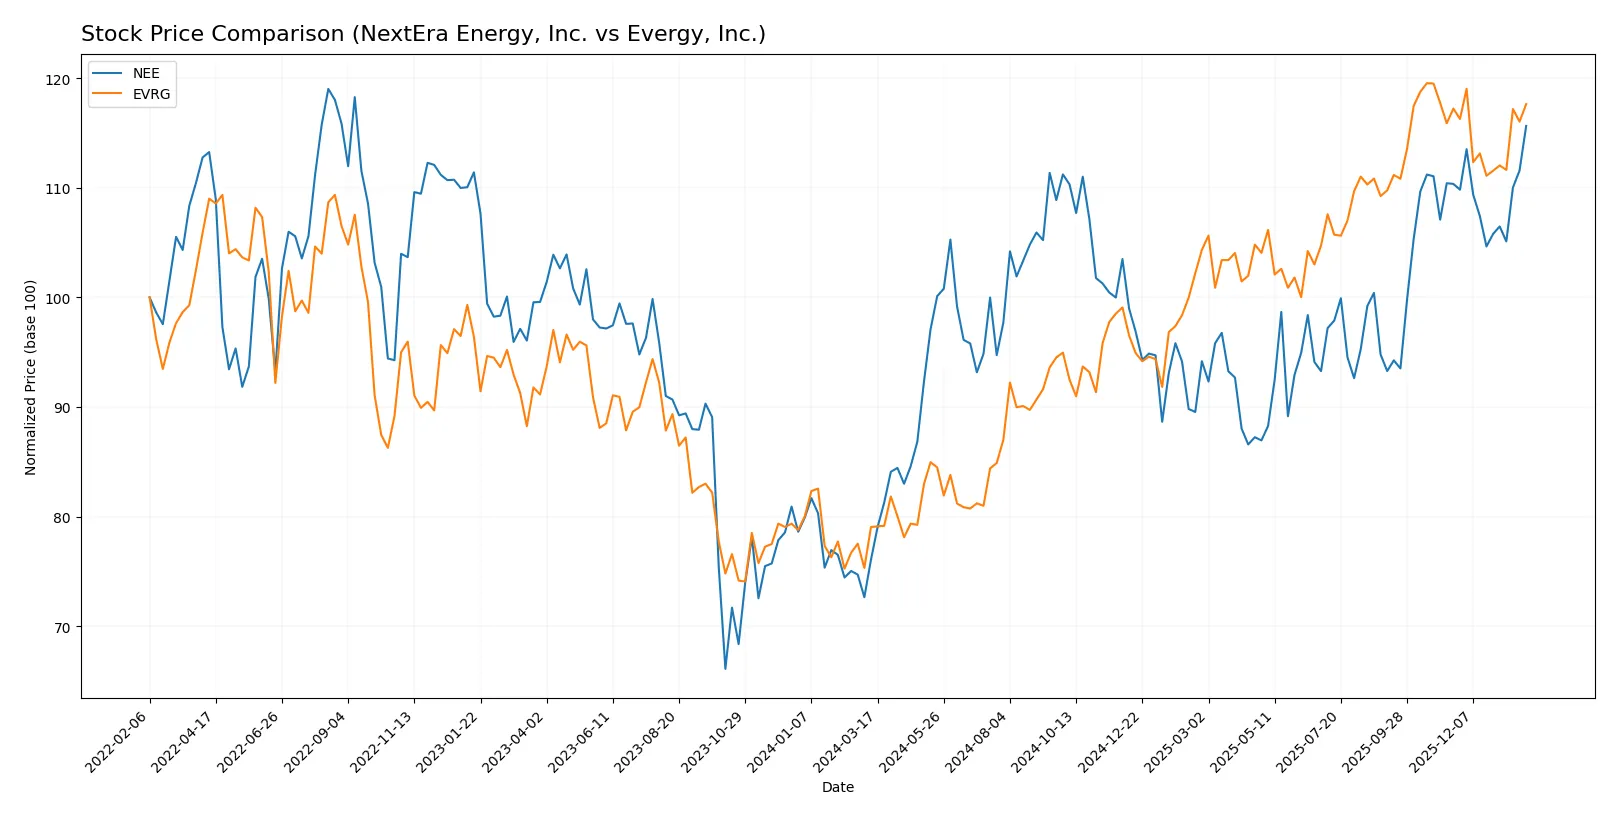
Trend Comparison
NextEra Energy, Inc. (NEE) posted a bullish trend over 12 months with a 52.05% price increase, decelerating momentum, and a high volatility of 6.42%. The stock peaked at 87.9 and bottomed at 57.81.
Evergy, Inc. (EVRG) also delivered a bullish 48.82% gain over the same period, with decelerating momentum and higher volatility at 7.82%. The stock’s price ranged between 50.95 and 77.98.
NEE outperformed EVRG by 3.23 percentage points, exhibiting stronger market performance despite both stocks showing decelerating bullish trends over the past year.
Target Prices
Analysts project moderate upside for NextEra Energy and Evergy, reflecting solid fundamentals in the regulated electric sector.
| Company | Target Low | Target High | Consensus |
|---|---|---|---|
| NextEra Energy, Inc. | 84 | 104 | 93.09 |
| Evergy, Inc. | 76 | 91 | 82.67 |
NextEra’s consensus target of 93.09 suggests about a 6% premium to its current 87.9 price. Evergy’s 82.67 target implies roughly an 8% gain from 76.73 today. Both stocks show modest analyst confidence, indicating steady growth potential.

Don’t Let Luck Decide Your Entry Point
Optimize your entry points with our advanced ProRealTime indicators. You’ll get efficient buy signals with precise price targets for maximum performance. Start outperforming now!
How do institutions grade them?
NextEra Energy, Inc. Grades
Here are recent grades assigned to NextEra Energy by major institutions:
| Grading Company | Action | New Grade | Date |
|---|---|---|---|
| Mizuho | Maintain | Neutral | 2026-01-28 |
| Argus Research | Maintain | Buy | 2026-01-28 |
| BMO Capital | Maintain | Outperform | 2026-01-27 |
| Wells Fargo | Maintain | Overweight | 2026-01-20 |
| Barclays | Maintain | Equal Weight | 2026-01-15 |
| Jefferies | Maintain | Hold | 2025-12-31 |
| UBS | Maintain | Buy | 2025-12-17 |
| JP Morgan | Maintain | Overweight | 2025-12-11 |
| BMO Capital | Maintain | Outperform | 2025-12-10 |
| UBS | Maintain | Buy | 2025-12-10 |
Evergy, Inc. Grades
Here are recent grades assigned to Evergy by major institutions:
| Grading Company | Action | New Grade | Date |
|---|---|---|---|
| BMO Capital | Maintain | Outperform | 2026-01-27 |
| Barclays | Maintain | Overweight | 2026-01-22 |
| Wells Fargo | Maintain | Equal Weight | 2026-01-20 |
| Mizuho | Downgrade | Neutral | 2025-12-18 |
| UBS | Maintain | Buy | 2025-12-17 |
| Citigroup | Maintain | Buy | 2025-11-10 |
| Jefferies | Maintain | Buy | 2025-10-09 |
| Mizuho | Maintain | Outperform | 2025-08-08 |
| Mizuho | Maintain | Outperform | 2025-07-18 |
| Barclays | Maintain | Overweight | 2025-05-30 |
Which company has the best grades?
NextEra Energy consistently receives strong ratings, including multiple “Buy” and “Outperform” grades. Evergy shows a wider range, with some recent downgrades to “Neutral.” Investors might interpret NextEra’s steadier grades as greater analyst confidence.
Risks specific to each company
The following categories identify the critical pressure points and systemic threats facing both firms in the 2026 market environment:
1. Market & Competition
NextEra Energy, Inc.
- Dominates with a large 183B market cap and diversified clean energy assets, but faces intense regulatory and market shifts.
Evergy, Inc.
- Smaller 17.7B market cap limits scale; regional focus in Kansas and Missouri restricts growth but reduces exposure to national competition.
2. Capital Structure & Debt
NextEra Energy, Inc.
- High debt-to-equity (1.64) and weak interest coverage (1.99) raise financial risk amid capital-intensive projects.
Evergy, Inc.
- Slightly lower debt-to-equity (1.41) and better interest coverage (2.61) improve financial flexibility but remain vulnerable.
3. Stock Volatility
NextEra Energy, Inc.
- Beta of 0.73 shows moderate volatility, reflecting stable yet cyclical utility sector nature.
Evergy, Inc.
- Beta of 0.65 indicates slightly lower volatility, offering a bit more defensive positioning within the utilities space.
4. Regulatory & Legal
NextEra Energy, Inc.
- Faces complex multi-state regulatory environments and shifting climate policies impacting renewables investments.
Evergy, Inc.
- Regional regulatory risks concentrated in Missouri and Kansas; less diversified but simpler compliance landscape.
5. Supply Chain & Operations
NextEra Energy, Inc.
- Large-scale infrastructure (77K miles lines) creates operational complexity and exposure to supply disruptions.
Evergy, Inc.
- Smaller network (63K miles total lines) reduces operational risk but limits economies of scale.
6. ESG & Climate Transition
NextEra Energy, Inc.
- Leading in renewable generation and battery storage, but faces pressure to improve ROIC and manage capital allocation prudently.
Evergy, Inc.
- Growing renewables presence but slower transition pace; moderate ESG initiatives may lag sector leaders.
7. Geopolitical Exposure
NextEra Energy, Inc.
- Primarily US-focused, reducing geopolitical risks but exposed to federal energy policy shifts.
Evergy, Inc.
- Also US-centric, with minimal international exposure; risks tied mainly to state-level political changes.
Which company shows a better risk-adjusted profile?
NextEra’s largest risk lies in its stretched capital structure and weak liquidity ratios, which challenge its aggressive expansion. Evergy’s main risk is its smaller scale and slower ESG transition, limiting growth and resilience. Despite both in the distress zone per Altman Z-scores, I see Evergy’s slightly better debt metrics and lower volatility offering a marginally stronger risk-adjusted profile. The recent persistent low interest coverage for NextEra signals liquidity strain amid rising capital costs, justifying cautious positioning.
Final Verdict: Which stock to choose?
NextEra Energy’s superpower lies in its strong cash generation and robust income statement growth, positioning it as a powerful engine for long-term value. Its key point of vigilance is a declining return on invested capital, signaling potential challenges in capital efficiency. It suits portfolios aiming for aggressive growth with a focus on expanding market presence.
Evergy’s strategic moat is its steady operational improvement and a rising return on invested capital, reflecting growing profitability despite value erosion. It offers a slightly safer profile than NextEra, with a more conservative valuation and higher dividend yield. It fits well within GARP portfolios seeking stable growth paired with reasonable price metrics.
If you prioritize dynamic growth and can accept the risks tied to capital efficiency, NextEra Energy outshines as the compelling choice due to its superior cash flow momentum. However, if you seek better stability and improving profitability with a more balanced risk profile, Evergy offers a prudent alternative. Both present analytical scenarios worth considering based on your investment strategy.
Disclaimer: Investment carries a risk of loss of initial capital. The past performance is not a reliable indicator of future results. Be sure to understand risks before making an investment decision.
Go Further
I encourage you to read the complete analyses of NextEra Energy, Inc. and Evergy, Inc. to enhance your investment decisions: