Exelon Corporation (EXC) and Evergy, Inc. (EVRG) are two key players in the regulated electric utility sector, each with a strong presence in the U.S. energy market. Both companies focus on generating and distributing electricity through a mix of traditional and renewable sources, competing in overlapping regions while pursuing distinct innovation strategies. In this article, I will help you explore which company offers the most compelling investment opportunity in 2026.
Table of contents
Companies Overview
I will begin the comparison between Exelon Corporation and Evergy, Inc. by providing an overview of these two companies and their main differences.
Exelon Overview
Exelon Corporation is a utility services holding company engaged in energy generation, delivery, and marketing across the US and Canada. It operates nuclear, fossil, wind, hydroelectric, biomass, and solar facilities, serving wholesale and retail customers. Exelon also provides natural gas, renewable energy, and various support services, catering to utilities, municipalities, cooperatives, commercial, industrial, governmental, and residential clients.
Evergy Overview
Evergy, Inc. operates in electricity generation, transmission, distribution, and sales primarily in Kansas and Missouri. Its energy sources include coal, hydroelectric, landfill gas, uranium, natural gas, oil, solar, wind, and other renewables. Evergy maintains an extensive network of transmission and distribution lines, serving about 1.6M customers across residential, commercial, industrial, municipal, and utility sectors within its region.
Key similarities and differences
Both Exelon and Evergy operate in the regulated electric utility sector, focusing on generating and distributing electricity with a mix of renewable and traditional sources. Exelon has a broader geographic footprint across the US and Canada and a more diversified energy portfolio, while Evergy concentrates on Kansas and Missouri with a sizable local infrastructure. Exelon’s larger scale is reflected in its higher market cap and employee count compared to Evergy’s regional focus.
Income Statement Comparison
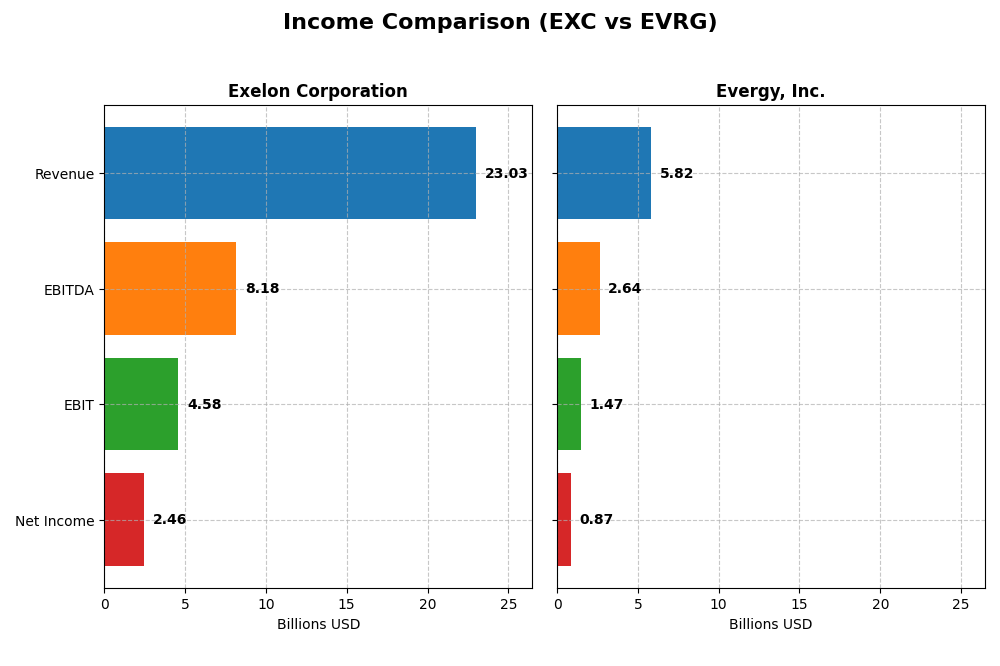
The table below presents a side-by-side comparison of key income statement metrics for Exelon Corporation and Evergy, Inc. for the fiscal year 2024.
| Metric | Exelon Corporation (EXC) | Evergy, Inc. (EVRG) |
|---|---|---|
| Market Cap | 43.8B | 16.8B |
| Revenue | 23.0B | 5.82B |
| EBITDA | 8.18B | 2.64B |
| EBIT | 4.58B | 1.47B |
| Net Income | 2.46B | 874M |
| EPS | 2.45 | 3.79 |
| Fiscal Year | 2024 | 2024 |
Income Statement Interpretations
Exelon Corporation
Exelon’s revenue showed an overall decline of 30.3% from 2020 to 2024, while net income grew by 25.3%, reflecting improved profitability. Margins remained largely stable, with a favorable gross margin of 40.8% and net margin of 10.7%. In 2024, revenue grew modestly by 6%, but net margin slightly contracted by 0.3%, suggesting margin pressure despite higher sales.
Evergy, Inc.
Evergy exhibited steady revenue growth of 18.5% over 2020-2024, accompanied by a 41.3% increase in net income. Margins improved consistently, with a gross margin of 32.6% and a robust net margin of 15% in 2024. The latest year saw a 6.2% revenue rise and a strong 12.5% net margin expansion, indicating improving operational efficiency and profitability.
Which one has the stronger fundamentals?
Both companies demonstrate favorable income statement trends, yet Evergy shows stronger fundamentals through higher margin improvements and greater net income growth over the period. Exelon’s declining revenue contrasts with its rising net income, while Evergy’s consistent growth in revenue, margins, and earnings per share points to a more robust and improving financial profile.
Financial Ratios Comparison
Below is a comparison of key financial ratios for Exelon Corporation and Evergy, Inc. based on their most recent fiscal year data available for 2024.
| Ratios | Exelon Corporation (EXC) | Evergy, Inc. (EVRG) |
|---|---|---|
| ROE | 9.14% | 8.77% |
| ROIC | 3.93% | 4.52% |
| P/E | 15.35 | 16.23 |
| P/B | 1.40 | 1.42 |
| Current Ratio | 0.87 | 0.50 |
| Quick Ratio | 0.78 | 0.27 |
| D/E (Debt to Equity) | 1.73 | 1.41 |
| Debt-to-Assets | 43.28% | 43.58% |
| Interest Coverage | 2.26 | 2.57 |
| Asset Turnover | 0.21 | 0.18 |
| Fixed Asset Turnover | 0.29 | 0.23 |
| Payout Ratio | 61.95% | 68.31% |
| Dividend Yield | 4.04% | 4.21% |
Interpretation of the Ratios
Exelon Corporation
Exelon shows mixed financial ratios, with a favorable net margin of 10.68% but unfavorable returns on equity (9.14%) and invested capital (3.93%). Liquidity ratios like current (0.87) and quick are weak, and leverage is relatively high (D/E 1.73). The dividend yield is attractive at 4.04%, supported by a consistent payout, though coverage by free cash flow is a potential concern.
Evergy, Inc.
Evergy posts a stronger net margin of 15% but similarly weak returns on equity (8.77%) and invested capital (4.52%). Its liquidity ratios are weaker than Exelon’s, with a current ratio of 0.5 and quick ratio of 0.27. The debt-to-equity ratio is lower at 1.41. Evergy offers a slightly higher dividend yield at 4.21%, with stable distributions but free cash flow coverage remains limited.
Which one has the best ratios?
Both companies share a similar profile of moderate profitability and high leverage, with liquidity challenges evident in their current and quick ratios. Each has a favorable dividend yield near 4%, yet free cash flow coverage raises caution. Overall, neither stands out decisively; both hold a slightly unfavorable global ratio assessment with balanced strengths and weaknesses.
Strategic Positioning
This section compares the strategic positioning of Exelon Corporation and Evergy, Inc., covering market position, key segments, and exposure to technological disruption:
Exelon Corporation
- Largest market cap in regulated electric sector, facing moderate competition.
- Diversified segments including nuclear, fossil, wind, hydroelectric, biomass, and solar generation.
- Exposure to various renewable technologies alongside traditional sources.
Evergy, Inc.
- Smaller market cap with strong regional presence in Kansas and Missouri.
- Focused on electric generation and distribution with coal, hydro, gas, and renewable sources.
- Incorporates renewables but primarily focused on traditional and regional electric utilities.
Exelon Corporation vs Evergy, Inc. Positioning
Exelon shows a diversified business model spanning multiple energy sources and broad geographic coverage, while Evergy maintains a more concentrated regional focus with traditional and some renewable energy generation. Exelon’s scale provides broader market reach, whereas Evergy’s focus may limit diversification benefits.
Which has the best competitive advantage?
Both companies are shedding value with ROIC below WACC, but show growing profitability trends. Neither currently demonstrates a strong economic moat; their competitive advantages are slightly unfavorable but improving.
Stock Comparison
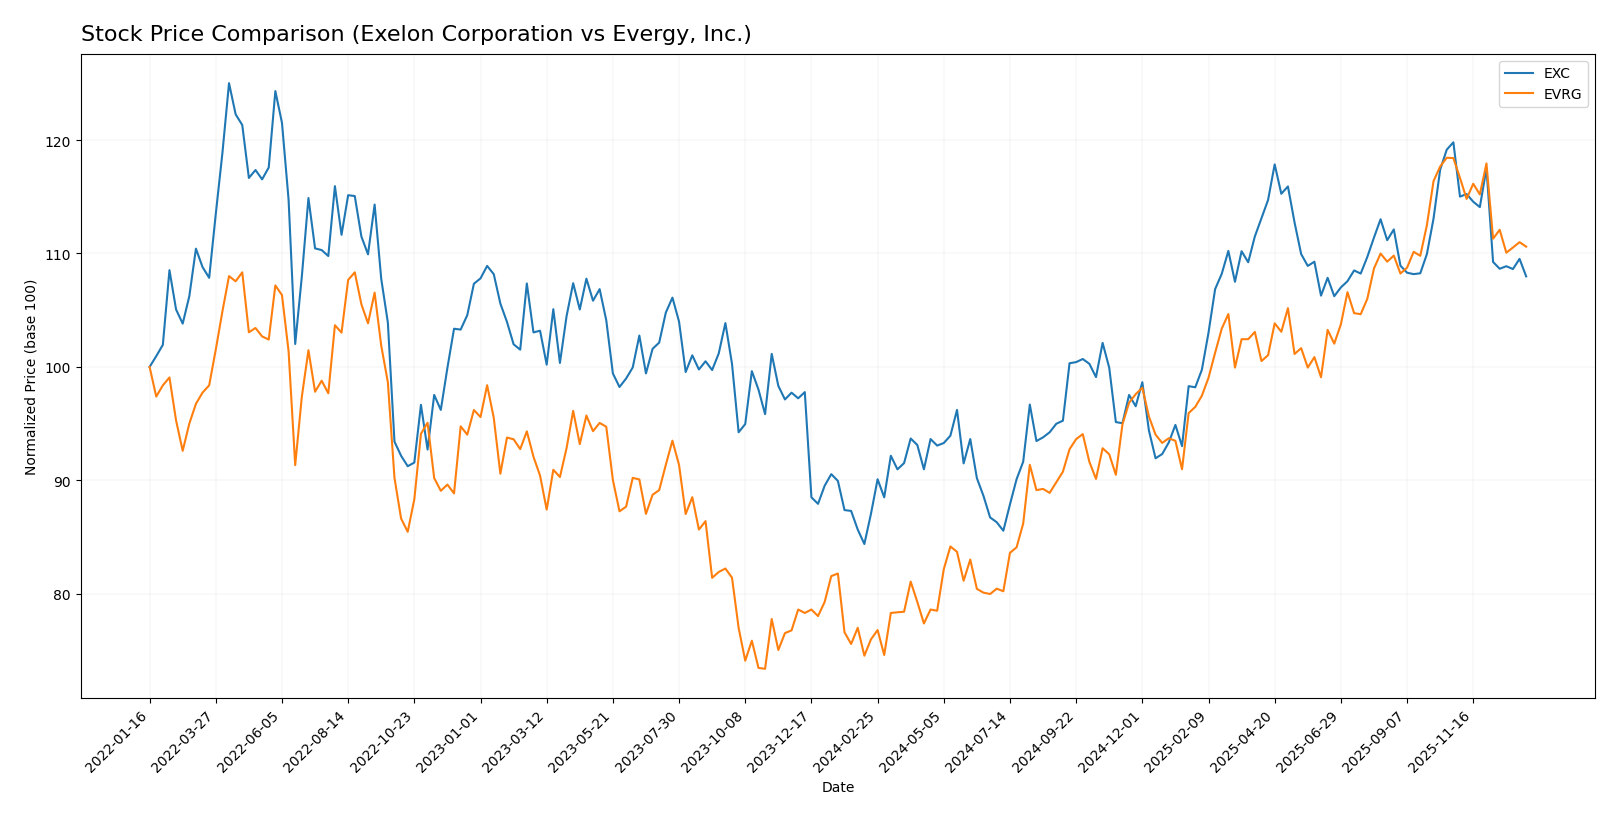
The stock price movements over the past 12 months reveal distinct bullish trends for both Exelon Corporation (EXC) and Evergy, Inc. (EVRG), with notable deceleration and recent downward corrections affecting their trading dynamics.
Trend Analysis
Exelon Corporation (EXC) exhibited a strong bullish trend over the past year with a 24.03% price increase, though the trend shows deceleration and a recent 9.87% decline between October 2025 and January 2026. Volatility measured by standard deviation is moderate at 3.75.
Evergy, Inc. (EVRG) demonstrated a more pronounced bullish trend with a 45.55% price gain over the year, also decelerating recently and experiencing a 6.59% decrease in the last quarter. Its volatility is higher, with a 7.94 standard deviation.
Comparing the two, EVRG outperformed EXC in overall market performance with a higher annual price increase, despite both stocks facing recent short-term declines and volume decreases.
Target Prices
Analysts present a clear target price consensus for Exelon Corporation and Evergy, Inc., indicating potential upside for both stocks.
| Company | Target High | Target Low | Consensus |
|---|---|---|---|
| Exelon Corporation | 57 | 39 | 50.86 |
| Evergy, Inc. | 93 | 76 | 82.67 |
The consensus target prices for Exelon and Evergy suggest upside potential above their current prices of 43.3 and 72.82 respectively, reflecting positive analyst expectations for these utilities.
Analyst Opinions Comparison
This section compares analysts’ ratings and grades for Exelon Corporation and Evergy, Inc.:
Rating Comparison
Exelon Corporation Rating
- Rating: B, considered very favorable by analysts.
- Discounted Cash Flow Score: Moderate score of 3.
- ROE Score: Moderate score of 3, showing efficient profit generation.
- ROA Score: Moderate score of 3, reflecting effective asset use.
- Debt To Equity Score: Moderate score of 2, moderate financial risk.
- Overall Score: Moderate score of 3, summarizing financial standing.
Evergy, Inc. Rating
- Rating: B-, also rated very favorable by analysts.
- Discounted Cash Flow Score: Very unfavorable score of 1.
- ROE Score: Moderate score of 3, indicating similar efficiency.
- ROA Score: Moderate score of 3, also indicating effective asset use.
- Debt To Equity Score: Moderate score of 2, similar financial risk.
- Overall Score: Moderate score of 2, slightly lower overall standing.
Which one is the best rated?
Exelon holds a higher overall score (3) compared to Evergy (2) and a stronger discounted cash flow score (3 vs. 1). Both have the same ROE, ROA, and debt-to-equity scores. Exelon is better rated based strictly on these data.
Scores Comparison
The comparison of Exelon Corporation (EXC) and Evergy, Inc. (EVRG) scores is as follows:
EXC Scores
- Altman Z-Score: 0.78, indicating financial distress and high bankruptcy risk.
- Piotroski Score: 5, reflecting average financial strength and investment quality.
EVRG Scores
- Altman Z-Score: 0.82, indicating financial distress and high bankruptcy risk.
- Piotroski Score: 5, reflecting average financial strength and investment quality.
Which company has the best scores?
Both EXC and EVRG have Altman Z-Scores in the distress zone, signaling high bankruptcy risk, and identical Piotroski Scores of 5, indicating average financial health. Therefore, neither company shows a clear advantage based on these scores.
Grades Comparison
The following tables present the recent grades assigned to Exelon Corporation and Evergy, Inc. by reputable financial institutions:
Exelon Corporation Grades
This table summarizes the latest ratings from established grading companies for Exelon Corporation:
| Grading Company | Action | New Grade | Date |
|---|---|---|---|
| UBS | Maintain | Neutral | 2025-12-17 |
| JP Morgan | Maintain | Neutral | 2025-12-12 |
| Morgan Stanley | Maintain | Equal Weight | 2025-10-22 |
| Keybanc | Maintain | Underweight | 2025-10-15 |
| Jefferies | Maintain | Buy | 2025-10-15 |
| Barclays | Maintain | Overweight | 2025-10-14 |
| UBS | Maintain | Neutral | 2025-10-10 |
| Morgan Stanley | Maintain | Equal Weight | 2025-09-25 |
| Keybanc | Maintain | Underweight | 2025-07-16 |
| UBS | Maintain | Neutral | 2025-07-11 |
Exelon’s grades generally range from Neutral to Buy, with some Underweight and Overweight ratings, indicating a mixed but mostly cautious market view.
Evergy, Inc. Grades
This table summarizes the latest ratings from established grading companies for Evergy, Inc.:
| Grading Company | Action | New Grade | Date |
|---|---|---|---|
| Mizuho | Downgrade | Neutral | 2025-12-18 |
| UBS | Maintain | Buy | 2025-12-17 |
| Citigroup | Maintain | Buy | 2025-11-10 |
| Jefferies | Maintain | Buy | 2025-10-09 |
| Mizuho | Maintain | Outperform | 2025-08-08 |
| Mizuho | Maintain | Outperform | 2025-07-18 |
| Barclays | Maintain | Overweight | 2025-05-30 |
| Citigroup | Maintain | Buy | 2025-05-16 |
| UBS | Upgrade | Buy | 2025-04-28 |
| Barclays | Maintain | Overweight | 2025-04-22 |
Evergy’s grades mostly fall into Buy and Outperform categories, with a recent downgrade to Neutral by Mizuho, reflecting generally positive sentiment with some caution.
Which company has the best grades?
Evergy, Inc. has received generally stronger grades, predominantly Buy and Outperform, compared to Exelon’s mix of Neutral and Underweight ratings. This suggests Evergy is viewed as having better growth prospects or stability, which could influence investor confidence and portfolio decisions.
Strengths and Weaknesses
Below is a comparison table summarizing the key strengths and weaknesses of Exelon Corporation (EXC) and Evergy, Inc. (EVRG) based on their latest financial and operational data.
| Criterion | Exelon Corporation (EXC) | Evergy, Inc. (EVRG) |
|---|---|---|
| Diversification | Highly diversified across multiple utility segments with revenues spread among seven operating units, reducing single-market risk. | Less diversified, primarily focused on electric utility segment, increasing exposure to regional market conditions. |
| Profitability | Moderate net margin of 10.7%, but ROIC (3.9%) below WACC (5.0%), indicating value destruction despite improving ROIC trend. | Higher net margin of 15.0%, but ROIC (4.5%) still below WACC (5.4%), also shedding value though profitability rising. |
| Innovation | ROIC trend shows significant improvement (approx. +100%), suggesting growing operational efficiency and potential innovation impact. | ROIC trend growing (+19%), indicating gradual improvement but less dynamic than EXC. |
| Global presence | Operates mainly in U.S. regional markets, with broad footprint across several states, but limited international exposure. | Primarily regional U.S. presence, focused on electric utilities in specific Midwestern states. |
| Market Share | Strong market share in key markets with established utilities like Commonwealth Edison and Pepco Holdings. | More concentrated market share in regional electric utilities, with less scale compared to EXC. |
Key takeaways: Exelon benefits from greater diversification and a faster-improving profitability trend but still destroys value overall. Evergy has better current margins but less diversification and slower ROIC improvement. Both companies face challenges generating returns above their cost of capital, warranting cautious investment consideration.
Risk Analysis
Below is a comparison of key risks for Exelon Corporation (EXC) and Evergy, Inc. (EVRG) based on 2024 data:
| Metric | Exelon Corporation (EXC) | Evergy, Inc. (EVRG) |
|---|---|---|
| Market Risk | Beta 0.556 (low volatility) | Beta 0.646 (moderate volatility) |
| Debt level | Debt-to-Equity 1.73 (high) | Debt-to-Equity 1.41 (high) |
| Regulatory Risk | High (regulated electric sector) | High (regulated electric sector) |
| Operational Risk | Moderate (diverse generation mix) | Moderate (coal and renewables mix) |
| Environmental Risk | Elevated (nuclear and fossil assets) | Elevated (coal, natural gas, renewables) |
| Geopolitical Risk | Moderate (US/Canada operations) | Moderate (US Midwest focus) |
Both companies face significant regulatory and environmental risks inherent in the regulated electric utilities sector. Their leverage is relatively high, signaling financial risk that requires cautious management. Market risk is moderate, with EXC showing slightly lower stock volatility. Environmental risk is notable due to reliance on fossil fuels and nuclear generation. The most impactful risks are regulatory changes and environmental liabilities, which could affect operations and profitability. Both firms’ Altman Z-scores place them in the distress zone, highlighting financial vulnerability despite average Piotroski scores. Investors should weigh these risks carefully when considering inclusion in their portfolio.
Which Stock to Choose?
Exelon Corporation (EXC) shows a generally favorable income statement with 64% positive metrics, including strong net margin and profitability growth, but faces slightly unfavorable financial ratios and a moderate rating. Its debt levels are moderate, and it is shedding value despite a growing ROIC trend.
Evergy, Inc. (EVRG) presents a favorable income statement with 79% positive indicators and a slightly better net margin than EXC. It shares a similar slightly unfavorable financial ratio profile, a moderate overall rating, and also exhibits value destruction with improving profitability.
For investors prioritizing growth and stronger income statement momentum, EVRG’s higher revenue and earnings growth might appear more appealing, while those valuing stable dividend yield and consistent profitability growth could find EXC’s profile suggestive of potential. Both companies show risks in financial ratios and value creation, indicating cautious interpretation depending on risk tolerance and investment strategy.
Disclaimer: Investment carries a risk of loss of initial capital. The past performance is not a reliable indicator of future results. Be sure to understand risks before making an investment decision.
Go Further
I encourage you to read the complete analyses of Exelon Corporation and Evergy, Inc. to enhance your investment decisions: