In the dynamic world of regulated electric utilities, Eversource Energy (ES) and Evergy, Inc. (EVRG) stand out as key players driving energy delivery and innovation across the US. Both companies operate extensive transmission and distribution networks, emphasizing renewable integration and customer service. Their overlapping markets and strategic approaches make them ideal candidates for comparison. Join me as we explore which company presents the most compelling investment opportunity in 2026.
Table of contents
Companies Overview
I will begin the comparison between Eversource Energy and Evergy, Inc. by providing an overview of these two companies and their main differences.
Eversource Energy Overview
Eversource Energy is a public utility holding company focused on energy delivery in the northeastern United States. It operates through electric distribution, electric transmission, natural gas distribution, and water distribution segments. The company serves a diverse customer base across Connecticut, Massachusetts, and New Hampshire, emphasizing regulated utility services in electricity, natural gas, and water.
Evergy, Inc. Overview
Evergy, Inc. is a utility company engaged in the generation, transmission, distribution, and sale of electricity primarily in Kansas and Missouri. Its energy sources include coal, hydroelectric, landfill gas, uranium, natural gas, oil, and renewables such as solar and wind. Evergy serves over 1.6M customers, including residential, commercial, industrial, and municipal sectors, with extensive transmission and distribution infrastructure.
Key similarities and differences
Both companies operate in the regulated electric utility sector and provide electricity distribution and transmission services. Eversource diversifies into natural gas and water utilities, while Evergy focuses more on electricity generation from various sources including renewables. Eversource serves a smaller regional market with about 10K employees compared to Evergy’s larger customer base but fewer employees. Their geographic focus and energy mix differentiate their business models.
Income Statement Comparison
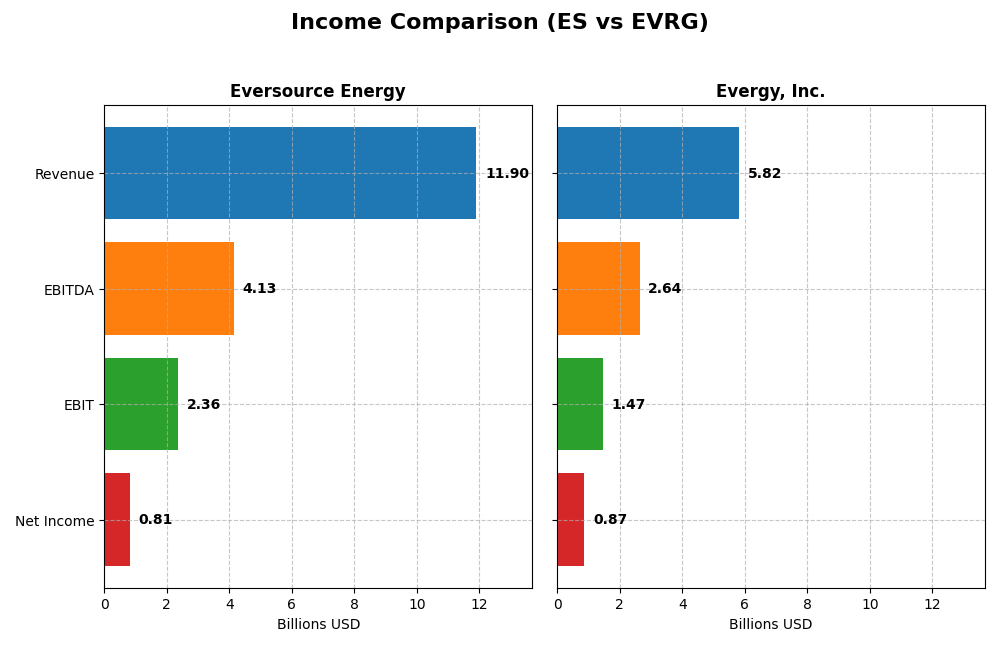
Below is a side-by-side comparison of key income statement metrics for Eversource Energy and Evergy, Inc. for the fiscal year 2024.
| Metric | Eversource Energy | Evergy, Inc. |
|---|---|---|
| Market Cap | 24.99B | 16.76B |
| Revenue | 11.90B | 5.82B |
| EBITDA | 4.13B | 2.64B |
| EBIT | 2.36B | 1.47B |
| Net Income | 812M | 874M |
| EPS | 2.27 | 3.79 |
| Fiscal Year | 2024 | 2024 |
Income Statement Interpretations
Eversource Energy
Eversource Energy’s revenue showed a modest overall growth of 33.65% from 2020 to 2024 but declined slightly by 0.08% in the last year. Net income experienced a downward trend overall (-32.65%), though it rebounded strongly in 2024, reflecting favorable margin improvements. Gross margin remained stable at 31.12%, while EBIT and net margins improved significantly in the most recent year, indicating a recovery in profitability despite revenue softness.
Evergy, Inc.
Evergy exhibited steady revenue growth of 18.53% over the five-year period, with a 6.17% increase in 2024. Net income rose by 41.27% overall, supported by consistent margin expansion. The company maintained a favorable gross margin of 32.57% and an EBIT margin of 25.26%. The recent year saw continued margin improvement and solid EPS growth of 19.56%, signaling strengthening operational efficiency and profitability.
Which one has the stronger fundamentals?
Evergy presents stronger fundamentals with consistent revenue and net income growth accompanied by expanding margins over the entire period and the past year. Eversource, while showing a solid revenue base, faced net income declines over time and only recently improved profitability. Both companies have favorable income statement evaluations, but Evergy’s more balanced growth and margin stability indicate comparatively stronger financial health.
Financial Ratios Comparison
Below is a comparison of key financial ratios for Eversource Energy (ES) and Evergy, Inc. (EVRG) based on their most recent fiscal year 2024 data.
| Ratios | Eversource Energy (ES) | Evergy, Inc. (EVRG) |
|---|---|---|
| ROE | 5.40% | 8.77% |
| ROIC | 3.18% | 4.52% |
| P/E | 25.29 | 16.23 |
| P/B | 1.37 | 1.42 |
| Current Ratio | 0.76 | 0.50 |
| Quick Ratio | 0.67 | 0.27 |
| D/E (Debt to Equity) | 1.94 | 1.41 |
| Debt-to-Assets | 48.9% | 43.6% |
| Interest Coverage | 2.43 | 2.57 |
| Asset Turnover | 0.20 | 0.18 |
| Fixed Asset Turnover | 0.29 | 0.23 |
| Payout Ratio | 124.3% | 68.3% |
| Dividend Yield | 4.91% | 4.21% |
Interpretation of the Ratios
Eversource Energy
Eversource Energy shows a mixed ratio profile with several unfavorable indicators, including a low return on equity (5.4%) and return on invested capital (3.18%), alongside weak liquidity ratios (current ratio 0.76, quick ratio 0.67). Its price-to-earnings ratio is relatively high at 25.29, signaling potential overvaluation. Dividend yield is favorable at 4.91%, supported by consistent payouts, but coverage by free cash flow is negative, which could signal sustainability concerns.
Evergy, Inc.
Evergy presents a stronger net margin (15%) and a slightly better return on equity (8.77%) than Eversource, though its return on invested capital remains unfavorable at 4.52%. Liquidity ratios are weaker (current ratio 0.5, quick ratio 0.27), and debt metrics show moderate risk. The dividend yield at 4.21% is favorable, but free cash flow yield is negative, raising questions about long-term dividend coverage.
Which one has the best ratios?
Comparing the two, Evergy has a more favorable net margin and a better overall balance of positive to negative ratios, receiving a slightly unfavorable global opinion versus Eversource’s unfavorable rating. Both companies face liquidity and cash flow challenges, but Evergy’s valuation and profitability metrics appear somewhat stronger in this context.
Strategic Positioning
This section compares the strategic positioning of Eversource Energy and Evergy, Inc. regarding market position, key segments, and exposure to technological disruption:
Eversource Energy
- Larger market cap at $25B; operates under moderate competitive pressure in regulated electric utilities.
- Diversified segments including electric distribution, transmission, natural gas, water, and solar power.
- Operates solar power facilities and regulated water utilities; no explicit mention of disruption risks.
Evergy, Inc.
- Smaller market cap at $16.8B; operates in regulated electric utilities with moderate competitive pressure.
- Focused on electricity generation, transmission, and distribution across multiple fuel sources including renewables.
- Generates electricity with diverse sources including renewables; no explicit mention of disruption risks.
Eversource Energy vs Evergy, Inc. Positioning
Eversource Energy adopts a diversified approach across utilities including water and gas, providing varied revenue streams. Evergy concentrates on electric generation and transmission with a mix of fuel sources. Diversification offers risk spreading; concentration may focus operational efficiency.
Which has the best competitive advantage?
Both companies are shedding value with ROIC below WACC; however, Evergy has a slightly unfavorable moat with growing profitability, while Eversource faces a very unfavorable moat with declining returns, indicating weaker competitive advantage.
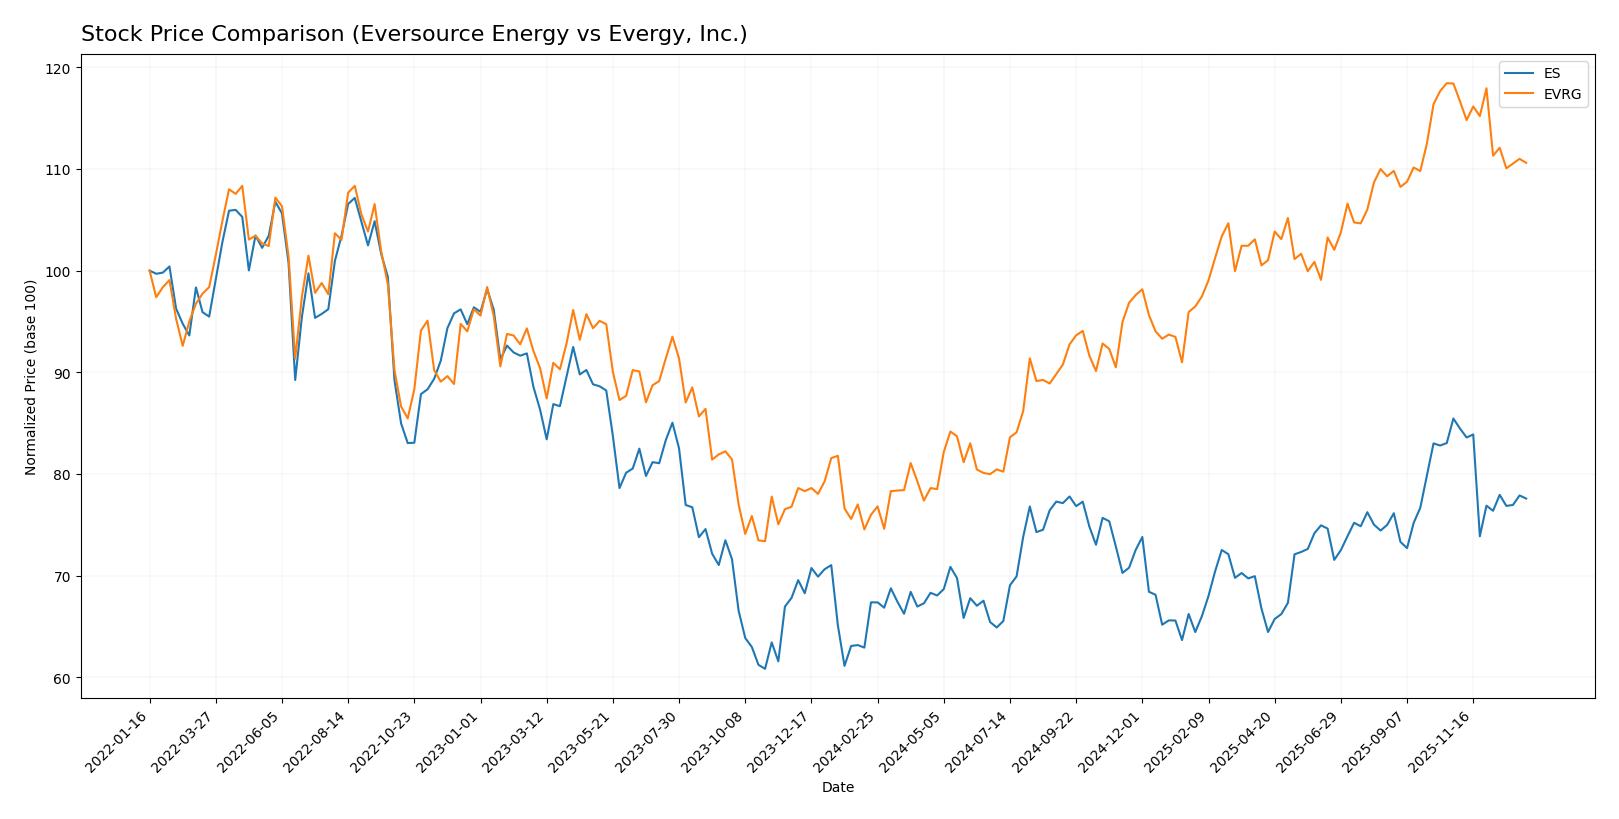
Stock Comparison
Over the past 12 months, Eversource Energy and Evergy, Inc. exhibited notable bullish trends with decelerating growth, reaching highs of 74.67 and 77.98 respectively, followed by recent downward corrections in their stock prices.
Trend Analysis
Eversource Energy’s stock rose by 15.15% over the past year, showing a bullish trend with deceleration. The price fluctuated between 55.63 and 74.67, with recent months marking a 9.21% decline and increased selling pressure.
Evergy, Inc. demonstrated a stronger bullish trend with a 45.55% gain over the same period, also with deceleration. The stock varied from 49.12 to 77.98, but recently dropped 6.59%, experiencing seller dominance in volume.
Comparing both stocks, Evergy, Inc. delivered the highest market performance with a 45.55% increase over the past year, outperforming Eversource Energy’s 15.15% gain.
Target Prices
The consensus target prices for Eversource Energy and Evergy, Inc. reflect moderate upside potential based on analyst expectations.
| Company | Target High | Target Low | Consensus |
|---|---|---|---|
| Eversource Energy | 81 | 60 | 68 |
| Evergy, Inc. | 93 | 76 | 82.67 |
Analysts expect Eversource Energy’s price to be slightly above its current 67.79 USD, while Evergy, Inc. shows potential upside from the current 72.82 USD, indicating positive but cautious outlooks.
Analyst Opinions Comparison
This section compares analysts’ ratings and grades for Eversource Energy and Evergy, Inc.:
Rating Comparison
Eversource Energy Rating
- Rating: C+ indicating a very favorable overall assessment.
- Discounted Cash Flow Score: 1, considered very unfavorable.
- ROE Score: 3, a moderate rating showing efficient profit use.
- ROA Score: 3, moderate, indicating effective asset use.
- Debt To Equity Score: 1, very unfavorable indicating higher risk.
- Overall Score: 2, moderate financial standing.
Evergy, Inc. Rating
- Rating: B- indicating a very favorable overall assessment.
- Discounted Cash Flow Score: 1, considered very unfavorable.
- ROE Score: 3, a moderate rating showing efficient profit use.
- ROA Score: 3, moderate, indicating effective asset use.
- Debt To Equity Score: 2, moderate showing better financial stability.
- Overall Score: 2, moderate financial standing.
Which one is the best rated?
Evergy, Inc. holds a higher rating of B- compared to Eversource Energy’s C+, both with moderate overall scores. Evergy’s moderately better debt-to-equity score slightly improves its financial stability profile.
Scores Comparison
Here is a comparison of the Altman Z-Score and Piotroski Score for the two companies:
ES Scores
- Altman Z-Score: 0.75, indicating financial distress zone risk.
- Piotroski Score: 6, reflecting average financial strength.
EVRG Scores
- Altman Z-Score: 0.82, indicating financial distress zone risk.
- Piotroski Score: 5, reflecting average financial strength.
Which company has the best scores?
Both ES and EVRG are in the financial distress zone according to their Altman Z-Scores, with ES slightly lower. ES has a marginally higher Piotroski Score than EVRG, indicating a somewhat stronger financial condition based on these metrics.
Grades Comparison
Here is a comparison of the recent grades issued by reputable financial institutions for both companies:
Eversource Energy Grades
The table below shows the latest grades and rating actions from established grading companies for Eversource Energy:
| Grading Company | Action | New Grade | Date |
|---|---|---|---|
| UBS | Maintain | Neutral | 2025-12-17 |
| JP Morgan | Maintain | Underweight | 2025-12-12 |
| Janney Montgomery Scott | Upgrade | Buy | 2025-11-24 |
| Scotiabank | Maintain | Sector Underperform | 2025-11-20 |
| Mizuho | Downgrade | Neutral | 2025-11-20 |
| Wells Fargo | Downgrade | Equal Weight | 2025-11-20 |
| UBS | Downgrade | Neutral | 2025-11-06 |
| BMO Capital | Maintain | Market Perform | 2025-11-06 |
| Scotiabank | Maintain | Sector Underperform | 2025-11-06 |
| Mizuho | Maintain | Outperform | 2025-10-27 |
Eversource Energy’s grades show a mix of neutral to cautious views, with several downgrades and a consistent consensus leaning towards holding the stock.
Evergy, Inc. Grades
The following table presents the recent grades and rating actions from credible grading firms for Evergy, Inc.:
| Grading Company | Action | New Grade | Date |
|---|---|---|---|
| Mizuho | Downgrade | Neutral | 2025-12-18 |
| UBS | Maintain | Buy | 2025-12-17 |
| Citigroup | Maintain | Buy | 2025-11-10 |
| Jefferies | Maintain | Buy | 2025-10-09 |
| Mizuho | Maintain | Outperform | 2025-08-08 |
| Mizuho | Maintain | Outperform | 2025-07-18 |
| Barclays | Maintain | Overweight | 2025-05-30 |
| Citigroup | Maintain | Buy | 2025-05-16 |
| UBS | Upgrade | Buy | 2025-04-28 |
| Barclays | Maintain | Overweight | 2025-04-22 |
Evergy, Inc. has predominantly received buy and outperform ratings, indicating generally positive sentiment from analysts.
Which company has the best grades?
Evergy, Inc. has received stronger and more consistent buy and outperform grades compared to Eversource Energy, which has a more mixed and cautious rating profile. This difference may influence investors seeking growth or higher conviction buy signals.
Strengths and Weaknesses
The table below compares key strengths and weaknesses of Eversource Energy (ES) and Evergy, Inc. (EVRG) based on recent financial and operational data.
| Criterion | Eversource Energy (ES) | Evergy, Inc. (EVRG) |
|---|---|---|
| Diversification | Highly diversified with electric distribution, transmission, natural gas, water segments | Focused mainly on electric utility segment |
| Profitability | Neutral net margin (6.82%), unfavorable ROIC (3.18%), declining profitability | Favorable net margin (15%), improving ROIC (4.52%) but still below cost of capital |
| Innovation | Limited information, moderate innovation implied by stable segments | Limited innovation focus, traditional utility model |
| Global presence | Primarily US-based with regional focus | US regional presence only |
| Market Share | Strong in electric distribution with $9.07B revenue | Moderate market share, smaller revenue base ($2.7B electric utility segment) |
Key takeaways: Eversource Energy offers better diversification but struggles with profitability and efficiency. Evergy shows improving profitability though still slightly unfavorable, with a narrower focus. Both require caution given their challenges in value creation and financial health indicators.
Risk Analysis
The table below outlines key risks associated with Eversource Energy (ES) and Evergy, Inc. (EVRG) based on their latest financial and operational data for 2024.
| Metric | Eversource Energy (ES) | Evergy, Inc. (EVRG) |
|---|---|---|
| Market Risk | Moderate (Beta 0.77, regulated utility sector) | Moderate (Beta 0.65, regional utility focus) |
| Debt level | High (Debt/Equity 1.94, interest coverage 2.12) | Elevated (Debt/Equity 1.41, interest coverage 2.61) |
| Regulatory Risk | Significant (subject to state regulations in MA, CT, NH) | Significant (regulated in KS and MO) |
| Operational Risk | Moderate (asset turnover low, infrastructure maintenance) | Moderate (large transmission network, asset turnover low) |
| Environmental Risk | Increasing pressure on fossil fuel use, transition to renewables | Similar pressure; mix of coal and renewables presents transition risk |
| Geopolitical Risk | Low (domestic US operations) | Low (domestic US operations) |
Eversource exhibits higher financial leverage and weaker liquidity ratios, increasing risk in a rising interest rate environment. Evergy’s diversified generation mix and slightly better leverage metrics offer moderate risk mitigation. Both face regulatory and environmental transition challenges, the most impactful risks given the evolving energy policies and decarbonization goals.
Which Stock to Choose?
Eversource Energy (ES) shows a favorable income statement with strong EBIT and net margin growth in 2024, but overall declining net income and profitability over 2020-2024. Financial ratios reveal mostly unfavorable metrics, with high debt levels and weak liquidity, despite a decent dividend yield. The company’s MOAT evaluation is very unfavorable, indicating value destruction with declining ROIC. The rating stands at C+ with moderate scores, and financial distress risk is elevated per Altman Z-Score.
Evergy, Inc. (EVRG) reports a favorable income statement with solid growth in revenue, net income, and margins over both the recent year and the overall period. Its financial ratios are slightly more favorable than ES, showing better net margin and dividend yield, though still with moderate debt and liquidity concerns. The MOAT is slightly unfavorable due to ROIC below WACC, but with improving profitability. The rating is higher at B-, with moderate scores and a similar financial distress risk level.
For investors prioritizing growth and improving profitability, Evergy may appear more favorable given its stronger income growth and improving MOAT trend. Conversely, investors focusing on dividend yield and stable income might interpret Eversource’s high dividend and favorable income statement elements as attractive despite its financial challenges. Overall, the choice could depend on the investor’s risk tolerance and strategy, with ES showing more financial headwinds and EVRG demonstrating a steadier profitability trajectory.
Disclaimer: Investment carries a risk of loss of initial capital. The past performance is not a reliable indicator of future results. Be sure to understand risks before making an investment decision.
Go Further
I encourage you to read the complete analyses of Eversource Energy and Evergy, Inc. to enhance your investment decisions: