Home > Comparison > Real Estate > ESS vs UDR
The strategic rivalry between Essex Property Trust, Inc. and UDR, Inc. shapes the dynamics of the U.S. residential REIT sector. Essex operates as a capital-intensive, West Coast-focused multifamily developer and manager, while UDR emphasizes broad market reach with a diversified portfolio and active redevelopment. This duel highlights contrasting growth models within residential real estate. This analysis aims to identify which trajectory offers superior risk-adjusted returns for a diversified portfolio in 2026.
Table of contents
Companies Overview
Essex Property Trust and UDR stand as prominent players in the competitive US residential REIT market.
Essex Property Trust, Inc.: West Coast Multifamily Specialist
Essex Property Trust dominates the West Coast residential REIT sector. It generates revenue through acquiring, developing, and managing approximately 60,000 multifamily units across 246 communities. In 2026, Essex strategically focuses on expanding its portfolio through active development projects and selective acquisitions to strengthen its market position and capitalize on regional demand.
UDR, Inc.: National Multifamily REIT with Diverse Holdings
UDR, Inc. operates as a leading multifamily REIT with a broad US footprint. It earns income by managing, buying, selling, and developing 51,649 apartment homes, including over 1,000 units under development. UDR’s 2026 strategy emphasizes delivering dependable returns through disciplined asset management and enhancing resident services to sustain long-term shareholder value.
Strategic Collision: Similarities & Divergences
Both REITs share a core focus on multifamily residential properties but diverge in geographic scope—Essex concentrates on West Coast markets while UDR spans multiple US regions. Their primary battleground is tenant retention and development efficiency amid rising housing demand. Essex’s concentrated portfolio contrasts with UDR’s diversified approach, shaping distinct risk profiles for investors seeking regional concentration versus national scale.
Income Statement Comparison
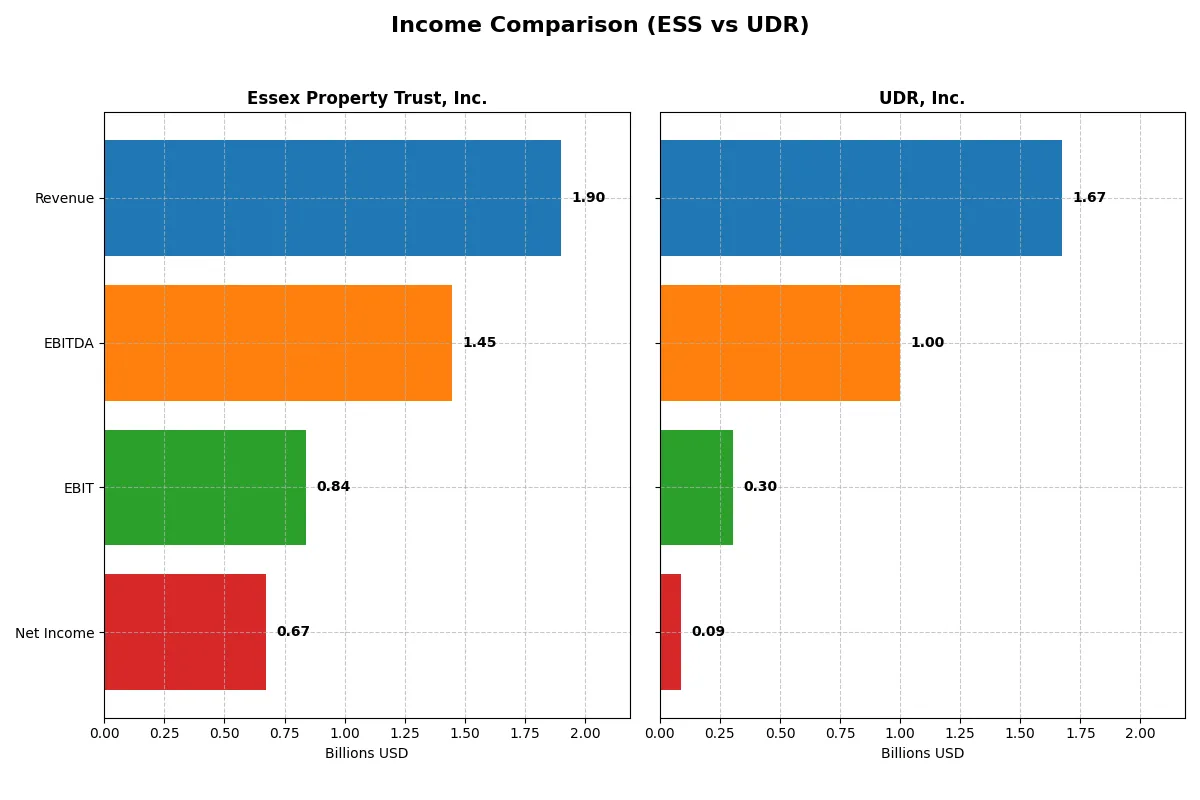
This data dissects the core profitability and scalability of both corporate engines to reveal who dominates the bottom line:
| Metric | Essex Property Trust, Inc. (ESS) | UDR, Inc. (UDR) |
|---|---|---|
| Revenue | 1.90B | 1.67B |
| Cost of Revenue | 593M | 1.25B |
| Operating Expenses | 474M | 132M |
| Gross Profit | 1.31B | 417M |
| EBITDA | 1.45B | 1.00B |
| EBIT | 838M | 305M |
| Interest Expense | 257M | 208M |
| Net Income | 672M | 85M |
| EPS | 10.41 | 0.26 |
| Fiscal Year | 2025 | 2024 |
Income Statement Analysis: The Bottom-Line Duel
This income statement comparison reveals the true efficiency and profitability of Essex Property Trust, Inc. and UDR, Inc. through recent financial performance.
Essex Property Trust, Inc. Analysis
Essex’s revenue climbed steadily from 1.44B in 2021 to 1.90B in 2025, with net income rising from 489M to 672M. Its gross margin remains robust at 68.8%, driving a strong net margin of 35.4%. Despite a slight decline in EBIT and net margin in 2025, Essex sustains excellent profitability and operational efficiency.
UDR, Inc. Analysis
UDR’s revenue expanded from 1.29B in 2021 to 1.67B in 2024, while net income grew from 150M to 85M, reflecting recent pressure on earnings. Gross margin is weaker at 24.9%, with a net margin of just 5.4%. UDR faces significant EBIT and net margin contraction in 2024, signaling challenges in cost control and profitability momentum.
Margin Power vs. Revenue Scale
Essex outperforms UDR with superior margins and stronger net income growth despite similar top-line expansion. Essex’s high gross and net margins demonstrate better cost management and operational leverage. For investors prioritizing profitability and margin stability, Essex presents a more attractive profile than UDR’s pressured earnings and thinner margins.
Financial Ratios Comparison
These vital ratios act as a diagnostic tool to expose the underlying fiscal health, valuation premiums, and capital efficiency of the companies compared below:
| Ratios | Essex Property Trust, Inc. (ESS) | UDR, Inc. (UDR) |
|---|---|---|
| ROE | N/A | N/A |
| ROIC | N/A | N/A |
| P/E | 24.7 | 159.6 |
| P/B | 3.31 | 4.15 |
| Current Ratio | 0.66 | 0.39 |
| Quick Ratio | 0.66 | 0.39 |
| D/E | 1.20 | 1.75 |
| Debt-to-Assets | 0.51 | 0.55 |
| Interest Coverage | 3.24 | 1.37 |
| Asset Turnover | 0.14 | 0.15 |
| Fixed Asset Turnover | 34.4 | 8.94 |
| Payout ratio | 0.84 | 6.29 |
| Dividend yield | 3.38% | 3.94% |
| Fiscal Year | 2024 | 2024 |
Efficiency & Valuation Duel: The Vital Signs
Financial ratios serve as a company’s DNA, unveiling hidden risks and operational strengths that shape investor outcomes.
Essex Property Trust, Inc.
Essex shows a strong 35.4% net margin but zero return on equity, signaling weak profitability despite operational efficiency. Its 25.1 P/E suggests a stretched valuation relative to earnings. The company rewards shareholders with a 3.9% dividend yield, balancing moderate payout with prudent reinvestment.
UDR, Inc.
UDR posts a modest 5.4% net margin and a low 2.6% ROE, reflecting limited profitability. Its valuation is steep, with a P/E of 159.6 and a high 4.15 P/B ratio. UDR offers a 3.9% dividend yield but faces pressure from heavy debt and low interest coverage, raising concerns around financial resilience.
Premium Valuation vs. Operational Safety
Essex balances a reasonable valuation and attractive dividends against UDR’s stretched multiples and weaker profitability. Essex’s profile fits investors seeking operational stability with income, while UDR’s elevated risk appeals to those chasing growth despite financial stress.
Which one offers the Superior Shareholder Reward?
I see Essex Property Trust (ESS) delivers a 3.88% dividend yield with a high payout ratio near 97%, signaling strong free cash flow coverage but limited growth reinvestment. ESS also executes consistent buybacks, enhancing total returns. UDR, with a 3.94% yield and a payout ratio exceeding 120%, risks dividend sustainability given weaker free cash flow coverage. UDR’s buyback intensity is lower, reflecting more capital allocated to dividends over share repurchases. Historically, ESS’s balanced distribution via dividends and buybacks offers a more sustainable, superior shareholder reward in 2026.
Comparative Score Analysis: The Strategic Profile
The radar chart reveals the core financial DNA and trade-offs of Essex Property Trust and UDR, highlighting their competitive strengths and vulnerabilities:
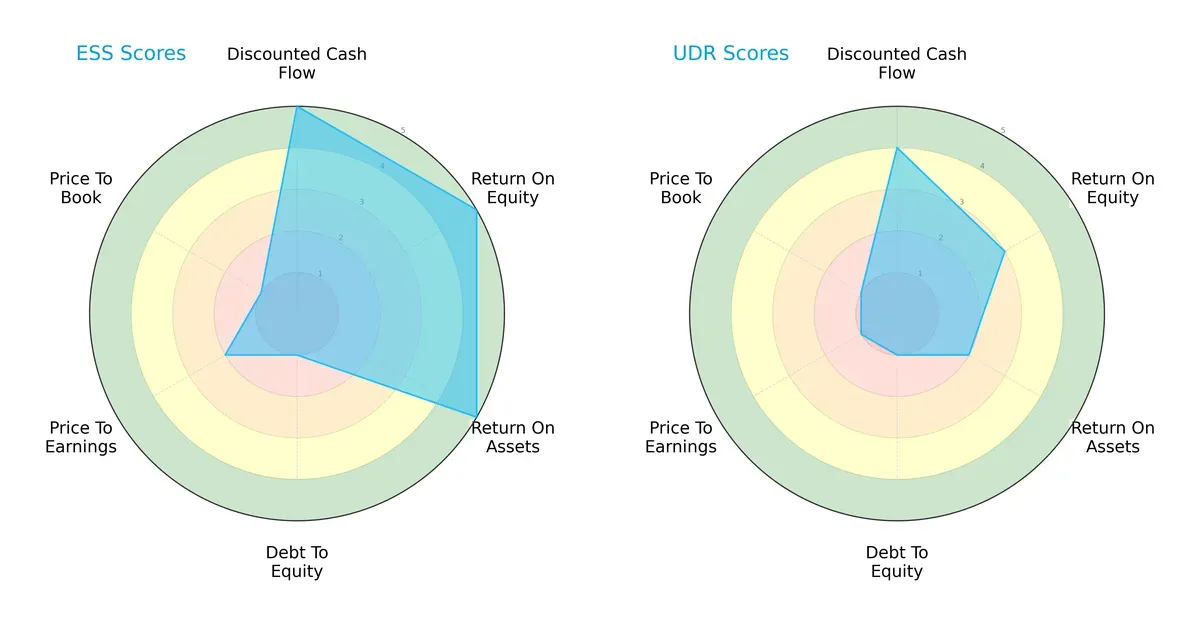
Essex dominates in profitability metrics with top scores in DCF, ROE, and ROA, showcasing efficient capital use and strong earnings generation. UDR trails with moderate returns and slightly better valuation scores but shares a critical weakness: both have poor debt-to-equity scores, signaling high leverage risk. Essex’s profile is more balanced on operating efficiency, while UDR leans on valuation metrics but remains riskier overall.
Bankruptcy Risk: Solvency Showdown
The Altman Z-Score gap signals a solvency warning for both firms in this cycle:
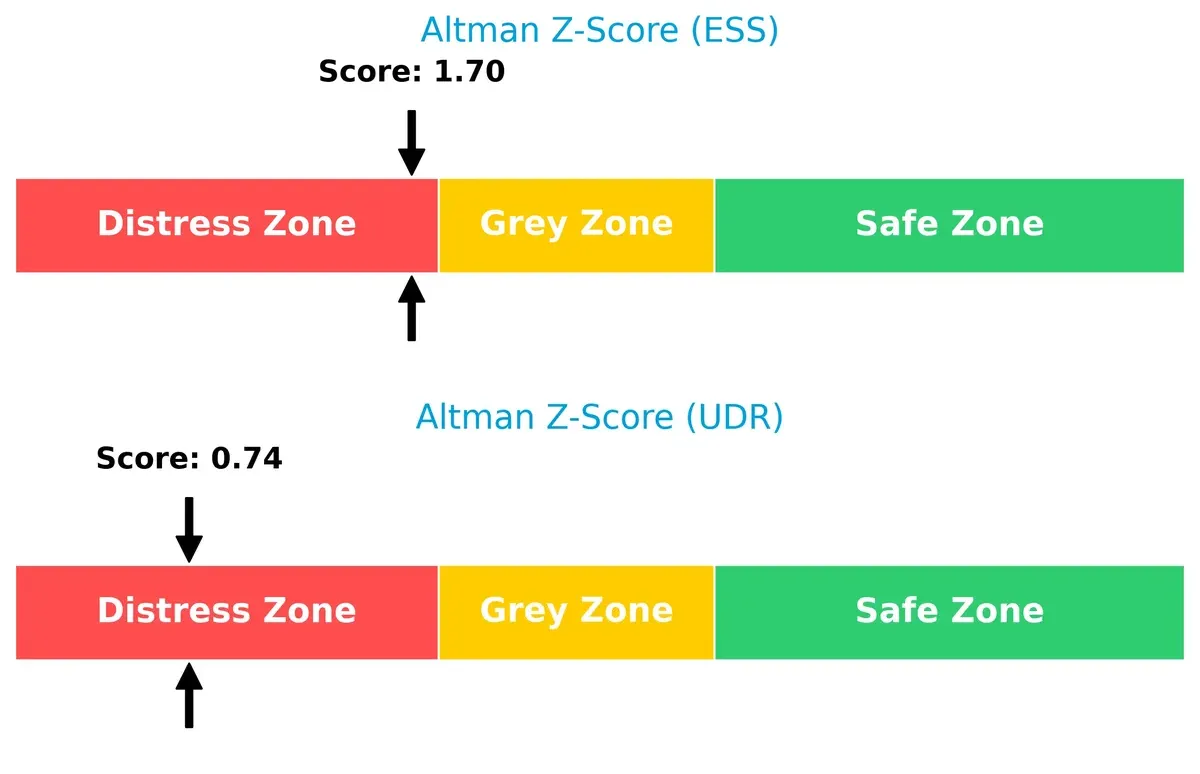
Essex scores 1.7, while UDR languishes at 0.7—both deep in distress territory. This exposes heightened bankruptcy risks amid economic headwinds. Historically, firms below 1.8 require urgent deleveraging to survive downturns. Essex’s relatively higher score suggests slightly better resilience but neither is safe.
Financial Health: Quality of Operations
Piotroski F-Scores show operational strength but no margin for complacency:
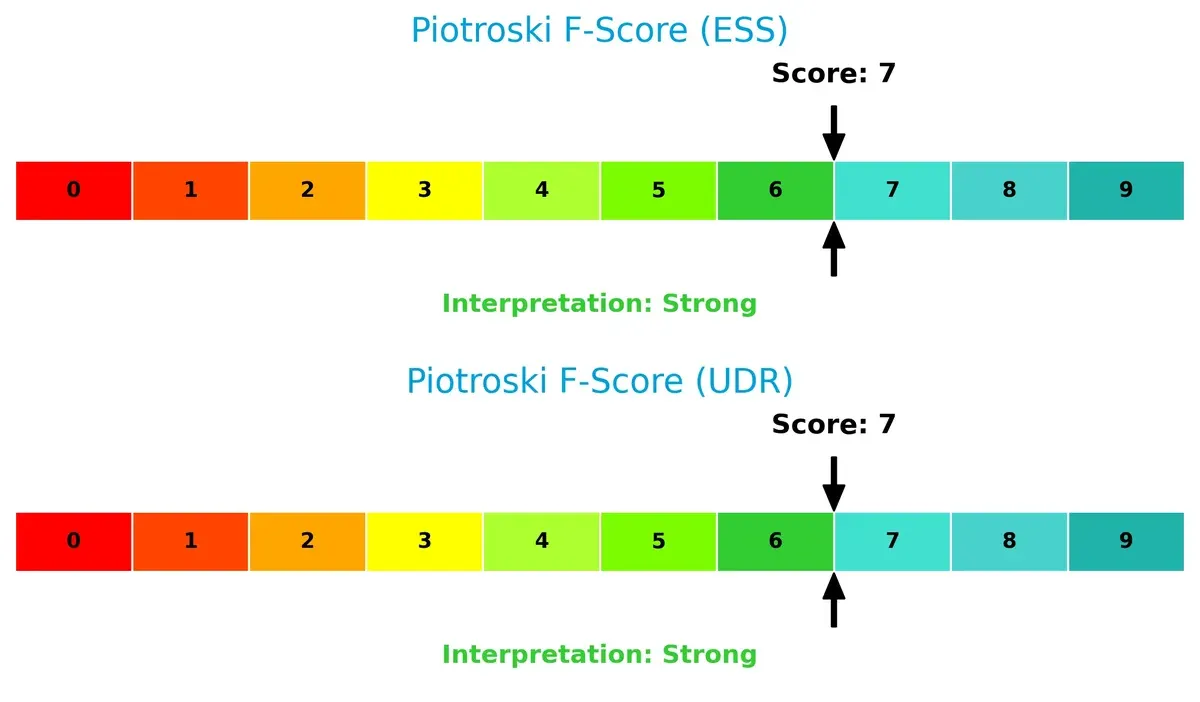
Both companies earn a solid 7 out of 9, reflecting strong internal financial health. This indicates robust profitability, liquidity, and efficiency metrics. However, investors should watch for any deterioration, especially given their fragile solvency positions. Neither firm displays red flags here, but prudence is essential.
How are the two companies positioned?
This section dissects the operational DNA of Essex and UDR by comparing their revenue distribution and internal dynamics. The goal is to confront their economic moats to reveal which model offers the most resilient competitive advantage today.
Revenue Segmentation: The Strategic Mix
This visual comparison dissects how Essex Property Trust and UDR diversify their income streams and where their primary sector bets lie:
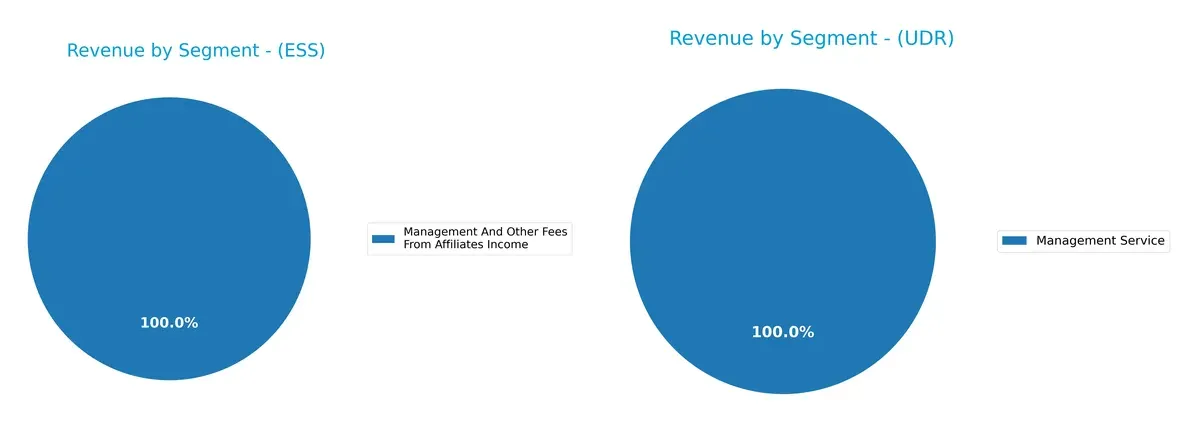
Essex Property Trust anchors nearly all revenue in “Rental And Other Property Revenues” at $1.28B, with minor $11M fees from affiliates, showing high concentration. UDR’s latest data focuses mainly on “Management Service” at $6.8M, lacking broader segment detail. Essex’s reliance on rental income signals infrastructure dominance but heightens market cycle risk. UDR’s narrower data restricts full diversification assessment but suggests less scale in dominant segments.
Strengths and Weaknesses Comparison
This table compares the strengths and weaknesses of Essex Property Trust, Inc. and UDR, Inc.:
Essex Strengths
- High net margin at 35.38%
- Favorable debt-to-assets ratio
- Dividend yield at 3.88%
- Stable management fee income around $11M
- Strong regional presence in Northern and Southern California
UDR Strengths
- Favorable weighted average cost of capital (5.91%)
- High fixed asset turnover of 8.94
- Dividend yield at 3.94%
- Diversified geographic presence across multiple US regions
- Increasing management service revenue up to $6.8M
Essex Weaknesses
- Zero return on equity and ROIC
- Unfavorable PE ratio (25.08)
- Poor liquidity ratios (current and quick ratios at 0)
- Unfavorable asset turnover ratios
- Limited geographic diversification mainly in California
UDR Weaknesses
- Low net margin (5.36%)
- Unfavorable ROE (2.6%) and ROIC (2.69%)
- High debt-to-equity (1.75) and debt-to-assets (55.14%)
- Poor liquidity ratios (current and quick at 0.39)
- Very high PE ratio (159.56)
- Unfavorable price-to-book (4.15)
- Low interest coverage (1.47)
Essex shows strong profitability and conservative leverage but suffers from poor liquidity and limited geographic reach. UDR offers asset efficiency and broader regional diversification but faces profitability challenges, high leverage, and valuation concerns. Each company’s strategic focus balances these trade-offs.
The Moat Duel: Analyzing Competitive Defensibility
A durable structural moat protects long-term profits from relentless competition and market pressures. Here’s how Essex Property Trust and UDR stack up:
Essex Property Trust, Inc.: Regional Focus with Scale Advantage
Essex leverages concentrated West Coast markets, creating a geographic moat. High margins and stable rents reflect operational efficiency. New developments could deepen market grip, though rising interest costs challenge profitability.
UDR, Inc.: Value Creation Amidst Expanding Footprint
UDR’s moat stems from diversified U.S. markets and steady portfolio growth. Despite current value shedding, improving ROIC signals operational gains. Expansion into emerging markets offers upside but requires prudent capital allocation.
Concentration vs. Diversification: The Battle of Moats
Essex’s focused regional dominance delivers higher margins but risks localized downturns. UDR’s broader diversification offers resilience with improving returns. I see UDR’s expanding and improving ROIC moat as better positioned to defend market share long term.
Which stock offers better returns?
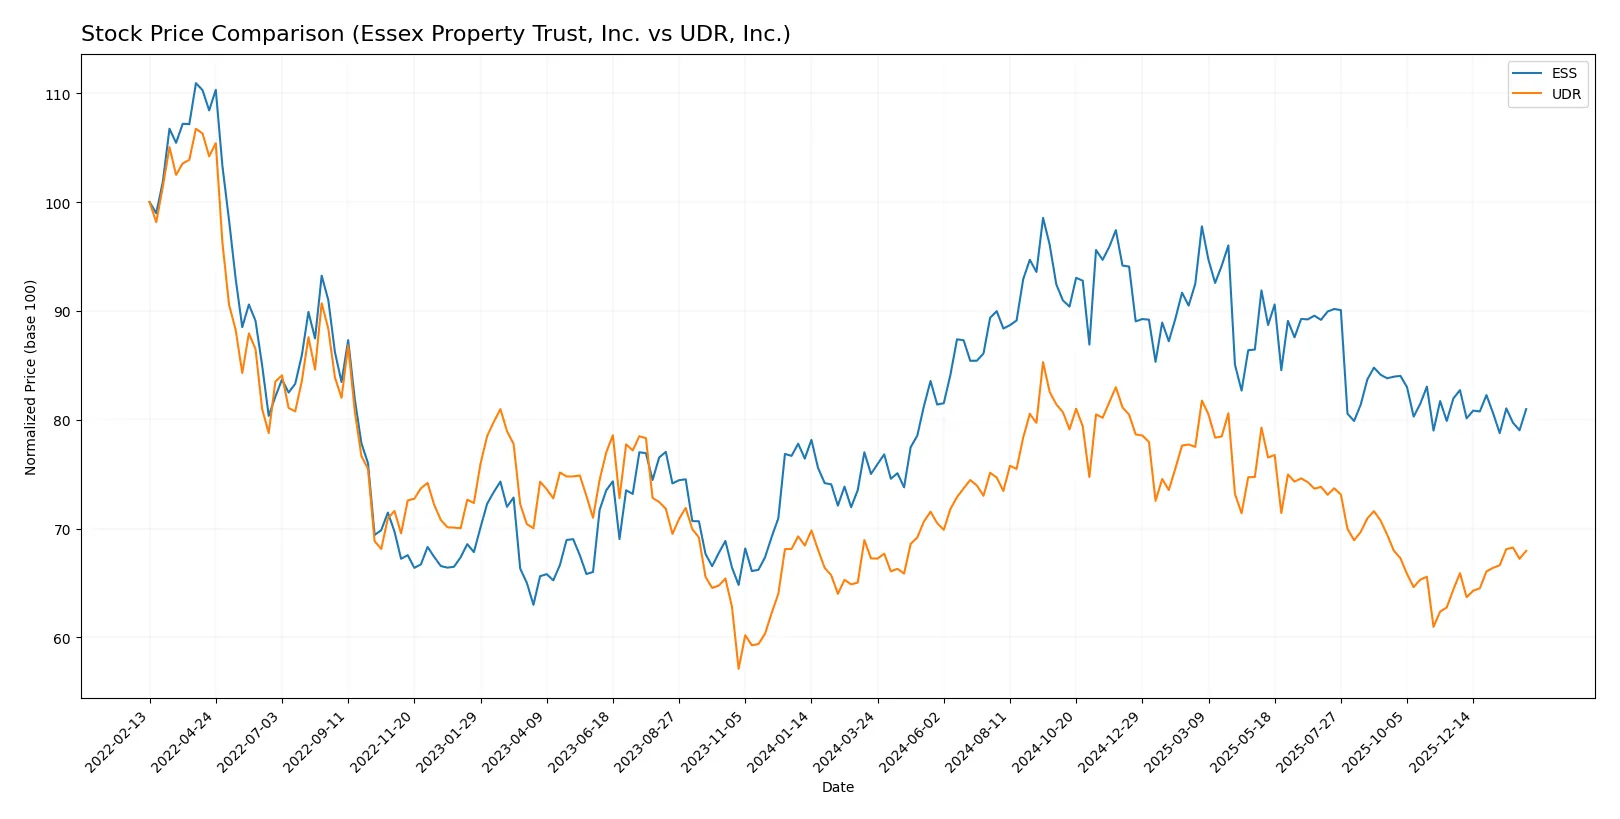
Over the past year, Essex Property Trust, Inc. and UDR, Inc. exhibited distinct price movements with diverging momentum and volume dynamics. Essex’s trend shows deceleration despite gains, while UDR accelerates on moderate growth.
Trend Comparison
Essex Property Trust, Inc. posted a 7.94% price increase over 12 months, signaling a bullish trend with decelerating momentum and a high volatility of 18.8%. The stock peaked at 314.05 and bottomed at 235.17.
UDR, Inc. gained 1.02% in the same period, also bullish but with accelerating momentum and lower volatility at 3.12%. The stock’s range extended from 33.69 to 47.13, showing steadier performance.
Essex outperformed UDR with higher total returns but faced recent mild weakness. UDR’s acceleration and strong buyer dominance suggest improving market confidence compared to Essex’s decelerating trend.
Target Prices
Analysts present a confident target price range for Essex Property Trust, Inc. and UDR, Inc., signaling moderate upside potential.
| Company | Target Low | Target High | Consensus |
|---|---|---|---|
| Essex Property Trust, Inc. | 271 | 292 | 280.4 |
| UDR, Inc. | 37 | 44.5 | 41.09 |
The consensus targets for Essex and UDR exceed their current prices by roughly 8.5% and 9.3%, respectively, indicating analysts expect steady appreciation in this resilient REIT sector.

Don’t Let Luck Decide Your Entry Point
Optimize your entry points with our advanced ProRealTime indicators. You’ll get efficient buy signals with precise price targets for maximum performance. Start outperforming now!
How do institutions grade them?
Here is a summary of the latest institutional grades for Essex Property Trust, Inc. and UDR, Inc.:
Essex Property Trust, Inc. Grades
The table below shows recent grades from reputable financial institutions for Essex Property Trust, Inc.:
| Grading Company | Action | New Grade | Date |
|---|---|---|---|
| BMO Capital | Downgrade | Market Perform | 2026-01-09 |
| UBS | Maintain | Neutral | 2026-01-08 |
| Jefferies | Downgrade | Hold | 2025-12-16 |
| Truist Securities | Maintain | Hold | 2025-12-16 |
| Barclays | Maintain | Equal Weight | 2025-11-25 |
| Mizuho | Maintain | Outperform | 2025-11-24 |
| UBS | Maintain | Neutral | 2025-11-10 |
| Wells Fargo | Maintain | Equal Weight | 2025-11-10 |
| Scotiabank | Maintain | Sector Outperform | 2025-11-04 |
| Evercore ISI Group | Maintain | In Line | 2025-11-03 |
UDR, Inc. Grades
The table below presents recent credible institutional ratings for UDR, Inc.:
| Grading Company | Action | New Grade | Date |
|---|---|---|---|
| Goldman Sachs | Maintain | Sell | 2026-01-20 |
| Truist Securities | Upgrade | Buy | 2026-01-20 |
| UBS | Maintain | Buy | 2026-01-08 |
| JP Morgan | Downgrade | Underweight | 2025-12-18 |
| Truist Securities | Maintain | Hold | 2025-12-01 |
| Barclays | Maintain | Overweight | 2025-11-25 |
| Mizuho | Maintain | Neutral | 2025-11-24 |
| Morgan Stanley | Maintain | Equal Weight | 2025-11-13 |
| Wells Fargo | Maintain | Overweight | 2025-11-10 |
| UBS | Maintain | Buy | 2025-11-10 |
Which company has the best grades?
UDR, Inc. holds more buy ratings and upgrades compared to Essex Property Trust, Inc., which features predominantly hold and neutral ratings. This contrast may influence investor sentiment and portfolio positioning differently for each stock.
Risks specific to each company
The following categories identify critical pressure points and systemic threats facing Essex Property Trust, Inc. and UDR, Inc. in the 2026 market environment:
1. Market & Competition
Essex Property Trust, Inc.
- Strong West Coast focus with 60K homes; faces intense regional competition and market saturation risks.
UDR, Inc.
- Diversified U.S. presence with 51.6K homes; competes in multiple markets but less concentration risk.
2. Capital Structure & Debt
Essex Property Trust, Inc.
- Favorable debt-to-equity ratio; moderate interest coverage at 3.26x supports financial stability.
UDR, Inc.
- High leverage with debt-to-equity of 1.75 and weak interest coverage at 1.47x raises refinancing concerns.
3. Stock Volatility
Essex Property Trust, Inc.
- Beta of 0.74 indicates lower volatility than market; stable trading range supports investor confidence.
UDR, Inc.
- Beta of 0.71 suggests similar volatility but wider trading volume may increase short-term swings.
4. Regulatory & Legal
Essex Property Trust, Inc.
- Subject to California’s strict housing regulations and rent control laws, heightening compliance risks.
UDR, Inc.
- Faces diverse regulatory environments across states, complicating compliance but reducing single-jurisdiction risk.
5. Supply Chain & Operations
Essex Property Trust, Inc.
- Active development of 6 properties; supply chain disruptions could delay projects in tight West Coast markets.
UDR, Inc.
- Larger development pipeline with 1,031 homes under construction; operational complexity may increase execution risk.
6. ESG & Climate Transition
Essex Property Trust, Inc.
- West Coast exposure intensifies climate risks such as wildfires and water shortages impacting property values.
UDR, Inc.
- Nationwide footprint diversifies climate risks but requires significant ESG resource allocation across regions.
7. Geopolitical Exposure
Essex Property Trust, Inc.
- Concentrated U.S. West Coast operations limit geopolitical risk but increase vulnerability to regional economic shifts.
UDR, Inc.
- Broader U.S. exposure dilutes regional geopolitical risks but remains fully exposed to national policy changes.
Which company shows a better risk-adjusted profile?
Essex Property Trust’s strongest risk is regulatory pressure from California’s housing laws, while UDR’s critical risk lies in its high leverage and weak debt metrics. Essex boasts a more favorable capital structure and lower stock volatility, signaling a stronger risk-adjusted profile. UDR’s excessive debt and interest coverage below 2x flag heightened financial vulnerability amid tightening credit conditions. This contrast, coupled with Essex’s superior dividend yield stability, justifies my preference for Essex on a risk-managed basis.
Final Verdict: Which stock to choose?
Essex Property Trust, Inc. (ESS) stands out as a cash-generating powerhouse with a strong operational margin and a favorable income growth trajectory. Its key point of vigilance is a declining ROIC trend, which may signal challenges in capital efficiency over time. ESS suits investors targeting aggressive growth with a tolerance for operational risks.
UDR, Inc. offers a strategic moat through consistent improvement in capital returns despite currently shedding value overall. Its stable dividend yield and growing ROIC trend provide a cushion of safety relative to Essex. UDR fits well within a GARP (Growth at a Reasonable Price) portfolio seeking steadier income and gradual value recovery.
If you prioritize robust cash flow and growth potential, Essex outshines with superior margins and income quality, albeit with caution around capital efficiency. However, if you seek better stability and income reliability, UDR offers a slightly safer profile backed by improving profitability metrics and a defensive dividend. Each presents an analytical scenario tailored to distinct investor appetites and risk tolerances.
Disclaimer: Investment carries a risk of loss of initial capital. The past performance is not a reliable indicator of future results. Be sure to understand risks before making an investment decision.
Go Further
I encourage you to read the complete analyses of Essex Property Trust, Inc. and UDR, Inc. to enhance your investment decisions: