Home > Comparison > Real Estate > ESS vs MAA
The strategic rivalry between Essex Property Trust, Inc. and Mid-America Apartment Communities, Inc. shapes the residential REIT sector’s evolution. Essex operates as a focused, West Coast multifamily property specialist, while Mid-America pursues a broad regional footprint across the Southeast and Mid-Atlantic. This head-to-head contrasts concentrated market expertise with geographic diversification. This analysis aims to identify which approach delivers superior risk-adjusted returns for a diversified real estate portfolio.

Table of contents
Companies Overview
Essex Property Trust and Mid-America Apartment Communities dominate the US residential REIT landscape with distinct regional footprints.
Essex Property Trust, Inc.: West Coast Residential Specialist
Essex Property Trust is a fully integrated REIT focusing on acquiring, developing, and managing multifamily residential properties primarily on the West Coast. Its core revenue comes from rental income across 246 apartment communities totaling about 60,000 units. In 2026, Essex emphasizes strategic development and redevelopment to sustain growth in high-demand urban markets.
Mid-America Apartment Communities, Inc.: Southeast and Southwest Residential Leader
Mid-America Apartment Communities operates as a diversified REIT owning and managing over 100,000 apartment units across 16 states in the Southeast, Southwest, and Mid-Atlantic. Its income is driven by residential rents and property appreciation. The company’s 2026 strategy focuses on full-cycle asset management and selective development to maximize shareholder returns.
Strategic Collision: Similarities & Divergences
Both firms operate as residential REITs but diverge in geographical focus—Essex targets the West Coast, while MAA covers the Southeast and Mid-Atlantic. Their philosophies contrast between Essex’s urban redevelopment and MAA’s broad regional diversification. Competition centers on capturing high-quality multifamily assets. Essex offers a concentrated growth profile; MAA delivers scale and geographic diversification, defining distinct investment appeals.
Income Statement Comparison
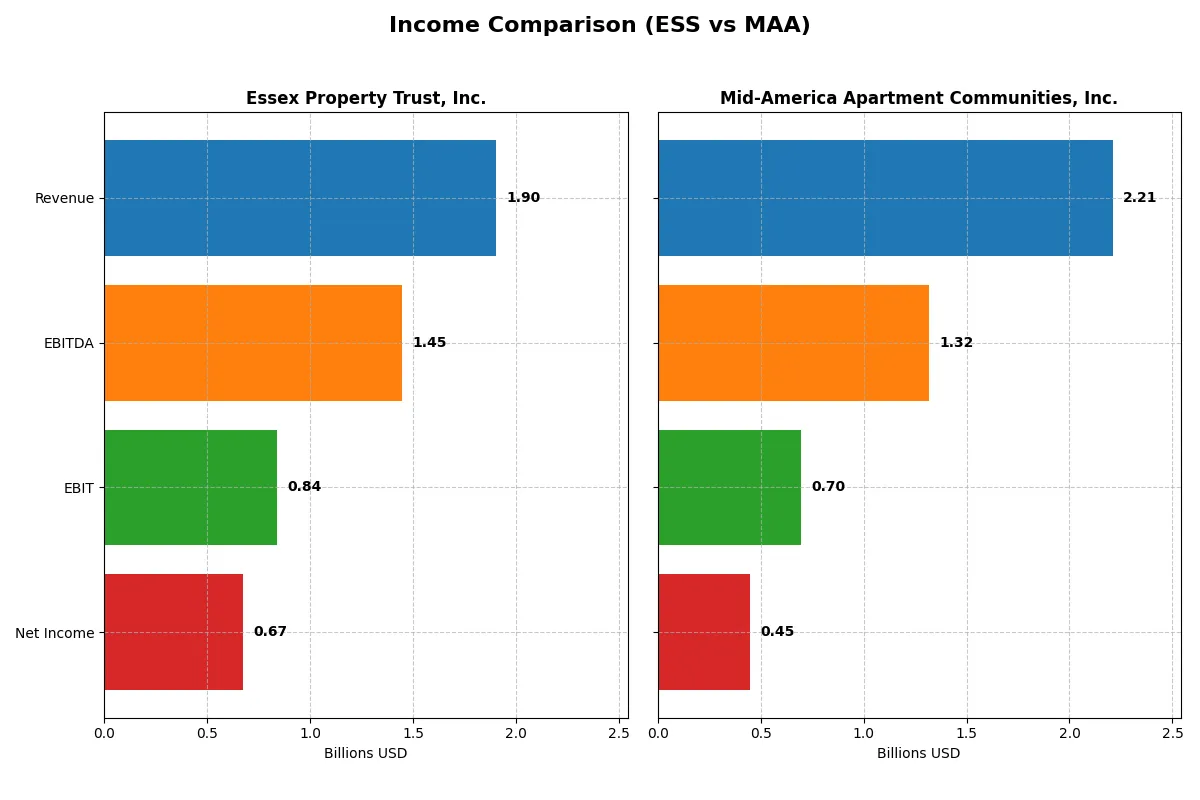
This data dissects the core profitability and scalability of both corporate engines to reveal who dominates the bottom line:
| Metric | Essex Property Trust, Inc. (ESS) | Mid-America Apartment Communities, Inc. (MAA) |
|---|---|---|
| Revenue | 1.90B | 2.21B |
| Cost of Revenue | 593M | 1.51B |
| Operating Expenses | 474M | 84M |
| Gross Profit | 1.31B | 703M |
| EBITDA | 1.45B | 1.32B |
| EBIT | 838M | 696M |
| Interest Expense | 257M | 185M |
| Net Income | 672M | 446M |
| EPS | 10.41 | 3.79 |
| Fiscal Year | 2025 | 2025 |
Income Statement Analysis: The Bottom-Line Duel
This income statement comparison reveals which company manages resources most efficiently and delivers stronger profitability over time.
Essex Property Trust, Inc. Analysis
Essex’s revenue climbed steadily from 1.44B in 2021 to 1.90B in 2025, with net income rising from 489M to 672M. Gross margin remains robust around 69%, reflecting strong cost control. Despite a recent dip in EBIT and net margin growth, Essex sustains high profitability and EPS growth, signaling resilient operational momentum.
Mid-America Apartment Communities, Inc. Analysis
Mid-America’s revenue grew modestly from 1.78B in 2021 to 2.21B in 2025, but net income declined from 530M to 444M. Gross margin hovers near 32%, substantially lower than Essex’s, indicating higher costs. EBIT and net margin contracted recently, reflecting pressure on profitability. The company faces challenges in sustaining earnings growth amid stable revenue.
Margin Strength vs. Revenue Expansion
Essex outperforms Mid-America through superior margins and consistent net income growth. Its 35% net margin dwarfs Mid-America’s 20%, despite the latter’s larger revenue base. Essex’s profitable growth profile suits investors prioritizing efficiency and earnings quality. Mid-America’s lower margins and declining net income represent a cautionary stance on its profitability trajectory.
Financial Ratios Comparison
These vital ratios act as a diagnostic tool to expose underlying fiscal health, valuation premiums, and capital efficiency for Essex Property Trust and Mid-America Apartment Communities:
| Ratios | Essex Property Trust (ESS) | Mid-America Apartment Communities (MAA) |
|---|---|---|
| ROE | 13.39% | 7.89% |
| ROIC | 5.61% | 10.18% |
| P/E | 24.72 | 36.36 |
| P/B | 3.31 | 2.87 |
| Current Ratio | 0.66 | 0.00 |
| Quick Ratio | 0.66 | 0.00 |
| D/E | 1.20 | 0.95 |
| Debt-to-Assets | 51.47% | 45.14% |
| Interest Coverage | 2.99 | 3.34 |
| Asset Turnover | 0.14 | 0.18 |
| Fixed Asset Turnover | 34.42 | 0.00 |
| Payout ratio | 83.67% | 158.65% |
| Dividend yield | 3.38% | 4.36% |
| Fiscal Year | 2025 | 2025 |
Efficiency & Valuation Duel: The Vital Signs
Ratios act as a company’s DNA, revealing hidden risks and operational excellence that raw numbers alone cannot expose.
Essex Property Trust, Inc.
Essex shows a strong net margin of 35.38%, signaling operational efficiency despite an unfavorable ROE and ROIC. The P/E of 25.08 suggests the stock is moderately valued but leans toward being stretched. A 3.88% dividend yield rewards shareholders, indicating steady cash returns rather than aggressive reinvestment.
Mid-America Apartment Communities, Inc.
Mid-America posts a lower net margin at 20.23%, yet boasts a remarkable ROIC of 1017.71%, highlighting capital efficiency. Its higher P/E of 36.36 flags an expensive valuation. The 4.36% dividend yield slightly exceeds Essex’s, reflecting a shareholder-friendly policy without sacrificing growth potential.
Premium Valuation vs. Operational Efficiency
Mid-America carries a premium valuation but demonstrates superior capital returns, while Essex offers higher profitability and reliable dividends at a lower price point. Investors prioritizing capital efficiency may lean toward Mid-America; those valuing margin strength and yield may prefer Essex’s profile.
Which one offers the Superior Shareholder Reward?
I observe Essex Property Trust (ESS) pays a 3.9% dividend yield with a high payout ratio near 97%, signaling nearly all earnings return to shareholders. Its buybacks are consistent, supporting total returns. Mid-America Apartment Communities (MAA) yields 4.4%, but with a payout ratio over 158%, risking sustainability. MAA’s buybacks appear less active. ESS’s balanced dividend and buyback strategy, backed by stronger free cash flow coverage, offers a more sustainable distribution model. I conclude ESS provides a superior total shareholder reward in 2026.
Comparative Score Analysis: The Strategic Profile
The radar chart reveals the fundamental DNA and trade-offs of Essex Property Trust and Mid-America Apartment Communities, highlighting their core strengths and vulnerabilities:
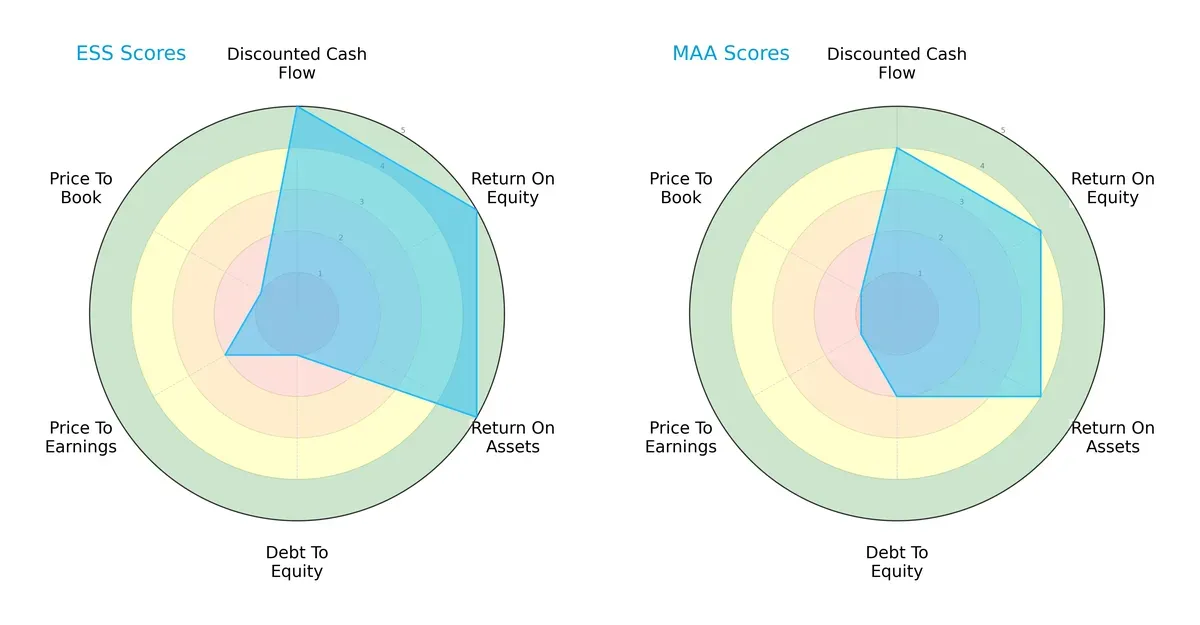
Essex excels in profitability metrics with top scores in DCF, ROE, and ROA, signaling superior capital efficiency. However, it carries a heavy debt burden, reflected in a weak debt-to-equity score. Mid-America shows a more balanced but less potent profile, with moderate returns and slightly better leverage management. Essex relies heavily on operational excellence, while Mid-America leans on financial prudence.
Bankruptcy Risk: Solvency Showdown
Both firms fall in the distress zone with Altman Z-Scores near 1.7, signaling elevated bankruptcy risk under current economic pressures:
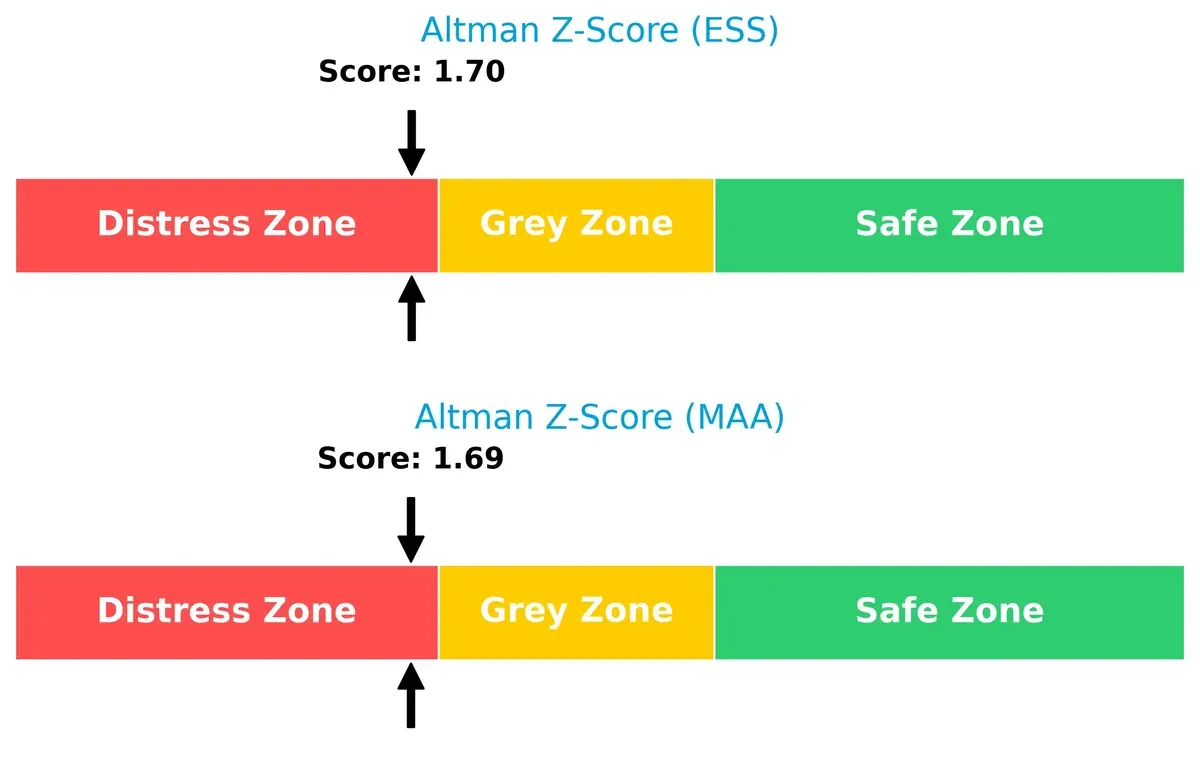
Essex and Mid-America hover just below the 1.8 threshold, suggesting neither is financially safe. Investors should heed this red flag, as both face survival challenges if market conditions deteriorate.
Financial Health: Quality of Operations
Essex scores a solid 7 on the Piotroski F-Score, indicating strong internal financial health. Mid-America’s 5 suggests average quality and possible red flags:
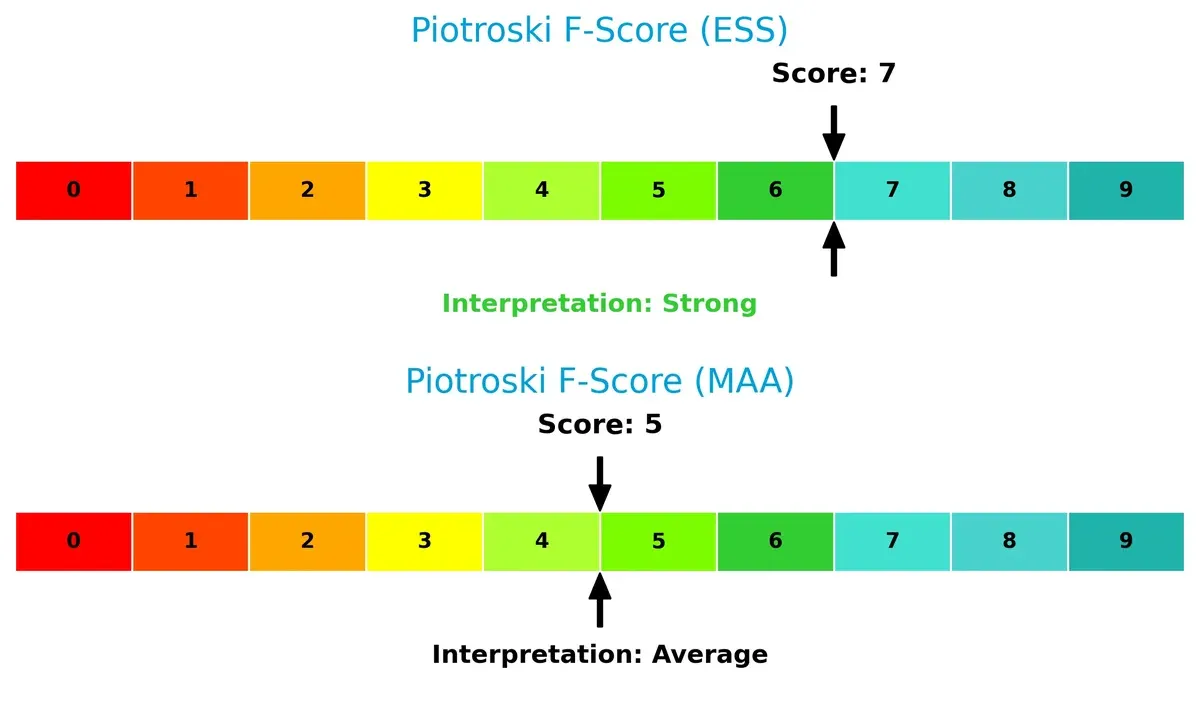
Essex demonstrates superior profitability, liquidity, and operational efficiency. Mid-America’s middling score signals caution, as internal metrics may weaken under stress. This gap further favors Essex from a financial robustness standpoint.
How are the two companies positioned?
This section dissects the operational DNA of Essex and MAA by comparing revenue distribution and internal strengths and weaknesses. The goal is to confront their economic moats to identify the more resilient, sustainable competitive advantage today.
Revenue Segmentation: The Strategic Mix
This visual comparison dissects how Essex Property Trust and Mid-America Apartment Communities diversify their income streams and where their primary sector bets lie:
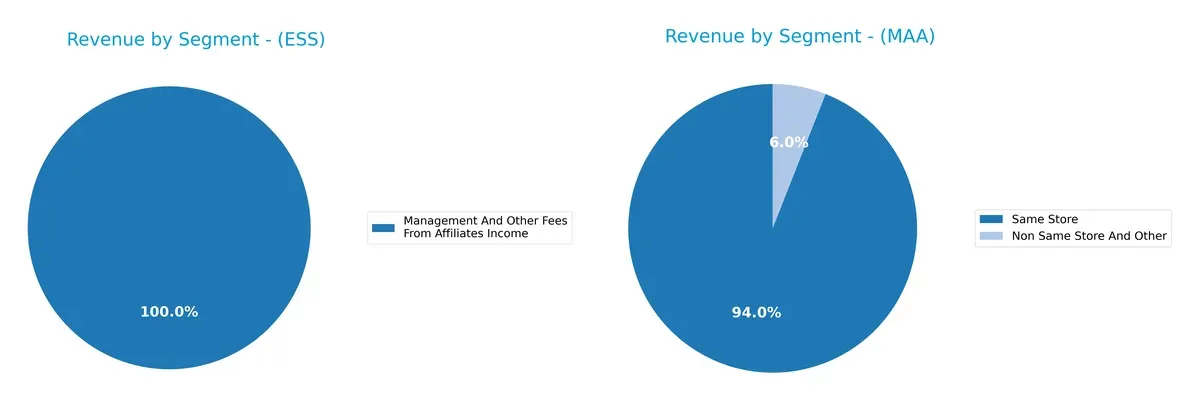
Essex Property Trust pivots almost entirely on Rental And Other Property Revenues, with $1.28B in 2018, showing heavy reliance on a single segment. In contrast, Mid-America Apartment Communities balances $2.08B from Same Store and $131M from Non Same Store And Other in 2025, reflecting a more diversified revenue base. Essex’s concentration signals potential risk, while Mid-America leverages portfolio breadth for stability.
Strengths and Weaknesses Comparison
This table compares the strengths and weaknesses of Essex Property Trust, Inc. and Mid-America Apartment Communities, Inc.:
Essex Strengths
- Strong net margin at 35.38%
- Favorable debt-to-assets ratio
- Reliable dividend yield at 3.88%
- Stable management fees income stream
Mid-America Strengths
- Exceptional ROIC at 1017.71%
- Favorable WACC at 6.46%
- Solid net margin at 20.23%
- Higher dividend yield at 4.36%
Essex Weaknesses
- Zero ROE and ROIC raise profitability concerns
- Unavailable WACC data
- Unfavorable current and quick ratios
- Low asset turnover ratios
- PE ratio at 25.08 considered unfavorable
Mid-America Weaknesses
- Unfavorable ROE at 7.89%
- High PE ratio at 36.36
- Neutral debt-to-assets at 45.14%
- Unfavorable asset turnover
- Weak current and quick ratios
Essex shows strengths in profitability and balance sheet conservatism but suffers from weak returns on capital and liquidity. Mid-America excels in capital efficiency but carries valuation and liquidity risks. Each profile suggests distinct strategic priorities.
The Moat Duel: Analyzing Competitive Defensibility
A structural moat is the only shield protecting long-term profits from relentless competition erosion. Let’s dissect how these firms defend their turf:
Essex Property Trust, Inc.: Geographic Niche Moat
Essex leverages a focused West Coast market presence, generating stable margins despite rising interest costs. Its concentrated portfolio offers strength but limits diversification in 2026.
Mid-America Apartment Communities, Inc.: Scale & Capital Efficiency Moat
MAA contrasts Essex with broad regional diversification and a rapidly growing ROIC well above WACC. Its capital allocation drives value creation and positions it for expansion in multiple U.S. markets.
Market Focus vs. Capital Mastery: The Moat Showdown
MAA’s wide, growing moat outpaces Essex’s niche concentration and declining ROIC trend. MAA’s superior capital efficiency better equips it to defend and expand market share long term.
Which stock offers better returns?
Over the past year, Essex Property Trust, Inc. and Mid-America Apartment Communities, Inc. exhibited distinct price movements, with Essex showing stronger gains but recent slight pullbacks in trading dynamics.
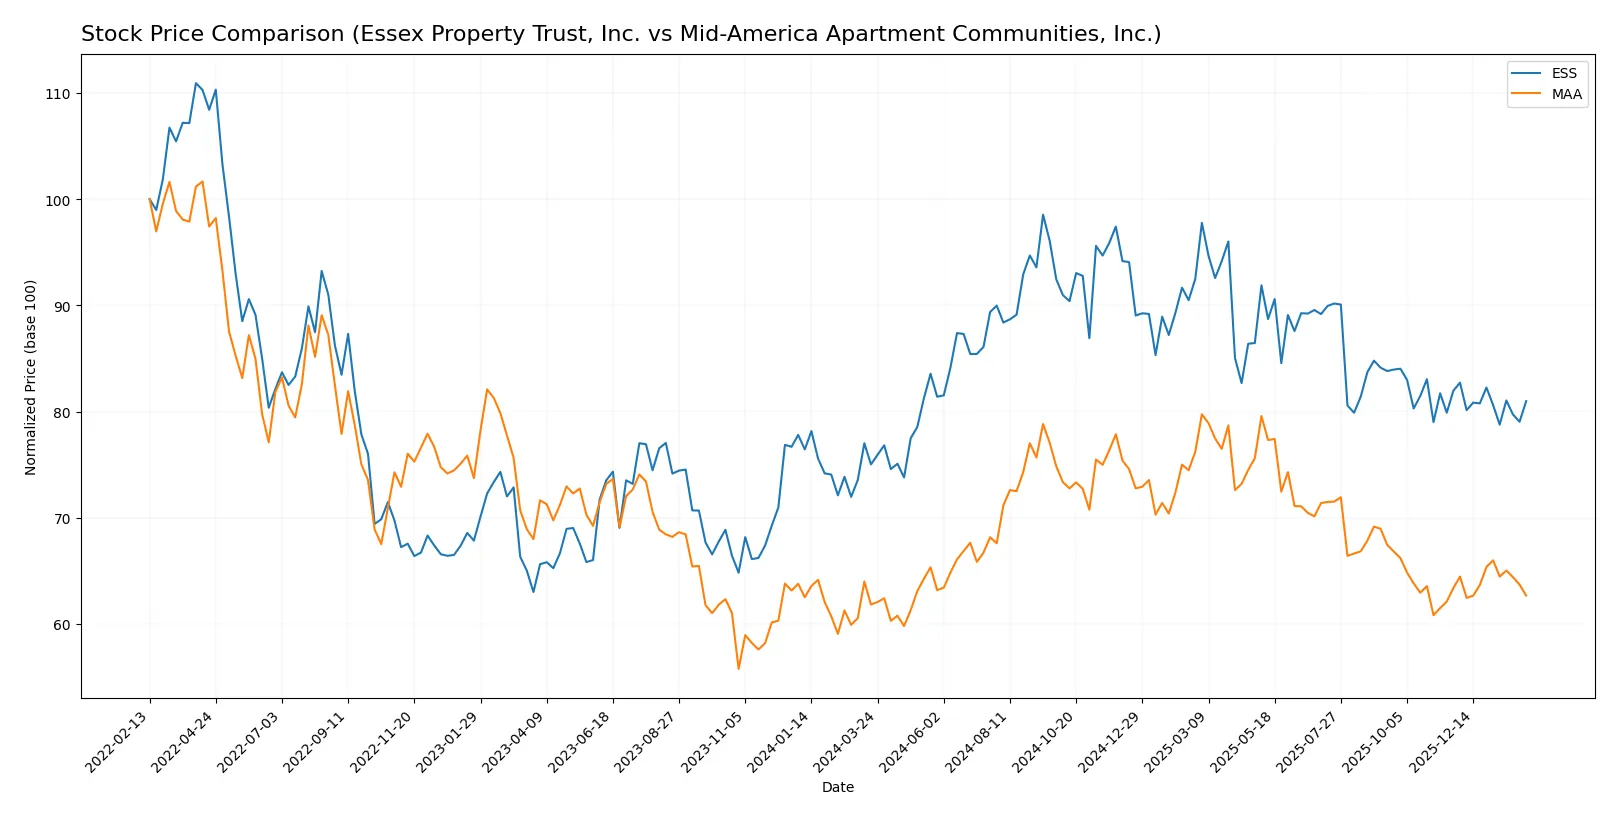
Trend Comparison
Essex Property Trust’s stock gained 7.94% over the last 12 months, signaling a bullish trend with decelerating momentum. The price ranged between 235.17 and 314.05, showing moderate volatility (18.8 std deviation).
Mid-America Apartment Communities rose 1.37% in the same period, maintaining a bullish trend with accelerating momentum. Price fluctuated from 126.08 to 168.12, with lower volatility (11.52 std deviation).
Essex outperformed Mid-America Apartment Communities over the year, delivering the highest market return despite recent minor declines in short-term trend slopes.
Target Prices
Analysts present a moderate upside for Essex Property Trust and Mid-America Apartment Communities in the current market.
| Company | Target Low | Target High | Consensus |
|---|---|---|---|
| Essex Property Trust, Inc. | 271 | 292 | 280.4 |
| Mid-America Apartment Communities, Inc. | 134 | 158 | 143.38 |
The consensus target for Essex exceeds its current 258 price by about 8.6%, indicating modest growth expectations. Mid-America’s target consensus also suggests an approximate 8.5% upside from its 132 price, reflecting steady confidence among analysts.

Don’t Let Luck Decide Your Entry Point
Optimize your entry points with our advanced ProRealTime indicators. You’ll get efficient buy signals with precise price targets for maximum performance. Start outperforming now!
How do institutions grade them?
Essex Property Trust, Inc. Grades
The following table summarizes recent grades and rating actions for Essex Property Trust, Inc.:
| Grading Company | Action | New Grade | Date |
|---|---|---|---|
| BMO Capital | Downgrade | Market Perform | 2026-01-09 |
| UBS | Maintain | Neutral | 2026-01-08 |
| Jefferies | Downgrade | Hold | 2025-12-16 |
| Truist Securities | Maintain | Hold | 2025-12-16 |
| Barclays | Maintain | Equal Weight | 2025-11-25 |
| Mizuho | Maintain | Outperform | 2025-11-24 |
| UBS | Maintain | Neutral | 2025-11-10 |
| Wells Fargo | Maintain | Equal Weight | 2025-11-10 |
| Scotiabank | Maintain | Sector Outperform | 2025-11-04 |
| Evercore ISI Group | Maintain | In Line | 2025-11-03 |
Mid-America Apartment Communities, Inc. Grades
The following table summarizes recent grades and rating actions for Mid-America Apartment Communities, Inc.:
| Grading Company | Action | New Grade | Date |
|---|---|---|---|
| RBC Capital | Maintain | Sector Perform | 2026-02-06 |
| Mizuho | Maintain | Outperform | 2026-01-12 |
| BMO Capital | Upgrade | Outperform | 2026-01-09 |
| UBS | Maintain | Neutral | 2026-01-08 |
| Evercore ISI Group | Maintain | In Line | 2025-12-15 |
| Scotiabank | Downgrade | Sector Perform | 2025-12-05 |
| BTIG | Maintain | Buy | 2025-12-05 |
| Barclays | Maintain | Equal Weight | 2025-11-25 |
| Wells Fargo | Maintain | Overweight | 2025-11-25 |
| Mizuho | Maintain | Outperform | 2025-11-24 |
Which company has the best grades?
Mid-America Apartment Communities, Inc. holds generally stronger and more upgraded grades, including multiple Outperform ratings and a recent upgrade from BMO Capital. Essex Property Trust, Inc.’s grades trend lower with several downgrades to Hold and Market Perform. This divergence may influence investor sentiment and portfolio positioning.
Risks specific to each company
The following categories identify the critical pressure points and systemic threats facing both firms in the 2026 market environment:
1. Market & Competition
Essex Property Trust, Inc. (ESS)
- Concentrated West Coast presence limits diversification but targets high-demand markets.
Mid-America Apartment Communities, Inc. (MAA)
- Broad regional spread across Southeast, Southwest, and Mid-Atlantic offers geographic diversification.
2. Capital Structure & Debt
Essex Property Trust, Inc. (ESS)
- Strong debt-to-equity metrics but Altman Z-score signals financial distress risk.
Mid-America Apartment Communities, Inc. (MAA)
- Higher debt-to-assets ratio with moderate interest coverage; also in distress zone per Altman Z-score.
3. Stock Volatility
Essex Property Trust, Inc. (ESS)
- Beta of 0.74 suggests lower volatility, appealing to risk-averse investors.
Mid-America Apartment Communities, Inc. (MAA)
- Beta of 0.78 indicates slightly higher volatility but still below market average.
4. Regulatory & Legal
Essex Property Trust, Inc. (ESS)
- West Coast regulatory environment is stringent, especially on housing development and rent controls.
Mid-America Apartment Communities, Inc. (MAA)
- Southeastern and Mid-Atlantic regions face evolving regulations but generally less restrictive.
5. Supply Chain & Operations
Essex Property Trust, Inc. (ESS)
- Smaller employee base may limit operational flexibility amid development projects.
Mid-America Apartment Communities, Inc. (MAA)
- Larger workforce supports diverse portfolio but increases fixed operational costs.
6. ESG & Climate Transition
Essex Property Trust, Inc. (ESS)
- High exposure to West Coast climate risks requires aggressive ESG strategy.
Mid-America Apartment Communities, Inc. (MAA)
- Geographic diversity may mitigate some ESG risks but still vulnerable to regional climate events.
7. Geopolitical Exposure
Essex Property Trust, Inc. (ESS)
- Limited to U.S. West Coast, less exposed to international geopolitical volatility.
Mid-America Apartment Communities, Inc. (MAA)
- Operations confined to U.S. regions, reducing risks from foreign geopolitical tensions.
Which company shows a better risk-adjusted profile?
Both firms face significant risks, but Essex’s concentrated market and distress-zone Altman Z-score weigh heavily against it. Mid-America’s broader geographic footprint and slightly better leverage metrics offer a more balanced risk profile. However, both companies need to address financial distress signals and regulatory pressures to maintain stability.
Final Verdict: Which stock to choose?
Essex Property Trust, Inc. shines as a reliable cash generator with a strong net margin and a steady dividend yield. Its main point of vigilance is a weak liquidity position, which could pressure short-term flexibility. It suits portfolios seeking steady income with moderate growth potential.
Mid-America Apartment Communities, Inc. boasts a robust economic moat, demonstrated by a soaring ROIC well above its cost of capital. Its strategic advantage lies in efficient capital allocation and growing profitability. Compared to Essex, it offers better stability but at a premium, fitting a GARP (Growth at a Reasonable Price) profile.
If you prioritize reliable income and consistent cash flow, Essex stands out despite liquidity risks. However, if you seek value creation backed by a sustainable competitive moat and higher capital efficiency, Mid-America commands attention for investors favoring long-term growth with disciplined risk management.
Disclaimer: Investment carries a risk of loss of initial capital. The past performance is not a reliable indicator of future results. Be sure to understand risks before making an investment decision.
Go Further
I encourage you to read the complete analyses of Essex Property Trust, Inc. and Mid-America Apartment Communities, Inc. to enhance your investment decisions: