In the dynamic landscape of industrial technology, ESAB Corporation and IPG Photonics Corporation stand out as leaders driving innovation in metal fabrication and laser technology. Both companies serve overlapping markets in advanced manufacturing solutions, leveraging cutting-edge equipment to boost productivity. This comparison explores their strategies and growth potential to help you, the investor, identify which company offers the most compelling opportunity for your portfolio in 2026.
Table of contents
Companies Overview
I will begin the comparison between ESAB Corporation and IPG Photonics Corporation by providing an overview of these two companies and their main differences.
ESAB Overview
ESAB Corporation specializes in manufacturing consumable products and equipment for cutting, joining, and automated welding alongside gas control equipment. Serving industries such as construction, transportation, energy, and medical sectors, ESAB supports productivity through its range of digital solutions. Founded in 2021 and based in Delaware, the company operates primarily in the metal fabrication manufacturing sector.
IPGP Overview
IPG Photonics Corporation develops and sells high-performance fiber lasers, amplifiers, and diode lasers for materials processing and communication applications globally. Its product portfolio includes advanced laser systems and optical modules used in telecommunications and medical fields. Established in 1990 and headquartered in Massachusetts, IPG operates within the technology sector focusing on semiconductors.
Key similarities and differences
Both ESAB and IPGP serve industrial and advanced technology markets with specialized equipment, yet ESAB focuses on welding and metal fabrication products, while IPGP emphasizes fiber laser and optical technologies. ESAB is positioned in manufacturing with broader industrial applications, whereas IPGP operates in the semiconductor technology space, targeting communications and materials processing. Their sales models combine direct sales and distributor partnerships, reflecting similar go-to-market strategies despite differing product lines.
Income Statement Comparison
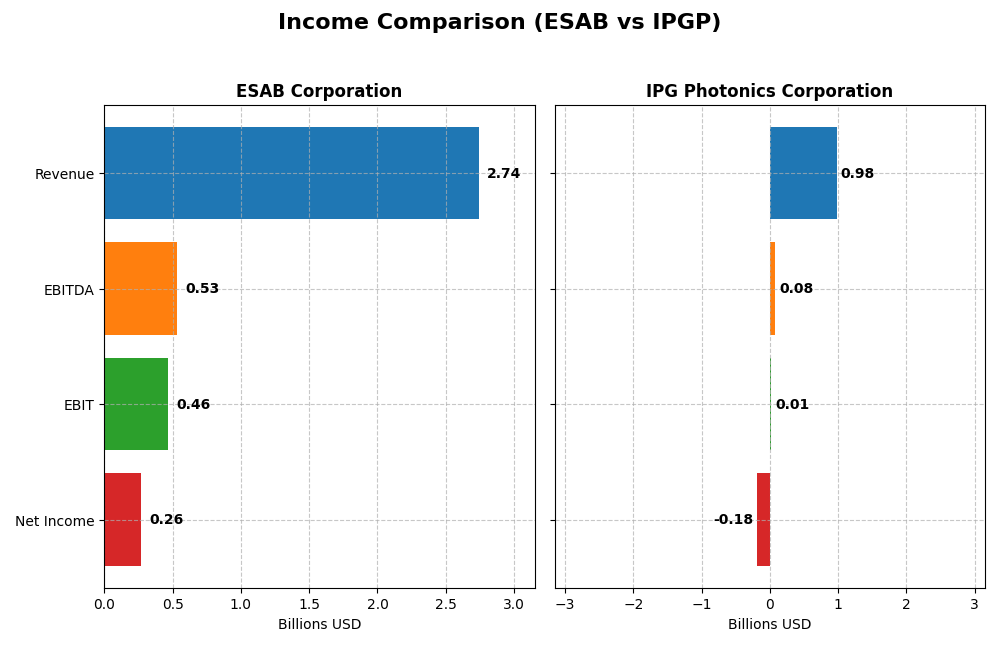
The table below compares the most recent full fiscal year income statement metrics for ESAB Corporation and IPG Photonics Corporation.
| Metric | ESAB Corporation | IPG Photonics Corporation |
|---|---|---|
| Market Cap | 6.83B | 3.15B |
| Revenue | 2.74B | 977M |
| EBITDA | 531M | 76M |
| EBIT | 465M | 14M |
| Net Income | 265M | -182M |
| EPS | 4.36 | -4.09 |
| Fiscal Year | 2024 | 2024 |
Income Statement Interpretations
ESAB Corporation
ESAB’s revenue grew by 40.55% from 2020 to 2024, though it slightly declined by 1.22% in the last year. Net income rose strongly by 68.25% over the period with a 30.61% net margin improvement in 2024, signaling enhanced profitability. The company maintained favorable gross and EBIT margins around 38% and 17%, respectively, reflecting stable cost control and operational efficiency.
IPG Photonics Corporation
IPGP experienced a revenue decline of 18.62% over the 2020-2024 period, with a steep 24.1% drop in 2024 alone. Net income deteriorated sharply, turning negative in 2024 with a -18.58% net margin, reflecting losses. EBIT margin remained low at 1.48%, and all recent growth metrics, including EPS and net margin, were unfavorable, indicating significant operational and profitability challenges.
Which one has the stronger fundamentals?
ESAB exhibits stronger fundamentals with consistent revenue growth, improving margins, and solid net income expansion, supported by favorable profitability metrics. In contrast, IPGP shows declining revenues, substantial net losses, and deteriorating margins, marking unfavorable income statement trends. Thus, ESAB’s income statement portrays a more robust and stable financial performance compared to IPGP.
Financial Ratios Comparison
Below is a comparative table of key financial ratios for ESAB Corporation and IPG Photonics Corporation for the fiscal year 2024.
| Ratios | ESAB Corporation | IPG Photonics Corporation |
|---|---|---|
| ROE | 15.0% | -8.97% |
| ROIC | 10.3% | -11.2% |
| P/E | 27.4 | -17.8 |
| P/B | 4.10 | 1.59 |
| Current Ratio | 1.82 | 6.98 |
| Quick Ratio | 1.18 | 5.59 |
| D/E | 0.66 | 0.009 |
| Debt-to-Assets | 28.8% | 0.78% |
| Interest Coverage | 6.90 | 0 |
| Asset Turnover | 0.68 | 0.43 |
| Fixed Asset Turnover | 7.06 | 1.66 |
| Payout ratio | 6.4% | 0% |
| Dividend yield | 0.23% | 0% |
Interpretation of the Ratios
ESAB Corporation
ESAB shows a slightly favorable ratio profile with strong liquidity (current ratio 1.82) and solid debt management (debt to assets 28.84%). Its return on invested capital (10.3%) is favorable, but valuation multiples like P/E (27.37) and P/B (4.1) appear high, indicating potential overvaluation risks. The dividend yield is low at 0.23%, suggesting modest shareholder returns.
IPG Photonics Corporation
IPG presents a slightly unfavorable ratio profile, marked by negative profitability metrics such as net margin (-18.58%) and return on equity (-8.97%). The company carries minimal debt (debt to assets 0.78%) and a strong quick ratio (5.59), but the negative earnings and zero dividend yield reflect operational challenges and a reinvestment focus rather than shareholder payouts.
Which one has the best ratios?
Comparing both, ESAB maintains more favorable profitability and liquidity ratios, despite some high valuation multiples and low dividend yield. IPG struggles with negative returns and no dividends, though it benefits from low leverage and strong liquidity. Overall, ESAB’s ratios suggest a more balanced financial position relative to IPG’s current challenges.
Strategic Positioning
This section compares the strategic positioning of ESAB Corporation and IPG Photonics Corporation, focusing on market position, key segments, and exposure to technological disruption:
ESAB Corporation
- Established player in metal fabrication with competitive pressure from manufacturing peers.
- Key segments include consumable welding products and fabrication equipment driving revenue.
- Moderate exposure to technological disruption, integrating digital solutions to enhance productivity.
IPG Photonics Corporation
- Semiconductor industry competitor with moderate competitive pressure in fiber laser technology.
- Diverse laser products including high-power CW lasers, pulsed lasers, and integrated systems for materials processing.
- High exposure to technological disruption due to rapid innovation in fiber laser and amplifier technologies.
ESAB Corporation vs IPG Photonics Corporation Positioning
ESAB pursues a diversified approach with broad product lines in welding and fabrication, offering stability across industries. IPG focuses on a concentrated technological niche in lasers, which can yield innovation advantages but also higher risk from market shifts.
Which has the best competitive advantage?
ESAB shows a slightly favorable moat with increasing profitability and growing ROIC, indicating improving competitive positioning. IPG has a very unfavorable moat, with declining ROIC and value destruction, signaling weakening competitive advantage.
Stock Comparison
The stock price chart highlights significant movements over the past year, with ESAB Corporation showing a strong upward trajectory contrasted by a notable decline in IPG Photonics Corporation’s shares, reflecting divergent trading dynamics between the two.
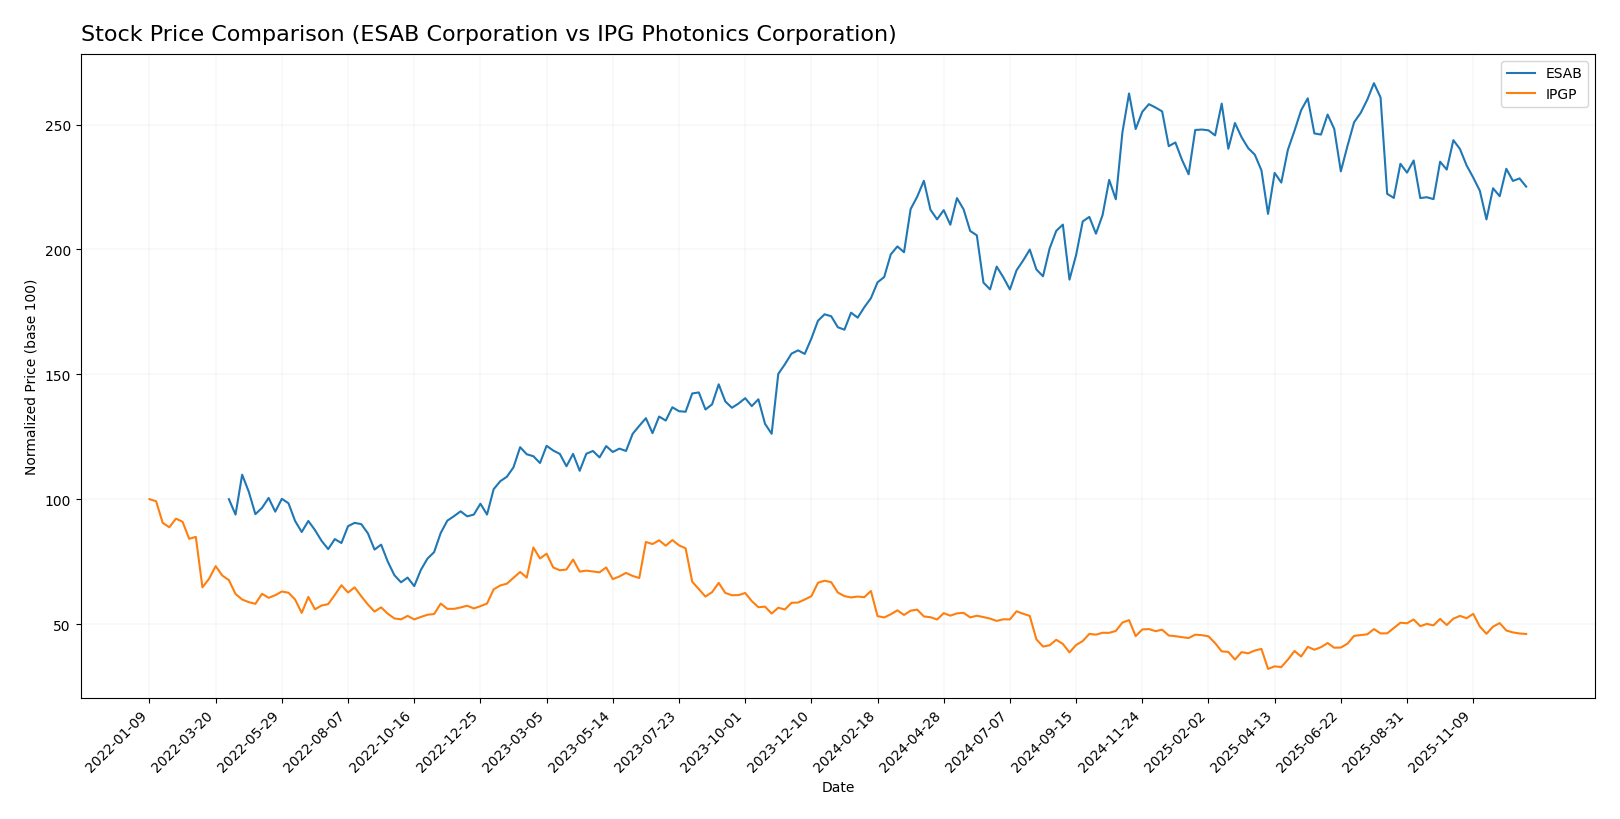
Trend Analysis
ESAB Corporation’s stock exhibited a bullish trend over the past 12 months with a 24.75% price increase, though recent months show a decelerating negative correction of -7.63%. Overall volatility was moderate with an 11.08 standard deviation.
IPG Photonics Corporation experienced a bearish trend over the same period, declining by 27.21% with decelerating losses. The recent trend accelerated downward by -11.76%, accompanied by a 9.69 standard deviation.
Comparing the two, ESAB delivered the highest market performance with a positive 24.75% yearly gain, whereas IPGP’s stock declined significantly, confirming ESAB’s stronger trend momentum over the last year.
Target Prices
Analysts present a clear target price consensus for both ESAB Corporation and IPG Photonics Corporation, indicating potential upside from current levels.
| Company | Target High | Target Low | Consensus |
|---|---|---|---|
| ESAB Corporation | 150 | 140 | 145.5 |
| IPG Photonics Corporation | 96 | 92 | 94 |
The target consensus for ESAB at 145.5 suggests a significant upside compared to its current price of 112.57 USD. Similarly, IPG Photonics’ consensus target of 94 USD implies notable growth potential above its current 74.84 USD market price.
Analyst Opinions Comparison
This section compares analysts’ ratings and financial scores for ESAB Corporation and IPG Photonics Corporation:
Rating Comparison
ESAB Rating
- Rating: B- with a very favorable status
- Discounted Cash Flow Score: 3, moderate value
- ROE Score: 3, moderate value
- ROA Score: 3, moderate value
- Debt To Equity Score: 2, moderate value
- Overall Score: 3, moderate value
IPGP Rating
- Rating: B- with a very favorable status
- Discounted Cash Flow Score: 4, favorable value
- ROE Score: 2, moderate value
- ROA Score: 3, moderate value
- Debt To Equity Score: 1, very unfavorable value
- Overall Score: 3, moderate value
Which one is the best rated?
Both ESAB and IPGP share the same overall rating of B- and an overall score of 3, indicating moderate financial standing. IPGP outperforms ESAB in discounted cash flow but scores lower on ROE and debt-to-equity, showing mixed strengths.
Scores Comparison
The following table compares the Altman Z-Score and Piotroski Score of ESAB and IPGP:
ESAB Scores
- Altman Z-Score: 2.77, indicating moderate bankruptcy risk in the grey zone.
- Piotroski Score: 5, representing average financial strength.
IPGP Scores
- Altman Z-Score: 10.33, indicating low bankruptcy risk in the safe zone.
- Piotroski Score: 7, representing strong financial strength.
Which company has the best scores?
Based on the provided scores, IPGP outperforms ESAB with a significantly higher Altman Z-Score in the safe zone and a stronger Piotroski Score, indicating better financial stability and strength.
Grades Comparison
Here is a comparison of the latest reliable grades for ESAB Corporation and IPG Photonics Corporation:
ESAB Corporation Grades
The table below shows recent grades and rating actions from reputable grading companies for ESAB Corporation:
| Grading Company | Action | New Grade | Date |
|---|---|---|---|
| Stifel | Maintain | Buy | 2025-12-16 |
| JP Morgan | Maintain | Overweight | 2025-10-30 |
| UBS | Maintain | Buy | 2025-10-20 |
| JP Morgan | Maintain | Overweight | 2025-10-14 |
| Loop Capital | Upgrade | Buy | 2025-08-22 |
| Stifel | Upgrade | Buy | 2025-08-07 |
| Oppenheimer | Maintain | Outperform | 2025-08-07 |
| JP Morgan | Maintain | Overweight | 2025-08-07 |
| Stifel | Maintain | Hold | 2025-07-21 |
| Evercore ISI Group | Maintain | In Line | 2025-05-19 |
Overall, ESAB Corporation has received predominantly positive grades, with multiple Buy and Overweight ratings and some upgrades, indicating a generally favorable outlook from analysts.
IPG Photonics Corporation Grades
The table below summarizes recent grades and rating actions from well-known grading firms for IPG Photonics Corporation:
| Grading Company | Action | New Grade | Date |
|---|---|---|---|
| Citigroup | Upgrade | Buy | 2025-11-05 |
| Bernstein | Upgrade | Outperform | 2025-08-07 |
| Raymond James | Maintain | Strong Buy | 2025-05-07 |
| CL King | Upgrade | Buy | 2025-03-18 |
| Citigroup | Maintain | Sell | 2025-02-18 |
| Stifel | Maintain | Buy | 2025-02-12 |
| Needham | Maintain | Hold | 2025-02-12 |
| Seaport Global | Downgrade | Neutral | 2024-08-01 |
| Stifel | Maintain | Buy | 2024-07-31 |
| Raymond James | Maintain | Strong Buy | 2024-07-31 |
IPG Photonics shows a mixed rating profile with upgrades to Buy and Outperform, but also a notable Sell and Neutral grade, reflecting some divergence in analyst opinions.
Which company has the best grades?
ESAB Corporation generally has stronger and more consistent Buy and Overweight ratings, while IPG Photonics has a wider spread including Sell and Neutral grades. This suggests ESAB’s grades may indicate a steadier positive sentiment, potentially impacting investor confidence differently than the more varied outlook on IPG Photonics.
Strengths and Weaknesses
Below is a comparison of key strengths and weaknesses for ESAB Corporation and IPG Photonics Corporation based on the most recent financial and operational data.
| Criterion | ESAB Corporation | IPG Photonics Corporation |
|---|---|---|
| Diversification | Balanced revenue split between consumables (893M) and equipment (1.85B) | Highly focused on laser systems and components, with diverse laser types but narrower product range |
| Profitability | Positive ROIC of 10.3%, net margin 9.66%, slightly favorable overall ratios | Negative ROIC (-11.15%), net margin -18.58%, overall slightly unfavorable ratios |
| Innovation | Moderate; steady ROIC growth but no strong moat yet | Declining ROIC trend suggests innovation challenges, but strong laser tech focus |
| Global presence | Established global market with broad industrial application | Global reach focused on advanced laser markets, but smaller scale revenue (about 870M total) |
| Market Share | Strong in welding and cutting equipment markets | Leading in fiber lasers but facing profitability pressures and market headwinds |
In summary, ESAB shows increasing profitability with a balanced product portfolio, indicating a slightly favorable investment profile. IPG Photonics, despite technological leadership in lasers, struggles with declining profitability and value destruction, warranting caution for investors.
Risk Analysis
Below is a comparison of key risks for ESAB Corporation and IPG Photonics Corporation based on the most recent data from 2024.
| Metric | ESAB Corporation | IPG Photonics Corporation |
|---|---|---|
| Market Risk | Moderate (Beta 1.20) | Moderate (Beta 1.03) |
| Debt Level | Moderate (Debt/Equity 0.66) | Very Low (Debt/Equity 0.01) |
| Regulatory Risk | Moderate (Manufacturing sector) | Moderate (Technology sector) |
| Operational Risk | Moderate (Complex manufacturing) | Moderate (High-tech laser systems) |
| Environmental Risk | Moderate (Metal fabrication) | Moderate (Fiber laser production) |
| Geopolitical Risk | Moderate (Global supply chains) | Moderate (Global semiconductor market) |
The most impactful risks to monitor are ESAB’s moderate debt level combined with its exposure to volatile manufacturing markets, while IPG Photonics faces challenges from negative profitability despite low debt. Both companies operate in sectors sensitive to regulatory and geopolitical shifts, requiring cautious risk management.
Which Stock to Choose?
ESAB Corporation shows a generally favorable income evolution from 2020 to 2024, with revenue growth of 40.55% and net income growth of 68.25%. Its financial ratios are slightly favorable, featuring a ROIC above WACC trend, moderate debt, and a strong current ratio. Profitability is stable with a net margin of 9.66%, and the company holds a very favorable B- rating.
IPG Photonics Corporation experiences an unfavorable income trajectory, with negative growth in revenue (-18.62%) and net income (-213.76%) over the same period. Its financial ratios are slightly unfavorable, marked by declining ROIC below WACC, negligible debt, and mixed liquidity ratios. Profitability is negative, reflected in a net margin of -18.58%, yet it also has a very favorable B- rating.
Investors seeking growth and improving profitability might find ESAB’s stable earnings and growing ROIC more attractive, while those tolerant of volatility could interpret IPGP’s strong balance sheet and recent cash flow as potential opportunities despite current earnings challenges. The choice could depend on the investor’s risk profile and strategy focus.
Disclaimer: Investment carries a risk of loss of initial capital. The past performance is not a reliable indicator of future results. Be sure to understand risks before making an investment decision.
Go Further
I encourage you to read the complete analyses of ESAB Corporation and IPG Photonics Corporation to enhance your investment decisions: