Willis Towers Watson (WTW) and Erie Indemnity Company (ERIE) are prominent players in the insurance brokerage industry, each with unique approaches to risk management and client services. WTW leverages global scale and advanced analytics, while Erie focuses on strong regional presence and customer-centric underwriting. Comparing these companies highlights different innovation strategies within the same sector. In this article, I will help you identify which stock offers the most promising investment opportunity.
Table of contents
Companies Overview
I will begin the comparison between Willis Towers Watson and Erie Indemnity by providing an overview of these two companies and their main differences.
Willis Towers Watson Overview
Willis Towers Watson Public Limited Company is a global advisory, broking, and solutions firm operating mainly in insurance brokerage and risk management. The company serves clients worldwide through segments focused on Health, Wealth and Career, and Risk and Broking. Founded in 1828 and headquartered in London, it provides a wide range of services including actuarial support, insurance brokerage, and investment consulting, employing 49,000 people.
Erie Indemnity Overview
Erie Indemnity Company acts as a managing attorney-in-fact for the Erie Insurance Exchange in the US, offering underwriting, policy issuance, and renewal services. It supports its insurance operations with sales, advertising, customer service, and IT activities. Founded in 1925 and based in Erie, Pennsylvania, Erie has a smaller workforce of 6,715 employees and focuses primarily on property and casualty insurance brokerage within the US.
Key similarities and differences
Both Willis Towers Watson and Erie Indemnity operate in the insurance brokerage industry within the financial services sector and are listed on NASDAQ. Willis Towers Watson has a global footprint and a broader service offering including risk advisory and investment consulting, while Erie Indemnity concentrates on managing insurance policies and services domestically. The companies also differ significantly in scale, with Willis Towers Watson having a market cap of $32.4B and Erie Indemnity $13.1B, reflecting their differing operational scopes and employee bases.
Income Statement Comparison
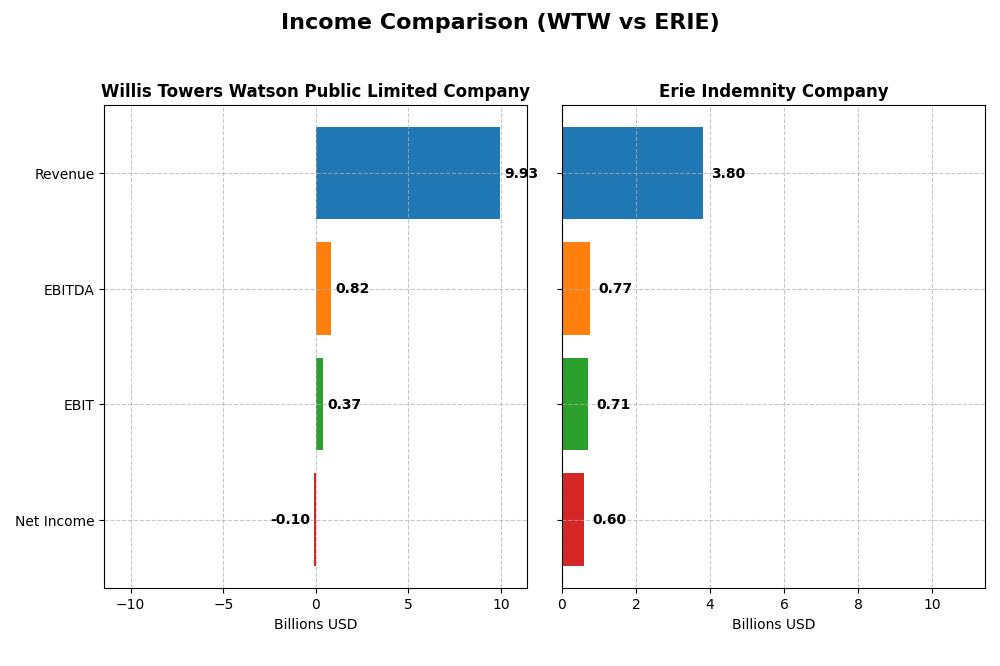
The table below presents a side-by-side comparison of key income statement metrics for Willis Towers Watson Public Limited Company and Erie Indemnity Company for the fiscal year 2024.
| Metric | Willis Towers Watson Public Limited Company | Erie Indemnity Company |
|---|---|---|
| Market Cap | 32.4B | 13.1B |
| Revenue | 9.93B | 3.80B |
| EBITDA | 823M | 766M |
| EBIT | 367M | 710M |
| Net Income | -98M | 600M |
| EPS | -0.96 | 12.89 |
| Fiscal Year | 2024 | 2024 |
Income Statement Interpretations
Willis Towers Watson Public Limited Company
Willis Towers Watson’s revenue showed moderate growth from 8.62B in 2020 to 9.93B in 2024, a 15.26% increase overall. However, net income declined drastically, turning negative to -98M in 2024 from 996M in 2020. Gross margins remained favorable around 44.6%, but net margins fell to -0.99% in 2024, reflecting deteriorating profitability despite steady revenue growth.
Erie Indemnity Company
Erie Indemnity’s revenue rose robustly by 49.62% over 2020-2024, reaching 3.80B in 2024. Net income also improved strongly, doubling to 600M in 2024 from 293M in 2020. Margins showed solid expansion, with net margin at 15.82% and EBIT margin at 18.7% in 2024. The company delivered consistent margin growth and increasing profitability alongside revenue gains.
Which one has the stronger fundamentals?
Erie Indemnity exhibits stronger fundamentals with high revenue and net income growth, favorable margins, and positive profitability trends. Willis Towers Watson, despite revenue growth and stable gross margins, faces unfavorable net income and margin declines, indicating weaker profitability and financial health over the period.
Financial Ratios Comparison
The table below presents a side-by-side comparison of the most recent fiscal year (2024) financial ratios for Willis Towers Watson Public Limited Company (WTW) and Erie Indemnity Company (ERIE), highlighting key performance and financial health indicators.
| Ratios | Willis Towers Watson (WTW) | Erie Indemnity (ERIE) |
|---|---|---|
| ROE | -1.23% | 30.21% |
| ROIC | -3.46% | 28.67% |
| P/E | -326.03 | 31.72 |
| P/B | 4.02 | 9.58 |
| Current Ratio | 1.20 | 1.43 |
| Quick Ratio | 1.20 | 1.43 |
| D/E | 0.75 | 0.004 |
| Debt-to-Assets | 21.43% | 0.26% |
| Interest Coverage | 2.38 | 0 |
| Asset Turnover | 0.36 | 1.34 |
| Fixed Asset Turnover | 8.66 | 7.52 |
| Payout ratio | -361% | 39.56% |
| Dividend yield | 1.11% | 1.25% |
Interpretation of the Ratios
Willis Towers Watson Public Limited Company
Willis Towers Watson exhibits a mixed ratio profile with significant weaknesses in profitability metrics such as negative net margin (-0.99%) and return on equity (-1.23%), signaling operational challenges. Its liquidity ratios are neutral to favorable, but concerns remain over asset turnover and interest coverage. The company pays dividends with a moderate yield of 1.11%, reflecting a cautious distribution policy amid profitability issues.
Erie Indemnity Company
Erie Indemnity shows a robust financial profile with strong profitability ratios including a net margin of 15.54% and return on equity of 30.21%, indicating efficient management and solid earnings. Its liquidity and leverage ratios are favorable, supported by an interest coverage ratio effectively infinite. Erie pays dividends yielding 1.25%, maintaining a balanced approach to shareholder returns with sustainable coverage.
Which one has the best ratios?
Erie Indemnity clearly outperforms Willis Towers Watson in profitability, leverage, and efficiency metrics, with a higher proportion of favorable ratios (71.43% vs. 35.71%). Willis Towers Watson’s negative returns and weaker operational ratios weigh heavily in comparison, making Erie Indemnity the company with the stronger overall financial ratio profile in 2024.
Strategic Positioning
This section compares the strategic positioning of Willis Towers Watson and Erie Indemnity, focusing on market position, key segments, and exposure to technological disruption:
Willis Towers Watson
- Leading global advisory and broking firm facing intense competition in insurance brokerage.
- Operates diversified segments: Health, Wealth and Career, plus Risk and Broking driving revenues.
- Exposure to disruption through consulting, data, software, and technology-driven risk management services.
Erie Indemnity
- Manages insurance exchange focused on policy issuance with more limited direct competition.
- Concentrates mainly on policy issuance and renewal services, supported by service agreements.
- Limited explicit exposure to technological disruption based on provided data.
Willis Towers Watson vs Erie Indemnity Positioning
Willis Towers Watson pursues a diversified strategy across multiple advisory and broking segments, providing broad service offerings. Erie Indemnity remains more concentrated on underwriting and policy services, which may limit scale but focus operational expertise.
Which has the best competitive advantage?
Erie Indemnity demonstrates a very favorable moat with growing ROIC and value creation, indicating strong competitive advantage. Willis Towers Watson shows a very unfavorable moat with declining profitability, suggesting weaker competitive positioning.
Stock Comparison
The stock price movements of Willis Towers Watson Public Limited Company (WTW) and Erie Indemnity Company (ERIE) over the past 12 months exhibit contrasting trends, with WTW showing a strong upward trajectory while ERIE experiences a notable decline.

Trend Analysis
Willis Towers Watson’s stock price increased by 18.09% over the past year, indicating a bullish trend with accelerating momentum and a volatility standard deviation of 26.34. The price ranged between 250.95 and 347.14.
Erie Indemnity’s stock declined by 18.86% over the same period, reflecting a bearish trend with acceleration and higher volatility at 61.16 standard deviation. The price fluctuated from a low of 277.81 to a high of 542.86.
Comparing the two, Willis Towers Watson delivered the highest market performance with a strong bullish trend, whereas Erie Indemnity faced consistent bearish pressure and lower recent buyer dominance.
Target Prices
The consensus target prices for Willis Towers Watson Public Limited Company indicate moderate upside potential.
| Company | Target High | Target Low | Consensus |
|---|---|---|---|
| Willis Towers Watson Public Limited Company | 398 | 318 | 368.5 |
Analysts expect Willis Towers Watson’s stock price to rise from the current 327.40 USD toward the consensus target of 368.5 USD, reflecting a bullish outlook. No verified target price data is available from recognized analysts for Erie Indemnity Company.
Analyst Opinions Comparison
This section compares analysts’ ratings and grades for Willis Towers Watson Public Limited Company (WTW) and Erie Indemnity Company (ERIE):
Rating Comparison
WTW Rating
- Rating: B+; considered Very Favorable overall
- Discounted Cash Flow Score: 4, Favorable
- ROE Score: 5, Very Favorable
- ROA Score: 5, Very Favorable
- Debt To Equity Score: 2, Moderate
- Overall Score: 3, Moderate
ERIE Rating
- Rating: B+; considered Very Favorable overall
- Discounted Cash Flow Score: 4, Favorable
- ROE Score: 5, Very Favorable
- ROA Score: 5, Very Favorable
- Debt To Equity Score: 1, Very Unfavorable
- Overall Score: 3, Moderate
Which one is the best rated?
Both WTW and ERIE share identical ratings and scores across most metrics, except ERIE has a lower Debt To Equity Score, indicating higher financial risk. Thus, WTW is slightly better rated in terms of financial stability.
Scores Comparison
Here is a comparison of the Altman Z-Score and Piotroski Score for the two companies:
WTW Scores
- Altman Z-Score: 1.72, in distress zone indicating high bankruptcy risk.
- Piotroski Score: 7, classified as strong financial health.
ERIE Scores
- Altman Z-Score: 11.35, in safe zone indicating low bankruptcy risk.
- Piotroski Score: 5, classified as average financial health.
Which company has the best scores?
ERIE has a significantly higher Altman Z-Score in the safe zone, indicating better financial stability. WTW’s Piotroski Score is stronger, but ERIE’s overall scores suggest lower bankruptcy risk and moderate financial strength.
Grades Comparison
Here is the comparison of the latest available grades for Willis Towers Watson Public Limited Company and Erie Indemnity Company:
Willis Towers Watson Public Limited Company Grades
The following table summarizes recent grades and actions from reputable grading companies for Willis Towers Watson Public Limited Company:
| Grading Company | Action | New Grade | Date |
|---|---|---|---|
| Barclays | maintain | Underweight | 2026-01-08 |
| Evercore ISI Group | maintain | Outperform | 2026-01-07 |
| Keefe, Bruyette & Woods | maintain | Outperform | 2026-01-06 |
| Keefe, Bruyette & Woods | maintain | Outperform | 2025-12-12 |
| Wells Fargo | maintain | Overweight | 2025-12-12 |
| Barclays | maintain | Underweight | 2025-11-20 |
| TD Cowen | maintain | Buy | 2025-11-10 |
| Keefe, Bruyette & Woods | maintain | Outperform | 2025-11-04 |
| Piper Sandler | maintain | Overweight | 2025-10-31 |
| Barclays | maintain | Underweight | 2025-10-08 |
Overall, Willis Towers Watson shows a mixed grade pattern, with several “Outperform” and “Overweight” ratings balanced by consistent “Underweight” assessments, reflecting a diverse analyst outlook.
The Erie Indemnity Company has no available grades or ratings from verified grading companies, providing no formal analyst consensus to report.
Which company has the best grades?
Willis Towers Watson Public Limited Company has received multiple reliable grades ranging from “Underweight” to “Outperform,” indicating varied analyst opinions. Erie Indemnity Company lacks available grade data, so Willis Towers Watson offers more transparency for investors to assess potential risks and opportunities.
Strengths and Weaknesses
Below is a comparative table highlighting the key strengths and weaknesses of Willis Towers Watson (WTW) and Erie Indemnity Company (ERIE) based on their latest financial and operational data.
| Criterion | Willis Towers Watson (WTW) | Erie Indemnity Company (ERIE) |
|---|---|---|
| Diversification | Moderate: Revenue split mainly between Health, Wealth and Career ($5.85B) and Risk and Broking ($4.05B). | Low: Revenue largely concentrated in Policy Issuance and Renewal Services ($2.89B). |
| Profitability | Weak: Negative net margin (-0.99%), ROIC (-3.46%), and ROE (-1.23%), indicating value destruction. | Strong: High net margin (15.54%), ROIC (28.67%), and ROE (30.21%) with value creation. |
| Innovation | Limited recent data on innovation; declining ROIC suggests challenges in competitive edge. | Appears robust with growing ROIC and profitability, indicating durable competitive advantages. |
| Global presence | Significant global footprint with diversified international operations. | Primarily U.S.-focused with concentrated insurance services. |
| Market Share | Large player in insurance consulting and brokerage sectors. | Strong niche player in insurance issuance and renewal services with growing market footprint. |
In summary, Erie Indemnity Company demonstrates strong profitability, efficient capital use, and a durable competitive advantage, making it a favorable investment. Conversely, Willis Towers Watson faces profitability challenges and declining returns, signaling caution for investors despite its diversified services and global reach.
Risk Analysis
Below is a comparative risk overview of Willis Towers Watson (WTW) and Erie Indemnity Company (ERIE) based on key financial and operational metrics for 2024:
| Metric | Willis Towers Watson (WTW) | Erie Indemnity Company (ERIE) |
|---|---|---|
| Market Risk | Moderate beta (0.635), stable sector exposure | Low beta (0.373), lower volatility |
| Debt level | Moderate debt-to-equity (0.75), interest coverage weak (1.4) | Very low debt (0.0), excellent interest coverage (∞) |
| Regulatory Risk | Moderate, operates globally with complex compliance | Moderate, US-focused but regulated industry |
| Operational Risk | Large workforce (49K), complex services may increase risk | Smaller scale (6.7K employees), focused operations |
| Environmental Risk | Moderate, advisory firm with indirect exposure | Low, insurance-focused with minimal direct impact |
| Geopolitical Risk | Higher, due to UK and global operations | Lower, primarily US-based business |
In synthesis, Willis Towers Watson faces higher operational and geopolitical risks due to its global footprint and moderate debt load with weak interest coverage, signaling caution. Erie Indemnity exhibits strong financial health with minimal debt and stable operations, posing lower risk. Market and regulatory risks are moderate for both but more manageable for Erie. Investors should weigh WTW’s moderate financial distress signals against ERIE’s safer profile.
Which Stock to Choose?
Willis Towers Watson (WTW) shows a mixed income evolution with a 4.7% revenue growth in 2024 but a negative net margin of -0.99%. Its financial ratios are slightly unfavorable overall, marked by declining profitability and a very unfavorable moat due to a ROIC well below WACC. The company carries moderate debt and a B+ rating reflecting some financial strengths amid challenges.
Erie Indemnity (ERIE) exhibits strong income growth, with a 16.1% revenue increase and a favorable net margin of 15.82%. Financial ratios are predominantly favorable, supported by a very favorable moat as ROIC exceeds WACC substantially and is trending upwards. ERIE maintains low debt levels and holds a B+ rating, indicating solid financial health.
Investors prioritizing durable competitive advantages and consistent profitability might find ERIE’s profile more favorable due to its strong moat and robust income growth. Conversely, those focusing on turnaround potential or value in a company with mixed signals might view WTW’s current challenges and moderate rating as areas warranting further monitoring.
Disclaimer: Investment carries a risk of loss of initial capital. The past performance is not a reliable indicator of future results. Be sure to understand risks before making an investment decision.
Go Further
I encourage you to read the complete analyses of Willis Towers Watson Public Limited Company and Erie Indemnity Company to enhance your investment decisions: