Home > Comparison > Financial Services > MMC vs ERIE
The strategic rivalry between Marsh & McLennan Companies, Inc. and Erie Indemnity Company shapes the competitive landscape of insurance brokerage. Marsh & McLennan operates as a diversified professional services powerhouse, blending risk advisory and consulting across global markets. Erie Indemnity, by contrast, focuses on underwriting and policy management with a concentrated regional model. This analysis will assess which firm’s operational strategy offers a superior risk-adjusted return for a balanced, diversified portfolio.
Table of contents
Companies Overview
Marsh & McLennan Companies and Erie Indemnity stand as key players in the U.S. insurance brokerage market.
Marsh & McLennan Companies, Inc.: Global Risk and Consulting Leader
Marsh & McLennan commands a broad market position in risk management and consulting. Its revenue stems from risk advice, insurance broking, and consulting services. In 2026, it focuses on integrating risk control with strategic advisory to serve corporate and public clients worldwide, leveraging its diversified service model.
Erie Indemnity Company: Regional Insurance Specialist
Erie Indemnity operates as a managing attorney-in-fact for Erie Insurance Exchange. It generates income through underwriting, policy sales, and agent support within a tightly controlled network. In 2026, Erie emphasizes underwriting discipline and customer service excellence to sustain its niche competitive advantage in the U.S. regional market.
Strategic Collision: Similarities & Divergences
Both firms thrive in insurance brokerage but differ sharply in scale and scope. Marsh & McLennan pursues a global, diversified business model, while Erie focuses on a tightly knit regional ecosystem. Their primary battleground is client retention in risk services versus underwriting precision. These contrasting strategies define distinct risk and growth profiles for investors.
Income Statement Comparison
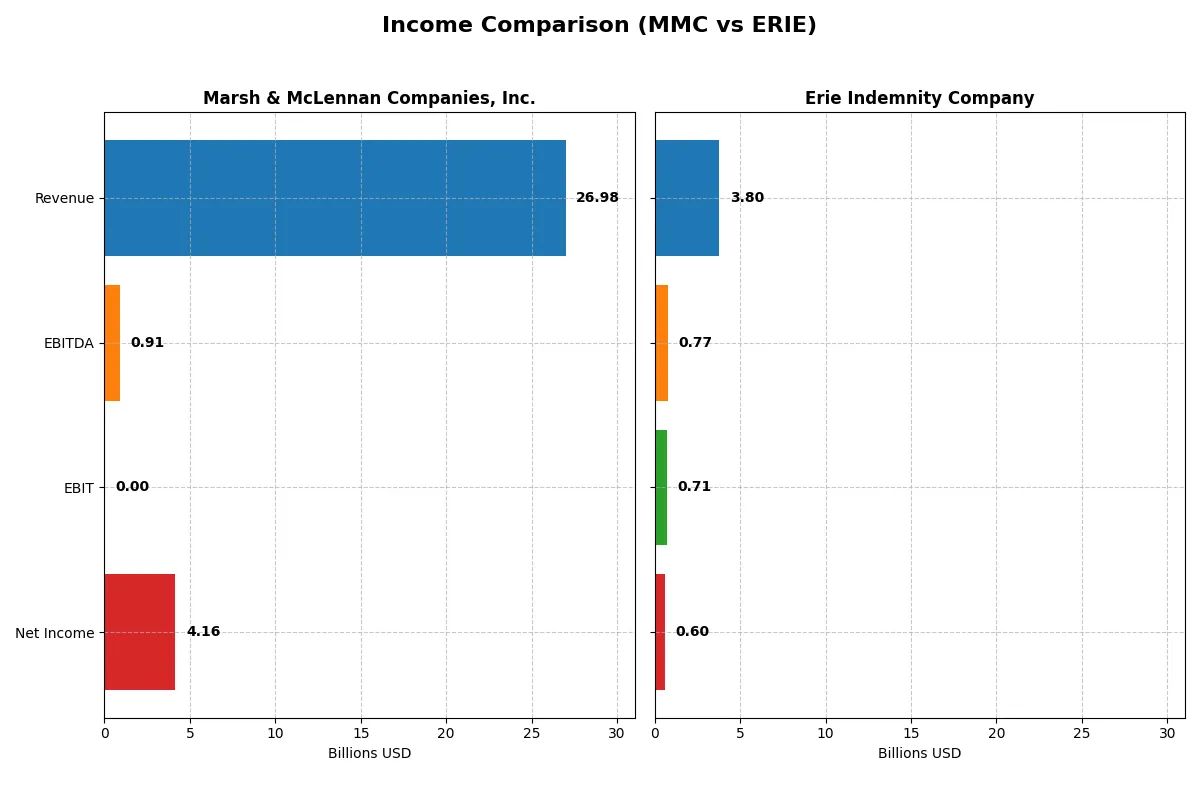
The following data dissects the core profitability and scalability of both corporate engines to reveal who dominates the bottom line:
| Metric | Marsh & McLennan (MMC) | Erie Indemnity (ERIE) |
|---|---|---|
| Revenue | 27B | 3.8B |
| Cost of Revenue | 0 | 3.1B |
| Operating Expenses | 20.8B | 0 |
| Gross Profit | 0 | 676M |
| EBITDA | 910M | 766M |
| EBIT | 0 | 710M |
| Interest Expense | 960M | 0 |
| Net Income | 4.16B | 600M |
| EPS | 8.48 | 12.89 |
| Fiscal Year | 2025 | 2024 |
Income Statement Analysis: The Bottom-Line Duel
This income statement comparison reveals each company’s operational efficiency and profitability momentum through their latest financial results.
Marsh & McLennan Companies, Inc. Analysis
MMC’s revenue grew steadily from $19.8B in 2021 to $27B in 2025, with net income rising from $3.14B to $4.16B. Despite zero reported gross profit in 2025, MMC maintains a solid net margin of 15.4%. The latest year shows strong revenue growth (+10.3%) but a decline in gross profit and EBIT margins, signaling margin pressure.
Erie Indemnity Company Analysis
Erie’s revenue increased from $2.53B in 2020 to $3.80B in 2024, with net income doubling from $293M to $600M. Their gross margin hovered near 18%, and EBIT margin reached a favorable 18.7% in 2024. Erie displayed robust growth across all metrics last year, including a 16.1% revenue increase and 15.9% net margin expansion, indicating efficient scaling.
Margin Resilience vs. Growth Momentum
MMC exhibits impressive scale with $27B revenue and $4.16B net income but faces margin contraction and gross profit erosion. Erie’s smaller $3.8B revenue base shows exceptional margin expansion and strong double-digit growth in profit and EPS. For investors, Erie’s profile offers dynamic margin improvement and growth, while MMC delivers scale with some margin challenges.
Financial Ratios Comparison
These vital ratios act as a diagnostic tool to expose the underlying fiscal health, valuation premiums, and capital efficiency of the companies compared below:
| Ratios | Marsh & McLennan (MMC) | Erie Indemnity (ERIE) |
|---|---|---|
| ROE | 30.4% (2024) | 30.2% (2024) |
| ROIC | 11.6% (2024) | 25.6% (2024) |
| P/E | 25.7 (2024) | 31.7 (2024) |
| P/B | 7.83 (2024) | 9.58 (2024) |
| Current Ratio | 1.13 (2024) | 1.43 (2024) |
| Quick Ratio | 1.13 (2024) | 1.43 (2024) |
| D/E | 1.64 (2024) | 0.004 (2024) |
| Debt-to-Assets | 39% (2024) | 0.26% (2024) |
| Interest Coverage | 8.31 (2024) | 0 (2024) |
| Asset Turnover | 0.43 (2024) | 1.31 (2024) |
| Fixed Asset Turnover | 10.38 (2024) | 7.39 (2024) |
| Payout Ratio | 37.3% (2024) | 39.6% (2024) |
| Dividend Yield | 1.45% (2024) | 1.25% (2024) |
| Fiscal Year | 2024 | 2024 |
Efficiency & Valuation Duel: The Vital Signs
Ratios act as a company’s DNA, unveiling hidden risks and operational excellence that raw numbers alone cannot reveal.
Marsh & McLennan Companies, Inc.
Marsh & McLennan’s 2024 metrics show strong profitability with a 30.4% ROE and solid margins. Yet, its valuation appears stretched, with a P/E around 26 implied by an earnings yield near 3.9%. The firm reinvests heavily in operations, focusing on capital efficiency rather than dividends, reflecting a growth-driven capital allocation strategy.
Erie Indemnity Company
Erie delivers a robust 30.2% ROE and 15.8% net margin, signaling operational efficiency. However, its P/E of 31.7 suggests the market prices a premium. Erie maintains shareholder returns through a modest 1.25% dividend yield, balancing income with a disciplined reinvestment approach, supporting sustained value creation.
Premium Valuation vs. Operational Safety
Erie Indemnity commands a premium valuation justified by superior ROIC and capital structure. Marsh offers competitive profitability but trades at a slightly lower multiple. Investors seeking steady income and operational safety may prefer Erie, while those prioritizing growth reinvestment might lean toward Marsh.
Which one offers the Superior Shareholder Reward?
I compare Marsh & McLennan (MMC) and Erie Indemnity (ERIE) by their dividend yields, payout ratios, and buyback intensity to assess total shareholder return. MMC yields 1.9% with a 41% payout ratio, maintaining strong free cash flow (10.2/share) coverage. Its buyback activity is steady but less aggressive than ERIE’s. ERIE offers a 1.25% yield with a 40% payout ratio, supported by robust free cash flow (10.5/share) but trades at a higher P/E and price-to-free cash flow multiple, reflecting premium valuation. ERIE’s near-zero debt and high solvency ratio enable larger buybacks, enhancing returns. MMC’s distribution is more balanced between dividends and buybacks, supporting sustainability amid higher leverage. I find ERIE’s shareholder reward superior for 2026 due to its disciplined capital allocation, stronger cash flow, and aggressive buybacks, despite a lower yield.
Comparative Score Analysis: The Strategic Profile
The radar chart reveals the fundamental DNA and trade-offs of Marsh & McLennan Companies, Inc. and Erie Indemnity Company, highlighting their financial strengths and vulnerabilities:

Erie shows strong operational efficiency with top ROE and ROA scores of 5, but carries significant valuation and leverage risks, scoring only 1 on Debt/Equity, P/E, and P/B. Marsh & McLennan’s data is missing, making Erie’s profile appear skewed towards a specific edge in profitability but weak in financial stability.
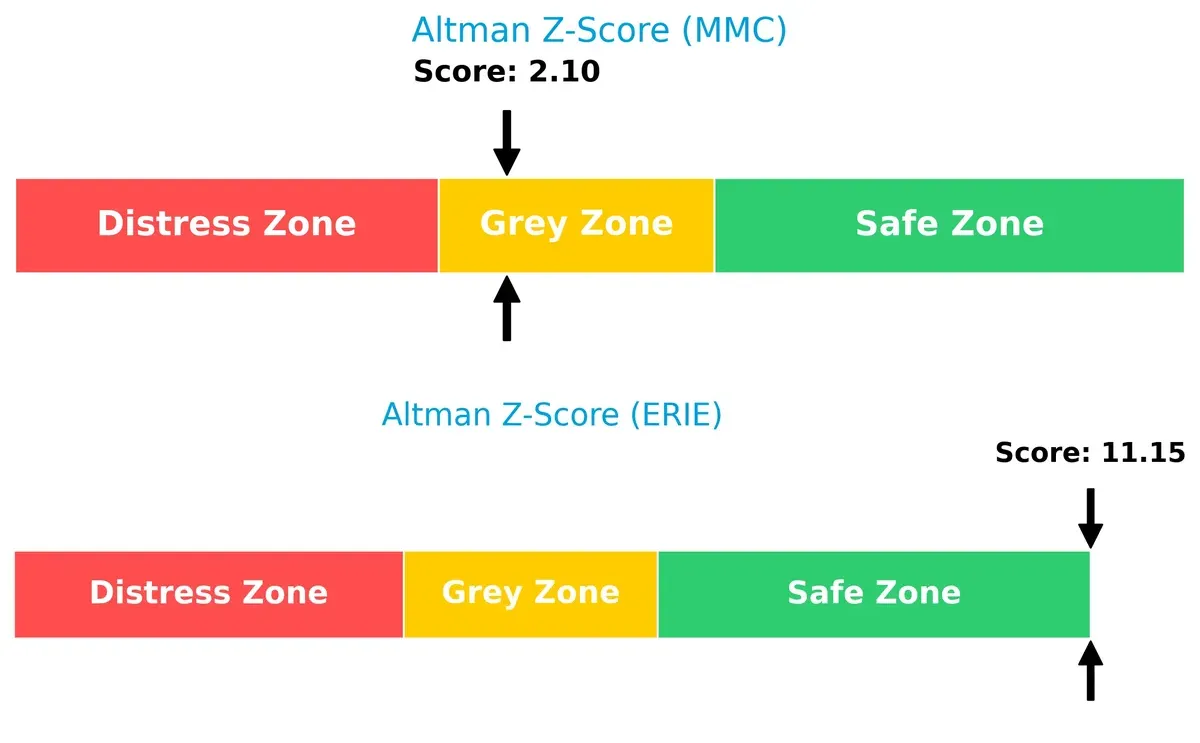
Bankruptcy Risk: Solvency Showdown
Erie’s Altman Z-Score of 11.15 places it securely in the safe zone, while Marsh & McLennan’s 2.10 sits in the grey zone, signaling moderate bankruptcy risk in this cycle:
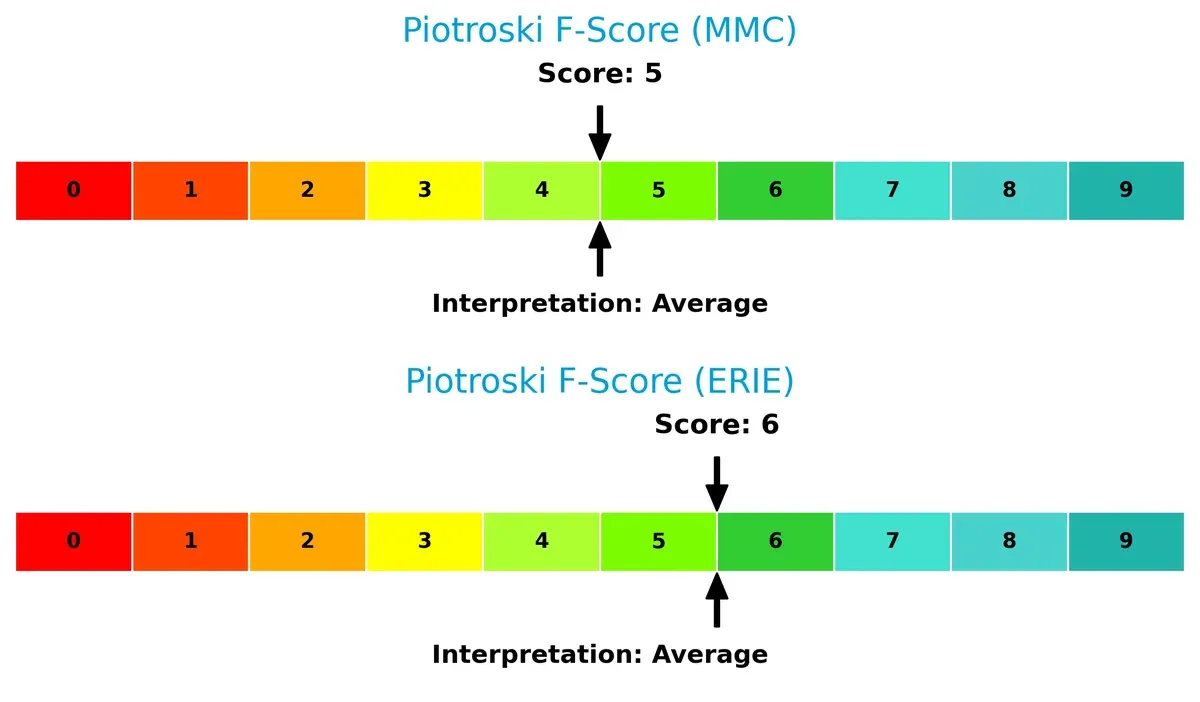
Financial Health: Quality of Operations
Erie edges out slightly with a Piotroski F-Score of 6 versus Marsh & McLennan’s 5, both reflecting average financial health but no glaring red flags:
How are the two companies positioned?
This section dissects the operational DNA of MMC and ERIE by comparing their revenue distribution by segment and internal dynamics, including strengths and weaknesses. The goal is to confront their economic moats and identify which model offers the most resilient, sustainable advantage today.
Revenue Segmentation: The Strategic Mix
The following visual comparison dissects how Marsh & McLennan Companies and Erie Indemnity diversify their income streams and where their primary sector bets lie:
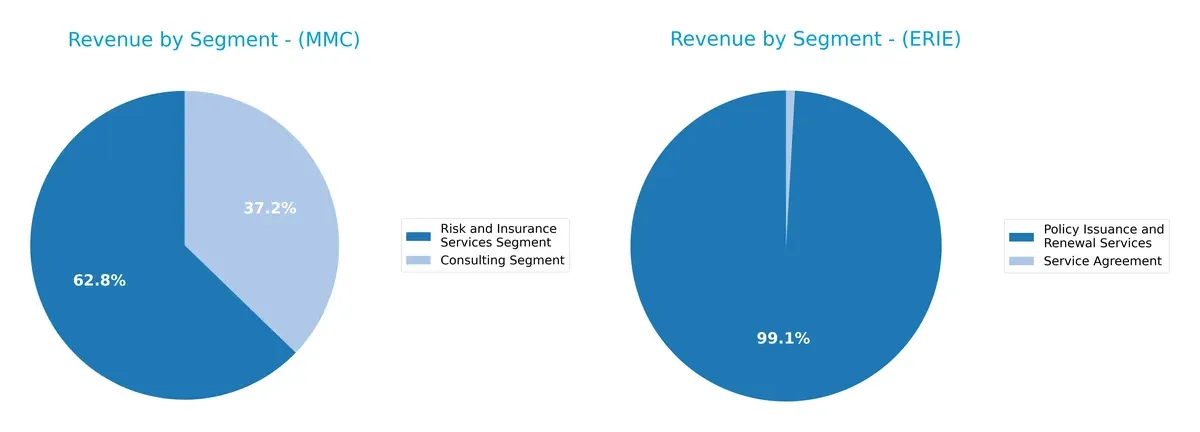
Marsh & McLennan anchors its revenue in two robust segments: $15.4B from Risk and Insurance Services and $9.1B from Consulting. This balanced split signals strategic diversification, reducing concentration risk and leveraging cross-segment synergies. Erie Indemnity, by contrast, pivots heavily on one dominant segment, with $2.9B in Policy Issuance and Renewal Services, dwarfing its $26M Service Agreement revenue. Erie’s focus implies infrastructure dominance but exposes it to higher sector-specific risk.
Strengths and Weaknesses Comparison
This table compares the Strengths and Weaknesses of Marsh & McLennan Companies, Inc. (MMC) and Erie Indemnity Company (ERIE):
MMC Strengths
- Diverse revenue streams from Risk and Insurance Services and Consulting segments
- Significant global presence with strong US, UK, and other geographic revenues
- Long-term revenue growth in key segments
ERIE Strengths
- Strong profitability with 15.8% net margin and 30.2% ROE
- High ROIC of 25.6% well above 5.55% WACC
- Excellent balance sheet with zero debt and strong liquidity ratios
MMC Weaknesses
- Lack of recent detailed financial ratios and profitability data limits analysis
- Dependency on large geographic markets may pose regional risks
ERIE Weaknesses
- High valuation multiples with PE at 31.7 and PB at 9.58 flagged unfavorable
- Limited diversification with most revenue from Policy Issuance and Renewal Services
Overall, MMC shows strength in diversification and global reach but lacks updated financial ratio transparency. ERIE exhibits robust profitability and financial health but faces valuation concerns and narrower business focus. These factors shape each company’s strategic priorities differently.
The Moat Duel: Analyzing Competitive Defensibility
A structural moat is the only true shield protecting long-term profits from relentless competition erosion. Let’s dissect how Marsh & McLennan and Erie Indemnity defend their turf:
Marsh & McLennan Companies, Inc.: Intangible Assets Moat
Marsh leverages deep industry expertise and brand reputation, translating into stable net margins near 15%. Growth in consulting and risk services could deepen its moat, though margin pressures warn of competitive stress in 2026.
Erie Indemnity Company: Capital Efficiency Moat
Erie’s moat centers on superior capital allocation and underwriting discipline, reflected in an ROIC exceeding WACC by 20% and rising sharply. Its efficient operations and strong margin expansion position it well for market share gains in 2026.
Intangible Assets vs. Capital Efficiency: The Moat Verdict
Erie’s rapidly growing ROIC and value-creating capital allocation build a wider, more durable moat than Marsh’s intangible asset advantage. Erie stands better equipped to defend and expand its market share amid intensifying industry competition.
Which stock offers better returns?
Over the past year, both Marsh & McLennan Companies, Inc. (MMC) and Erie Indemnity Company (ERIE) experienced notable price declines, with MMC showing a recent uptick and ERIE a deceleration in its downward trend.
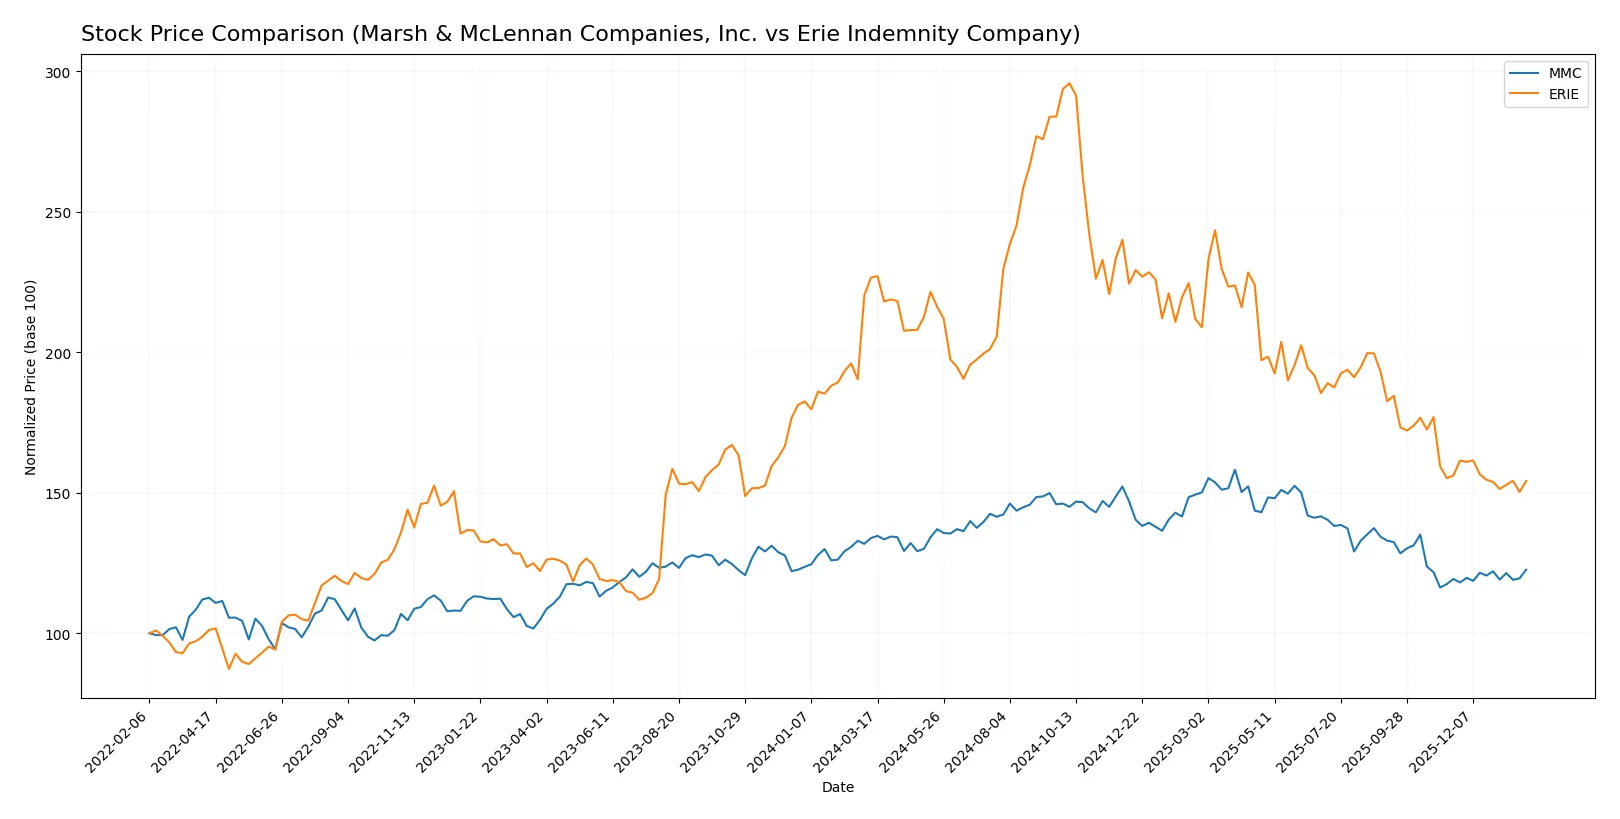
Trend Comparison
MMC’s stock fell 8.4% over the past year, reflecting a bearish trend with accelerating decline. It ranged between 178.15 and 242.39, but showed a recent 2.8% gain indicating a possible recovery phase.
ERIE’s stock dropped sharply by 31.95% over the same period, marking a bearish trend with decelerating losses. It fluctuated widely between 275.85 and 542.86, but recent price change was slightly negative at -1.25%.
Comparing trends, MMC delivered the highest market performance with a smaller loss and recent positive momentum, while ERIE’s decline was more severe and remains in deceleration.
Target Prices
Analysts set a clear target consensus for Marsh & McLennan Companies, Inc. (MMC), signaling moderate upside potential.
| Company | Target Low | Target High | Consensus |
|---|---|---|---|
| Marsh & McLennan Companies, Inc. | 190 | 257 | 211.1 |
The consensus target price of $211.1 exceeds the current $182.7 stock price by roughly 15.5%, indicating analyst optimism. No verified target price data is available for Erie Indemnity Company (ERIE).

Don’t Let Luck Decide Your Entry Point
Optimize your entry points with our advanced ProRealTime indicators. You’ll get efficient buy signals with precise price targets for maximum performance. Start outperforming now!
How do institutions grade them?
The following summarizes the recent institutional grades for the two companies:
Marsh & McLennan Companies, Inc. Grades
The table below lists recent grades from reputable financial institutions for Marsh & McLennan Companies, Inc.:
| Grading Company | Action | New Grade | Date |
|---|---|---|---|
| Cantor Fitzgerald | Maintain | Overweight | 2026-01-14 |
| Wells Fargo | Maintain | Equal Weight | 2026-01-13 |
| Barclays | Maintain | Overweight | 2026-01-08 |
| Evercore ISI Group | Maintain | Outperform | 2026-01-07 |
| JP Morgan | Maintain | Overweight | 2026-01-07 |
| Keefe, Bruyette & Woods | Maintain | Market Perform | 2026-01-06 |
| Citigroup | Maintain | Neutral | 2025-12-04 |
| Barclays | Upgrade | Overweight | 2025-11-20 |
| B of A Securities | Downgrade | Underperform | 2025-11-03 |
| TD Cowen | Maintain | Hold | 2025-11-03 |
Erie Indemnity Company Grades
No reliable institutional grades are available for Erie Indemnity Company.
Which company has the best grades?
Marsh & McLennan Companies, Inc. has a broad spectrum of grades, mostly positive, including multiple Overweight and Outperform ratings. Erie Indemnity Company lacks institutional grades, limiting visibility. Investors may view Marsh & McLennan’s stronger grade profile as a signal of greater analyst confidence.
Risks specific to each company
The following categories identify the critical pressure points and systemic threats facing both firms in the 2026 market environment:
1. Market & Competition
Marsh & McLennan Companies, Inc.
- Large, diversified global presence but intense competition pressures margins.
Erie Indemnity Company
- Smaller scale, regional focus with niche market advantage but limited growth scope.
2. Capital Structure & Debt
Marsh & McLennan Companies, Inc.
- Data unavailable; unknown leverage risk increases uncertainty.
Erie Indemnity Company
- Zero debt, very conservative financial stance enhances stability.
3. Stock Volatility
Marsh & McLennan Companies, Inc.
- Beta 0.75 suggests moderate market sensitivity; wider price range signals potential volatility.
Erie Indemnity Company
- Low beta 0.37 indicates defensive stock; narrower price range supports lower volatility.
4. Regulatory & Legal
Marsh & McLennan Companies, Inc.
- Operates globally, exposed to diverse regulatory regimes increasing compliance complexity.
Erie Indemnity Company
- US-focused operations face more uniform regulatory environment, reducing legal unpredictability.
5. Supply Chain & Operations
Marsh & McLennan Companies, Inc.
- Complex global operations may be vulnerable to disruptions and rising costs.
Erie Indemnity Company
- More localized operations likely benefit from simpler supply chain management.
6. ESG & Climate Transition
Marsh & McLennan Companies, Inc.
- Large firm with broad ESG initiatives but faces pressure to meet evolving standards worldwide.
Erie Indemnity Company
- Smaller footprint eases ESG compliance but less influence on climate transition strategy.
7. Geopolitical Exposure
Marsh & McLennan Companies, Inc.
- Extensive international exposure subjects it to geopolitical tensions and currency risks.
Erie Indemnity Company
- Primarily US-based, limited geopolitical risk but dependent on domestic economic stability.
Which company shows a better risk-adjusted profile?
Erie Indemnity faces its biggest risk from valuation extremes, with very high P/E and P/B ratios signaling expensive stock conditions. Marsh & McLennan’s highest risk lies in uncertain capital structure and global regulatory complexity. Erie’s strong balance sheet and low volatility offer a cleaner risk profile despite valuation concerns. Marsh & McLennan’s missing leverage data and higher operational complexity increase risk uncertainty. Recent data confirms Erie’s robust financial health in the safe zone by Altman Z-Score, reinforcing its superior risk-adjusted position.
Final Verdict: Which stock to choose?
Marsh & McLennan Companies (MMC) stands out for its ability to generate strong equity returns and maintain solid free cash flow yields despite cyclical pressures. Its superpower lies in capital allocation and operational leverage. A point of vigilance is its negative tangible asset base, which could signal balance sheet complexity. MMC suits portfolios aiming for aggressive growth with tolerance for nuanced risks.
Erie Indemnity (ERIE) boasts a durable moat with a ROIC far exceeding its WACC, signaling strong value creation and competitive durability. Its strategic edge is operational efficiency, reflected in a robust asset turnover and conservative leverage. Compared to MMC, ERIE offers greater financial stability, ideal for Growth at a Reasonable Price (GARP) investors prioritizing steady profitability and low financial risk.
If you prioritize aggressive growth and operational leverage, MMC is the compelling choice due to its strong return on equity and cash flow generation. However, if you seek a defensible moat with superior financial stability, ERIE offers better risk-adjusted returns and a durable competitive advantage. Both present distinct strategic scenarios aligned with different investor risk appetites.
Disclaimer: Investment carries a risk of loss of initial capital. The past performance is not a reliable indicator of future results. Be sure to understand risks before making an investment decision.
Go Further
I encourage you to read the complete analyses of Marsh & McLennan Companies, Inc. and Erie Indemnity Company to enhance your investment decisions: