Home > Comparison > Real Estate > EQR vs UDR
The strategic rivalry between Equity Residential and UDR, Inc. shapes the competitive landscape of the residential REIT sector. Equity Residential operates a vast portfolio focused on high-density urban markets, emphasizing scale and premium locations. In contrast, UDR pursues a more selective approach, concentrating on multifamily communities with targeted development and redevelopment expertise. This analysis evaluates which company’s operational model offers superior risk-adjusted returns for a diversified real estate portfolio.
Table of contents
Companies Overview
Equity Residential and UDR, Inc. both shape the residential REIT landscape with strong urban footprints and investor appeal.
Equity Residential: Urban Residential Powerhouse
Equity Residential commands a leading position in residential REITs by managing 78,568 apartments across high-demand urban centers. Its core revenue derives from rental income primarily in Boston, New York, San Francisco, and other dynamic cities. The company’s strategic focus in 2026 remains on acquisition and development to capitalize on long-term renter demand in these premium markets.
UDR, Inc.: Multifamily Specialist with Steady Returns
UDR, Inc. excels in the multifamily residential sector, owning 51,649 homes and developing over 1,000 more. It generates income through property management, acquisitions, and redevelopment. In 2026, UDR emphasizes maintaining dependable returns and enhancing resident experience while targeting selective U.S. markets for growth and portfolio optimization.
Strategic Collision: Similarities & Divergences
Both companies pursue growth through urban multifamily assets but differ in scale and scope. Equity Residential focuses on larger, high-barrier-to-entry cities, while UDR targets a broader range of markets with a balanced growth model. Their competition centers on attracting long-term renters in premium urban locations. Equity Residential offers scale-driven market dominance, whereas UDR presents a more diversified, resident-centric investment approach.
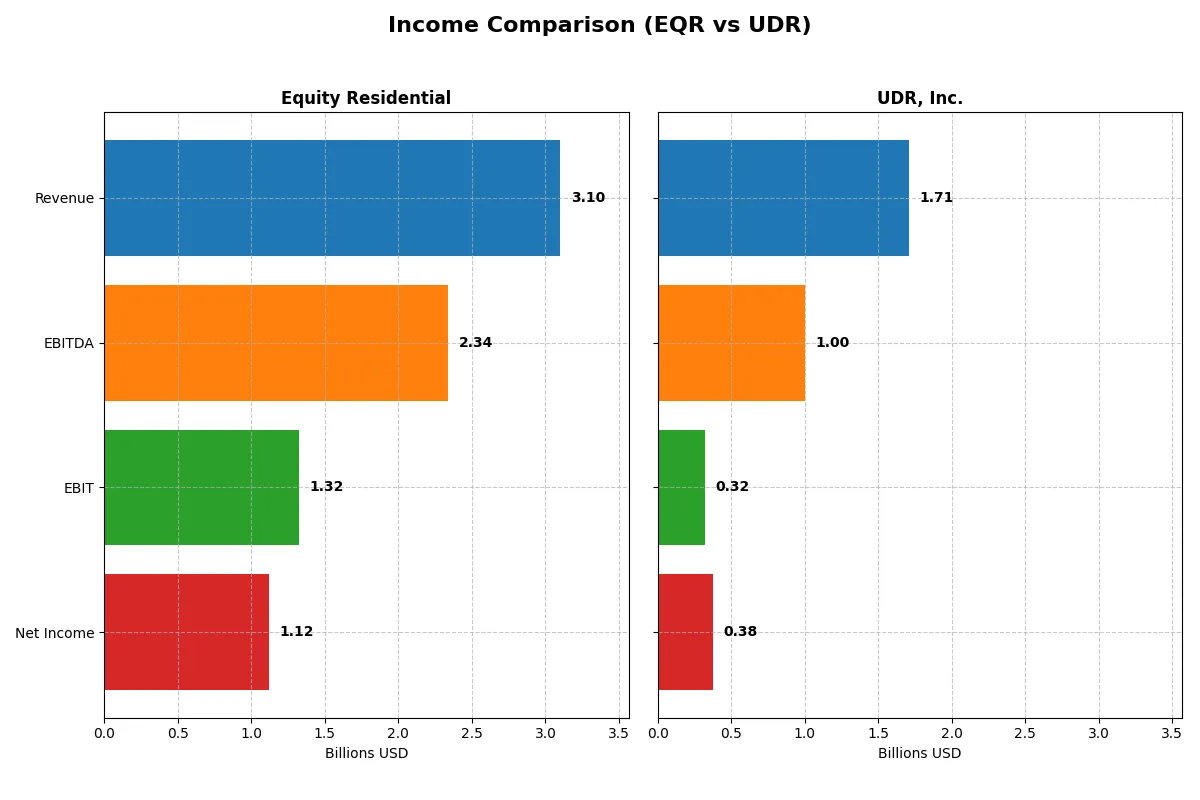
Income Statement Comparison
The following data dissects the core profitability and scalability of both corporate engines to reveal who dominates the bottom line:
| Metric | Equity Residential (EQR) | UDR, Inc. (UDR) |
|---|---|---|
| Revenue | 3.10B | 1.71B |
| Cost of Revenue | 1.66B | 1.27B |
| Operating Expenses | 310.0M | 115.8M |
| Gross Profit | 1.44B | 438.2M |
| EBITDA | 2.34B | 1.00B |
| EBIT | 1.32B | 322.4M |
| Interest Expense | 237.4M | 0 |
| Net Income | 1.12B | 377.7M |
| EPS | 2.97 | 1.13 |
| Fiscal Year | 2025 | 2025 |
Income Statement Analysis: The Bottom-Line Duel
This income statement comparison reveals which company translates its sales into profits more efficiently and sustainably over time.
Equity Residential Analysis
Equity Residential’s revenue climbed steadily from 2.46B in 2021 to 3.1B in 2025, showing solid growth momentum. Its gross margin softened to 46.3%, but the net margin remains robust at 36.1%, reflecting efficient cost control. The 2025 net income of 1.13B highlights strong profitability despite a slight decline in gross profit year-over-year.
UDR, Inc. Analysis
UDR’s revenue grew from 1.29B in 2021 to 1.71B in 2025, a 33% rise over five years. Gross margin stands lower at 25.6%, yet it improved in 2025 alongside net margin gains to 22.1%. Net income surged to 378M in 2025, driven by favorable margins and operational improvements, signaling accelerating profitability.
Margin Power vs. Revenue Scale
Equity Residential dominates with higher absolute profits and superior net margins, translating revenue into earnings more efficiently. UDR shows impressive growth in net income and margin expansion but at a smaller scale. For investors, Equity Residential’s blend of size and margin strength offers a more attractive income profile.
Financial Ratios Comparison
These vital ratios act as a diagnostic tool to expose the underlying fiscal health, valuation premiums, and capital efficiency of the companies compared:
| Ratios | Equity Residential (EQR) | UDR, Inc. (UDR) |
|---|---|---|
| ROE | 10.1% | 11.5% |
| ROIC | 2.19% | 29.4% |
| P/E | 21.3 | 32.1 |
| P/B | 2.16 | 3.68 |
| Current Ratio | 0.05 | 3.31 |
| Quick Ratio | 0.05 | 3.31 |
| D/E (Debt-to-Equity) | 0.80 | 1.88 |
| Debt-to-Assets | 42.3% | 58.3% |
| Interest Coverage | 4.75 | 0 (not reported) |
| Asset Turnover | 0.15 | 0.16 |
| Fixed Asset Turnover | 6.82 | 9.13 |
| Payout ratio | 93.2% | 150.0% |
| Dividend yield | 4.37% | 4.68% |
| Fiscal Year | 2025 | 2025 |
Efficiency & Valuation Duel: The Vital Signs
Financial ratios serve as a company’s DNA, exposing hidden risks and revealing operational strength beneath the surface.
Equity Residential
Equity Residential shows solid profitability with a 10.14% ROE and a high net margin of 36.12%, indicating efficient operations. Its P/E of 21.34 and P/B of 2.16 suggest a fairly valued stock. The company rewards shareholders with a 4.37% dividend yield, balancing income with steady capital returns.
UDR, Inc.
UDR posts a slightly higher ROE at 11.49% but a lower net margin of 22.06%, reflecting moderate profitability. Its valuation appears stretched, with a P/E of 32.08 and P/B of 3.68. Despite elevated debt levels, UDR offers a 4.68% dividend yield, signaling commitment to shareholder returns amidst growth pressures.
Balanced Efficiency vs. Growth Premium
Equity Residential strikes a better balance with efficient profitability and reasonable valuation, while UDR demands a premium for growth and risk. Investors prioritizing steady income and operational safety may lean toward Equity Residential. Those favoring growth with higher risk might consider UDR’s profile.
Which one offers the Superior Shareholder Reward?
I observe that Equity Residential (EQR) delivers a more sustainable shareholder reward than UDR, Inc. (UDR). EQR yields around 4.4% with a payout ratio near 93%, supported by robust free cash flow of 4.35/share, ensuring dividend coverage. Its disciplined buyback program complements the dividend, enhancing total return. In contrast, UDR offers a higher yield (~4.7%) but with an unsustainable payout ratio exceeding 140%, relying heavily on debt, which raises financial risk. UDR’s weak free cash flow and minimal buyback activity limit long-term value creation. I conclude EQR’s balanced dividend and buyback strategy provides superior total return quality in 2026.
Comparative Score Analysis: The Strategic Profile
The radar chart reveals the fundamental DNA and trade-offs of Equity Residential and UDR, Inc., highlighting their financial strengths and vulnerabilities:
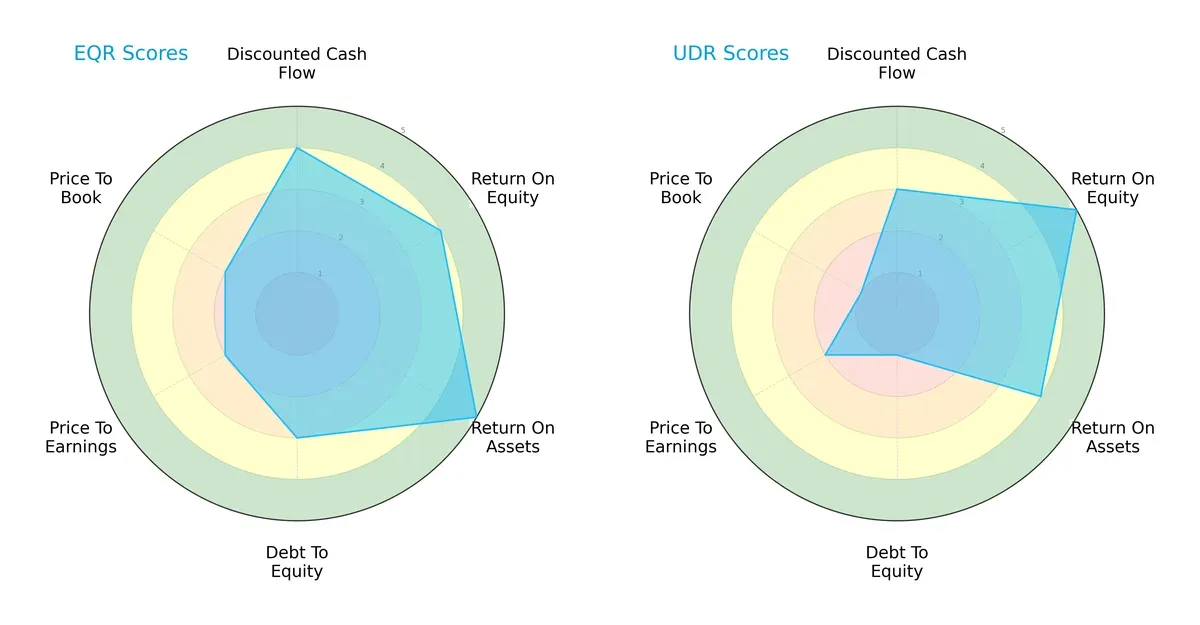
Equity Residential shows a balanced profile with strong ROA (5) and moderate debt-to-equity (3), reflecting efficient asset use and controlled leverage. UDR excels in ROE (5) but suffers from weak leverage (1) and valuation scores (P/E 2, P/B 1). EQR relies on steady asset returns; UDR leverages equity efficiency but carries higher financial risk.
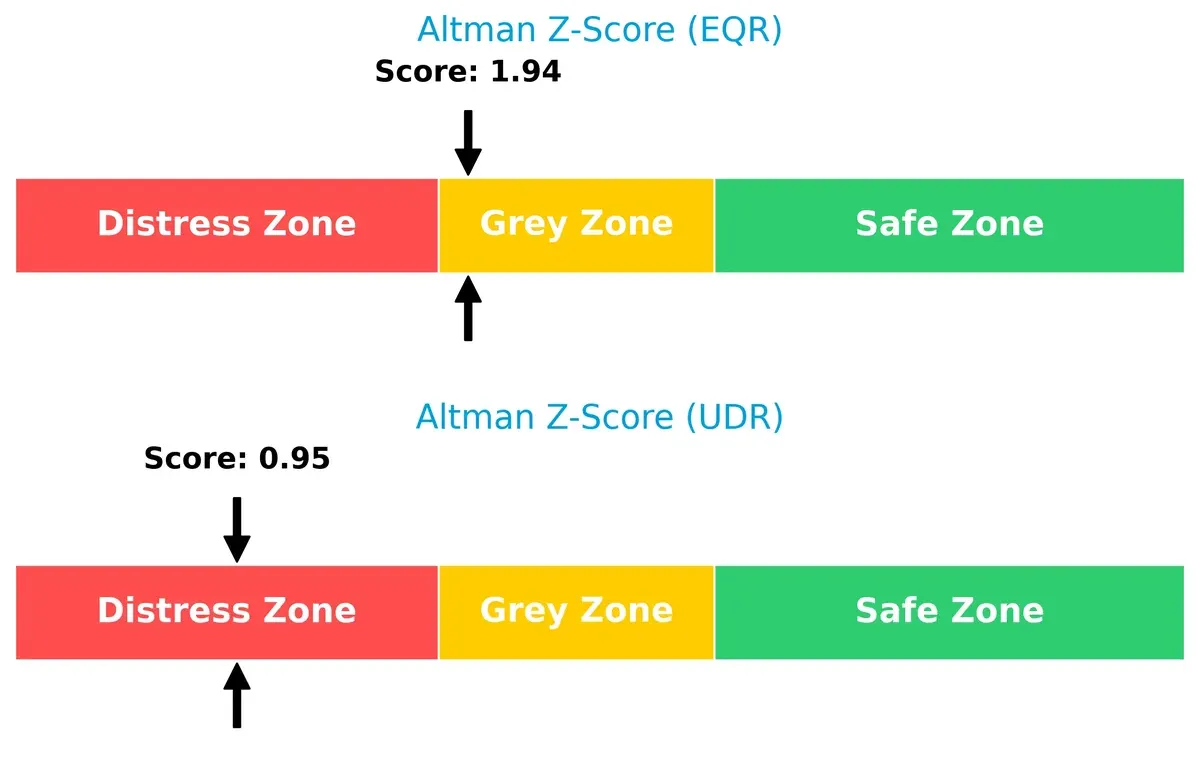
Bankruptcy Risk: Solvency Showdown
Equity Residential’s Altman Z-Score of 1.94 places it in the grey zone, while UDR’s 0.95 signals distress, implying EQR has a safer solvency outlook in this cycle:
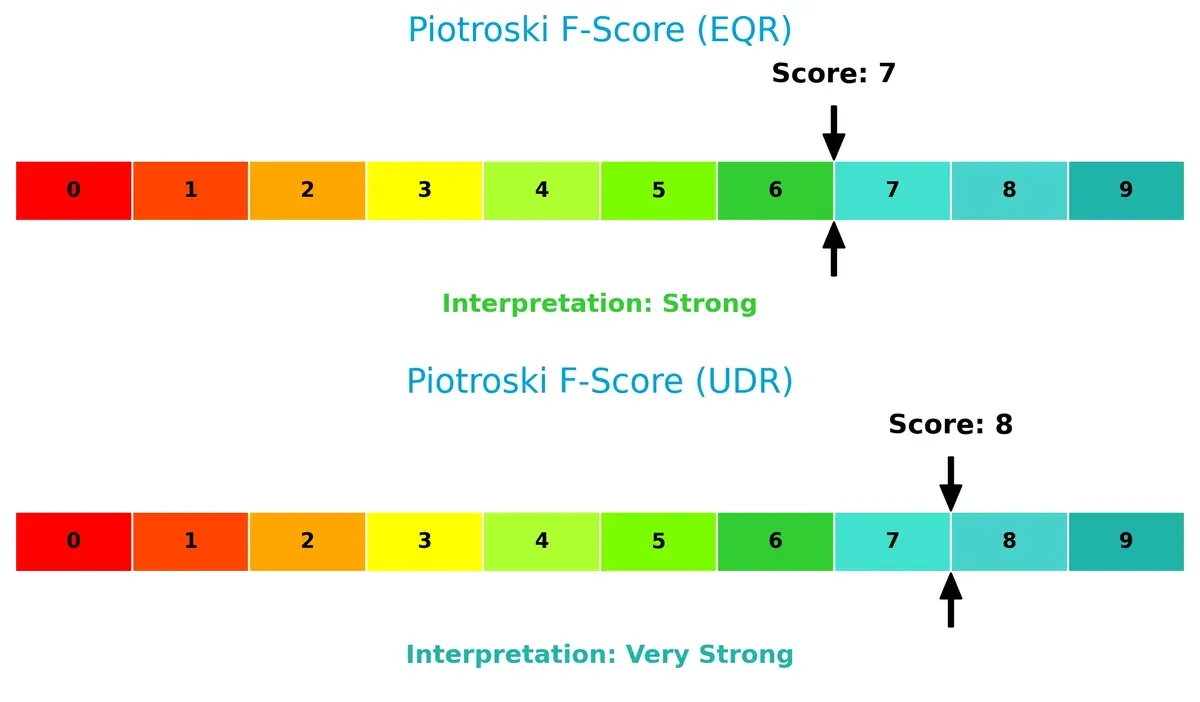
Financial Health: Quality of Operations
UDR scores an 8, indicating very strong financial health, slightly outperforming Equity Residential’s strong 7, suggesting UDR has better internal operational metrics despite solvency concerns:
How are the two companies positioned?
This section dissects the operational DNA of Equity Residential and UDR by comparing their revenue distribution and internal dynamics. The goal is to confront their economic moats to identify which model offers the most resilient, sustainable competitive advantage today.
Revenue Segmentation: The Strategic Mix
This visual comparison dissects how Equity Residential and UDR, Inc. diversify their income streams and where their primary sector bets lie:
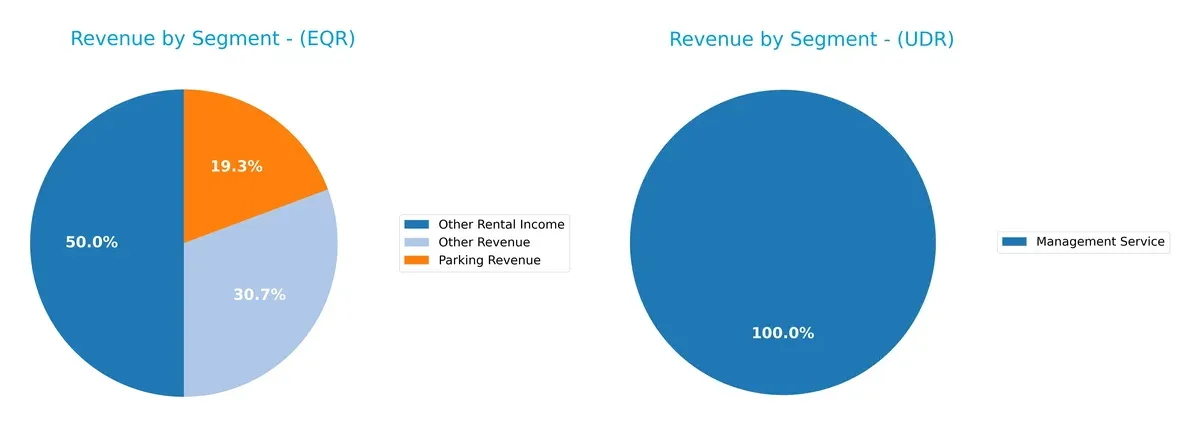
Equity Residential’s 2012 data reveals a geographically diversified portfolio with Northeast at $818M, Northwest $441M, Southeast $352M, and Southwest $503M. This balanced spread reduces concentration risk. In contrast, UDR leans heavily on “Total Communities” revenue, eclipsing $948M in 2016, anchored by “Non Mature Communities” at $223M. UDR’s mix signals a reliance on development growth, increasing exposure to market cycles compared to EQR’s stable regional diversification.
Strengths and Weaknesses Comparison
This table compares the Strengths and Weaknesses of Equity Residential and UDR, Inc.:
Equity Residential Strengths
- High net margin at 36.12%
- Strong ROIC of 219.27% well above WACC
- Favorable interest coverage and dividend yield
- Diverse revenue streams including rental, parking, and utilities
- Solid fixed asset turnover at 6.82
UDR, Inc. Strengths
- Favorable net margin of 22.06%
- ROIC of 29.38% exceeds WACC
- Favorable quick ratio and infinite interest coverage
- Diverse geographic revenue across multiple U.S. regions
- Strong fixed asset turnover of 9.13
- Higher dividend yield at 4.68%
Equity Residential Weaknesses
- Extremely low current and quick ratios at 0.05 signal liquidity risk
- Low asset turnover at 0.15 indicates less efficient asset use
- Neutral debt levels but low liquidity is a red flag
- Neutral PE and PB ratios suggest limited market premium
- No detailed geographic revenue segmentation
UDR, Inc. Weaknesses
- Unfavorable PE of 32.08 and PB of 3.68 indicating possible overvaluation
- High debt-to-equity ratio at 1.88 and debt/assets at 58.34%
- Unfavorable current ratio at 3.31 despite favorable quick ratio
- Asset turnover still low at 0.16, limiting operational efficiency
- Geographic diversification could increase complexity and costs
Equity Residential excels in profitability and efficient capital use but faces liquidity constraints. UDR shows better liquidity and geographic diversity but bears higher debt and valuation risks. Both companies demonstrate slightly favorable financial profiles with distinct strategic challenges.
The Moat Duel: Analyzing Competitive Defensibility
A structural moat is crucial to protect long-term profits from relentless competition erosion. Let’s dissect the moats of two leading residential REITs:
Equity Residential: Urban Location and Scale Advantage
Equity Residential’s moat stems from prime urban properties and scale, delivering strong ROIC well above W&P. Its financials show margin resilience despite recent revenue pressure. Expansion in high-demand cities could deepen this advantage in 2026.
UDR, Inc.: Operational Efficiency and Growth Focus
UDR’s moat lies in operational excellence and disciplined capital allocation, reflected in consistent ROIC growth and margin expansion. Unlike Equity Residential, UDR’s growth trajectory and margin improvement signal a widening moat, with opportunities in emerging markets.
Urban Location vs. Operational Excellence: Who Defends Better?
Equity Residential’s scale and location provide a wide moat, but UDR’s growing ROIC and margin gains reveal a deeper moat. I see UDR better positioned to defend and expand market share in evolving residential markets.
Which stock offers better returns?
Equity Residential and UDR, Inc. both show positive price momentum over the past year, with clear acceleration in their upward trends and rising trading volumes.
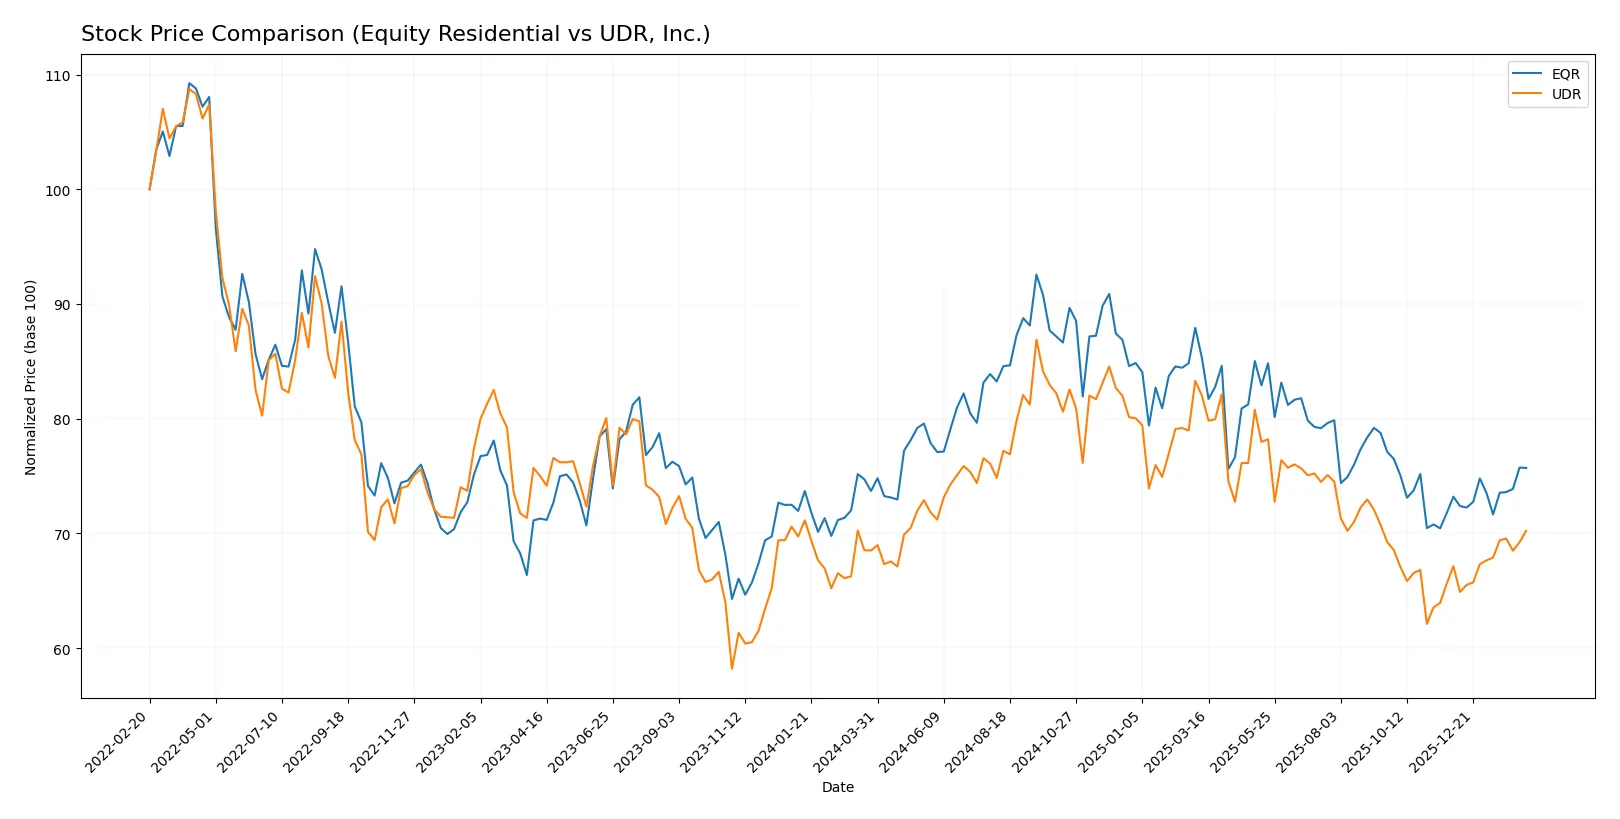
Trend Comparison
Equity Residential’s stock gained 2.72% over the past 12 months, indicating a bullish trend with accelerating momentum. The price ranged from $59.42 to $78.08, reflecting moderate volatility (std dev 4.62).
UDR, Inc. rose 2.5% over the same period, also bullish with accelerating gains. It traded between $33.69 and $47.13, showing slightly lower volatility (std dev 3.11).
Both stocks exhibit acceleration, but Equity Residential’s 2.72% gain slightly outperforms UDR’s 2.5% over the last year.
Target Prices
Analysts present a cautiously optimistic target consensus for these residential REITs.
| Company | Target Low | Target High | Consensus |
|---|---|---|---|
| Equity Residential | 63.0 | 78.5 | 70.85 |
| UDR, Inc. | 38.0 | 44.0 | 41.18 |
The target consensus for Equity Residential exceeds the current price of $63.86, suggesting upside potential. UDR’s consensus target also sits above its $38.09 market price, indicating moderate growth expectations.

Don’t Let Luck Decide Your Entry Point
Optimize your entry points with our advanced ProRealTime indicators. You’ll get efficient buy signals with precise price targets for maximum performance. Start outperforming now!
How do institutions grade them?
Equity Residential Grades
Here are the recent grades from reputable financial institutions for Equity Residential:
| Grading Company | Action | New Grade | Date |
|---|---|---|---|
| Cantor Fitzgerald | maintain | Neutral | 2026-02-09 |
| BMO Capital | downgrade | Market Perform | 2026-01-09 |
| UBS | maintain | Buy | 2026-01-08 |
| Barclays | maintain | Overweight | 2025-11-25 |
| Mizuho | maintain | Neutral | 2025-11-24 |
| Truist Securities | maintain | Buy | 2025-11-17 |
| Morgan Stanley | maintain | Equal Weight | 2025-11-13 |
| Wells Fargo | maintain | Equal Weight | 2025-11-10 |
| UBS | maintain | Buy | 2025-11-10 |
| Scotiabank | maintain | Sector Perform | 2025-11-04 |
UDR, Inc. Grades
Here are the latest grades issued by recognized grading firms for UDR, Inc.:
| Grading Company | Action | New Grade | Date |
|---|---|---|---|
| RBC Capital | maintain | Sector Perform | 2026-02-11 |
| Evercore ISI Group | maintain | Outperform | 2026-02-11 |
| Cantor Fitzgerald | maintain | Neutral | 2026-02-11 |
| Truist Securities | upgrade | Buy | 2026-01-20 |
| Goldman Sachs | maintain | Sell | 2026-01-20 |
| UBS | maintain | Buy | 2026-01-08 |
| JP Morgan | downgrade | Underweight | 2025-12-18 |
| Truist Securities | maintain | Hold | 2025-12-01 |
| Barclays | maintain | Overweight | 2025-11-25 |
| Mizuho | maintain | Neutral | 2025-11-24 |
Which company has the best grades?
Equity Residential has consistently positive grades, including multiple “Buy” and “Overweight” ratings, while UDR shows more grade variability with “Buy” and “Sell” ratings. Equity Residential’s steadier grades suggest a more consensus positive outlook, potentially signaling more stable investor confidence.
Risks specific to each company
The following categories identify the critical pressure points and systemic threats facing both firms in the 2026 market environment:
1. Market & Competition
Equity Residential
- Larger market cap of $24.3B offers scale advantages in competitive urban markets.
UDR, Inc.
- Smaller $12.6B market cap limits scale but focuses on targeted U.S. markets with redevelopment opportunities.
2. Capital Structure & Debt
Equity Residential
- Moderate debt-to-assets at 42.3% with favorable interest coverage of 5.58x.
UDR, Inc.
- Higher leverage with 58.3% debt-to-assets and very unfavorable debt-to-equity score of 1.88, raising financial risk.
3. Stock Volatility
Equity Residential
- Beta of 0.76 indicates moderate sensitivity to market swings, supporting price stability.
UDR, Inc.
- Slightly lower beta at 0.71 suggests marginally less volatility, though trading volume is higher.
4. Regulatory & Legal
Equity Residential
- Operates primarily in large metro areas with evolving housing regulations, requiring adaptive compliance.
UDR, Inc.
- Faces regulatory risks in diverse urban markets with ongoing development projects, increasing legal complexity.
5. Supply Chain & Operations
Equity Residential
- Manages 78,568 units across 305 properties, benefiting from operational scale but exposed to urban construction costs.
UDR, Inc.
- Owns 51,649 units with 1,031 under development, balancing stable cash flow with development execution risks.
6. ESG & Climate Transition
Equity Residential
- Focuses on sustainable communities; however, energy efficiency upgrades could pressure margins.
UDR, Inc.
- Demonstrates commitment to ESG with redevelopment projects but must manage climate risks in geographic footprint.
7. Geopolitical Exposure
Equity Residential
- Concentration in U.S. urban hubs limits geopolitical risk but exposes to local market shocks.
UDR, Inc.
- Also U.S.-centric, but with diverse geographic locations that moderate regional political and economic risks.
Which company shows a better risk-adjusted profile?
Equity Residential’s moderate leverage and scale provide a more balanced risk posture versus UDR’s higher debt levels and less favorable capital structure. EQR’s Altman Z-score in the grey zone signals caution but less distress than UDR’s distress zone score. UDR’s very strong Piotroski score indicates operational strength despite financial risks. I view Equity Residential as having a superior risk-adjusted profile due to its financial stability and scale advantages. UDR’s elevated leverage and lower credit scores raise concerns amid rising interest rates.
Final Verdict: Which stock to choose?
Equity Residential (EQR) excels as a cash machine with a very favorable moat, driven by a ROIC far exceeding its WACC. Its operational efficiency and strong dividend yield stand out. However, its precarious liquidity position calls for caution. EQR suits portfolios focused on stable income with moderate growth.
UDR, Inc. boasts a strategic moat through steady profitability and a very strong Piotroski score, reflecting robust financial health. Its balance sheet shows better liquidity, but heavier leverage raises risk concerns. UDR fits investors seeking growth at a reasonable price with a tilt towards safety.
If you prioritize durable value creation and consistent dividend income, Equity Residential outshines with its superior capital efficiency and operational resilience. However, if you seek growth combined with relative liquidity comfort, UDR offers better stability despite its higher leverage and premium valuation. Both appear slightly favorable but cater to distinct risk profiles.
Disclaimer: Investment carries a risk of loss of initial capital. The past performance is not a reliable indicator of future results. Be sure to understand risks before making an investment decision.
Go Further
I encourage you to read the complete analyses of Equity Residential and UDR, Inc. to enhance your investment decisions: