Home > Comparison > Real Estate > EQR vs MAA
The strategic rivalry between Equity Residential and Mid-America Apartment Communities defines the competitive landscape of the residential REIT sector. Equity Residential operates a concentrated portfolio in high-barrier urban markets, emphasizing premium city living. In contrast, Mid-America Apartment Communities focuses on broader geographic diversification with a value-oriented approach in growing suburban regions. This analysis will evaluate which model offers superior risk-adjusted returns for investors seeking exposure to residential real estate.

Table of contents
Companies Overview
Equity Residential and Mid-America Apartment Communities dominate key U.S. residential real estate markets with distinct regional focuses.
Equity Residential: Urban Residential Powerhouse
Equity Residential specializes in acquiring and managing premium urban apartment properties. Its core revenue stems from rents collected on 78,568 units across major coastal cities like New York and San Francisco. In 2026, the company emphasizes enhancing tenant experience and maintaining high occupancy in dense, dynamic metropolitan areas where demand stays robust.
Mid-America Apartment Communities, Inc.: Regional Growth Leader
Mid-America Apartment Communities focuses on owning and developing quality apartments primarily in the Southeast and Southwest U.S. Its revenue engine relies on rents from 102,772 units spread over 16 states plus D.C. The firm prioritizes expansion and redevelopment to capture growth in fast-growing Sun Belt markets with favorable demographic trends.
Strategic Collision: Similarities & Divergences
Both firms operate as residential REITs with a focus on apartment communities but diverge geographically and strategically. Equity Residential bets on dense urban hubs with high barriers to entry, while Mid-America targets growth corridors with redevelopment upside. Their competitive front is rent growth and tenant retention. Investors face contrasting profiles: Equity Residential offers coastal urban stability; Mid-America brings Sun Belt expansion potential.
Income Statement Comparison
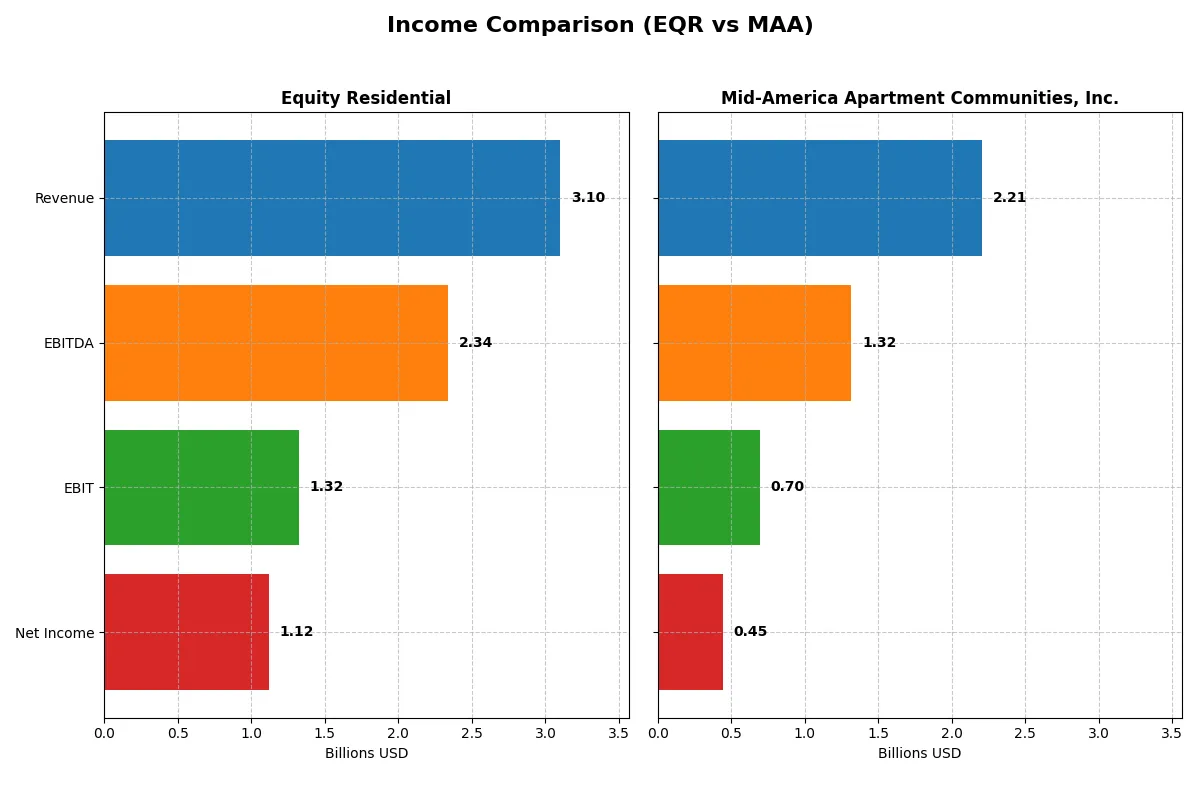
This data dissects the core profitability and scalability of both corporate engines to reveal who dominates the bottom line:
| Metric | Equity Residential (EQR) | Mid-America Apartment Communities, Inc. (MAA) |
|---|---|---|
| Revenue | 3.10B | 2.21B |
| Cost of Revenue | 1.66B | 1.51B |
| Operating Expenses | 310.0M | 83.6M |
| Gross Profit | 1.44B | 703.1M |
| EBITDA | 2.34B | 1.32B |
| EBIT | 1.32B | 696.0M |
| Interest Expense | 237.4M | 185.3M |
| Net Income | 1.12B | 446.9M |
| EPS | 2.97 | 3.79 |
| Fiscal Year | 2025 | 2025 |
Income Statement Analysis: The Bottom-Line Duel
This income statement comparison reveals the true operational efficiency and profitability momentum of two leading apartment REITs.
Equity Residential Analysis
Equity Residential’s revenue grew steadily from 2.46B in 2021 to 3.10B in 2025, showing robust top-line expansion. Despite a sharp gross profit decline in 2025, its gross margin remains strong at 46.3%. The 36.1% net margin and 52% EBIT growth highlight efficient cost control and improving profitability in the latest year.
Mid-America Apartment Communities, Inc. Analysis
Mid-America’s revenue climbed from 1.78B in 2021 to 2.21B in 2025, a slower pace than its peer. Gross margin softened to 31.8%, reflecting higher cost pressure. Net margin contracted to 20.2%, with a 2.4% EBIT decline in 2025, suggesting margin compression and weaker operational momentum.
Margin Strength vs. Revenue Growth
Equity Residential dominates with superior margins and accelerating EBIT growth, despite a recent gross profit dip. Mid-America shows steady revenue gains but struggles with margin erosion and declining profitability. For investors prioritizing operational efficiency and earnings momentum, Equity Residential presents a more compelling profile.
Financial Ratios Comparison
These vital ratios act as a diagnostic tool to expose the underlying fiscal health, valuation premiums, and capital efficiency of the companies compared below:
| Ratios | Equity Residential (EQR) | Mid-America Apartment Communities, Inc. (MAA) |
|---|---|---|
| ROE | 9.38% | 7.89% |
| ROIC | 8.93% | 10.18% |
| P/E | 26.24 | 36.36 |
| P/B | 2.46 | 2.87 |
| Current Ratio | 0.16 | 0.08 |
| Quick Ratio | 0.16 | 0.08 |
| D/E | 0.76 | 0.95 |
| Debt-to-Assets | 40.4% | 45.1% |
| Interest Coverage | 6.38 | 3.34 |
| Asset Turnover | 0.14 | 0.18 |
| Fixed Asset Turnover | 6.54 | N/A |
| Payout ratio | 98.6% | 159% |
| Dividend yield | 3.76% | 4.36% |
| Fiscal Year | 2024 | 2025 |
Efficiency & Valuation Duel: The Vital Signs
Financial ratios act like a company’s DNA, unveiling hidden risks and operational strengths that shape investor decisions.
Equity Residential
Equity Residential posts a solid net margin of 34.76% but a modest ROE at 9.38%, signaling moderate profitability. Its P/E ratio of 26.24 suggests the stock trades at a premium, possibly stretched. The firm rewards shareholders with a 3.76% dividend yield, reflecting a balanced income approach over aggressive growth.
Mid-America Apartment Communities, Inc.
Mid-America shows a leaner 20.23% net margin and a lower ROE of 7.89%, indicating restrained profitability. The stock appears expensive with a P/E of 36.36. It delivers a slightly higher 4.36% dividend yield, prioritizing shareholder returns despite a challenging asset turnover and fixed asset efficiency.
Premium Valuation vs. Operational Safety
Both stocks face slightly unfavorable ratio profiles, but Equity Residential balances robust margins with consistent dividends. Mid-America’s higher P/E and lower efficiency metrics raise caution. Investors seeking steadier operations might prefer Equity Residential, while those valuing income yield could lean toward Mid-America’s dividend profile.
Which one offers the Superior Shareholder Reward?
I compare Equity Residential (EQR) and Mid-America Apartment Communities, Inc. (MAA) on dividends and buybacks. EQR yields ~3.8% with a near 100% payout, supported by strong free cash flow (3.3/share). MAA offers a slightly higher yield (~4.3%) but with a payout ratio above 130%, signaling risk. EQR maintains steady buybacks, enhancing returns sustainably. MAA’s reinvestment in growth shows promise but carries leverage risks with a higher debt-to-equity ratio. I conclude EQR offers a more balanced and sustainable total shareholder return in 2026.
Comparative Score Analysis: The Strategic Profile
The radar chart reveals the fundamental DNA and trade-offs of Equity Residential and Mid-America Apartment Communities, highlighting their financial strengths and vulnerabilities:
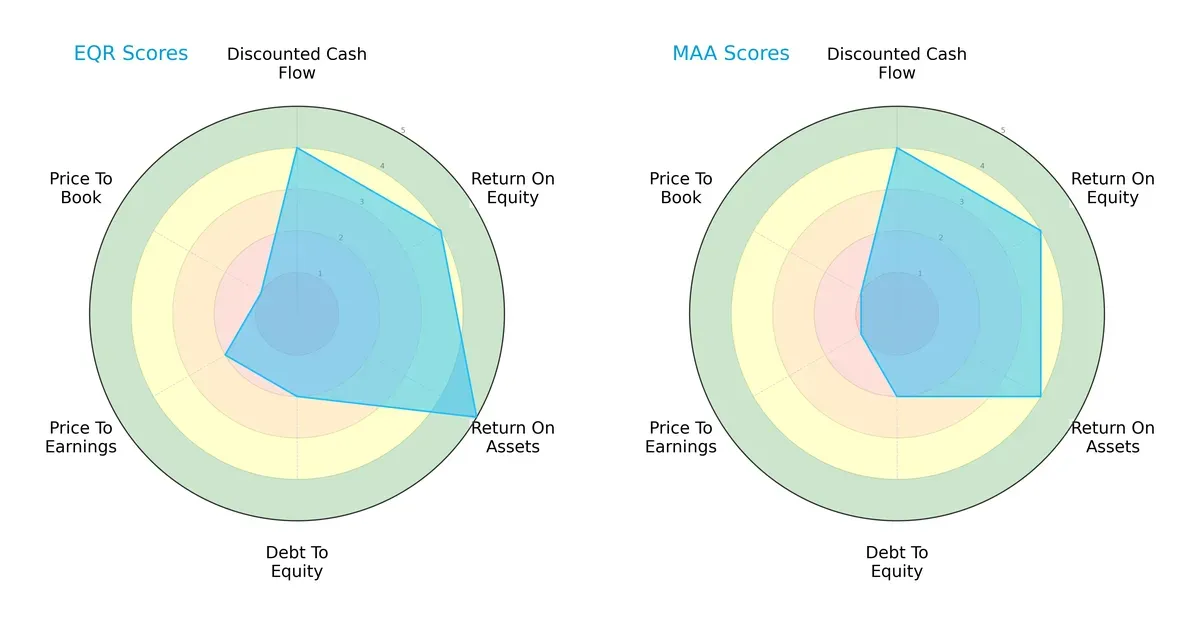
Equity Residential (EQR) scores higher on return on assets (5 vs. 4) and maintains a slightly better valuation on price-to-earnings (2 vs. 1). Both firms share identical discounted cash flow (4) and return on equity (4) scores. However, both face challenges with debt-to-equity (2) and price-to-book (1), signaling balance sheet leverage and valuation concerns. EQR shows a more balanced profile, benefiting from asset efficiency, while MAA leans on steady equity returns but lags in valuation metrics.
Bankruptcy Risk: Solvency Showdown
EQR’s Altman Z-Score of 1.80 places it in the grey zone, suggesting moderate bankruptcy risk, while MAA’s 1.69 falls in the distress zone, indicating heightened financial vulnerability in this cycle:

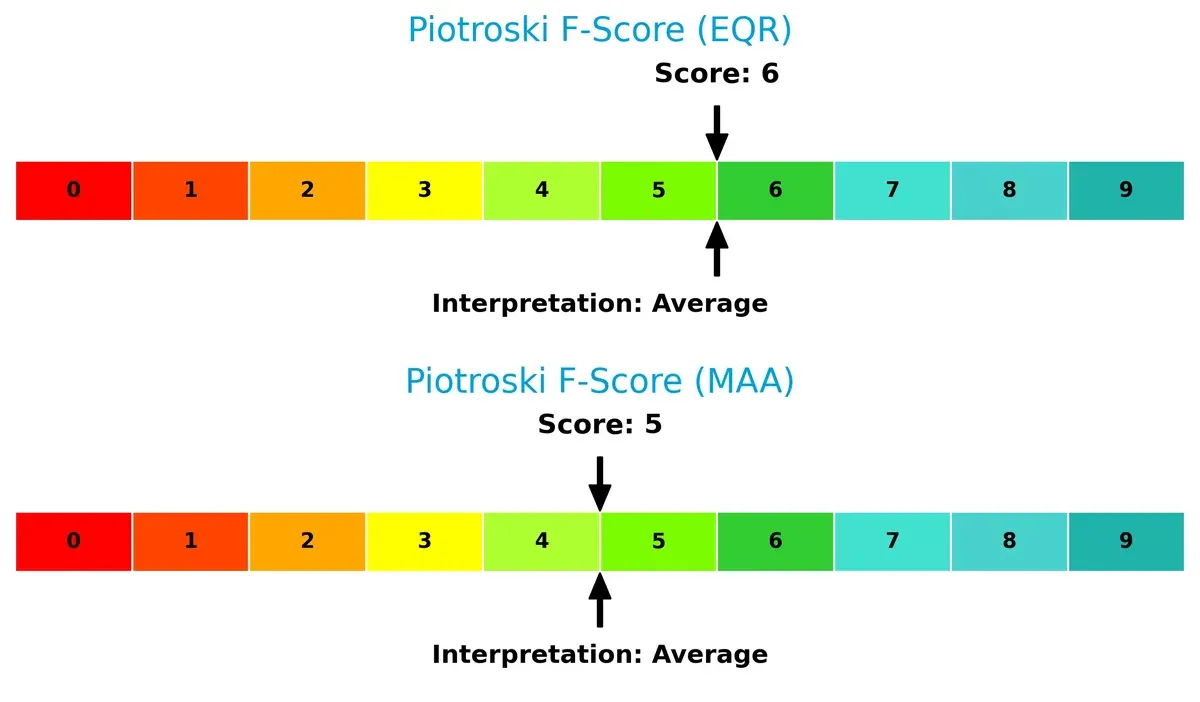
Financial Health: Quality of Operations
Both companies register average Piotroski F-Scores (EQR 6, MAA 5), reflecting moderate financial health without alarming red flags. EQR slightly outperforms, suggesting firmer internal operations and profitability metrics:
How are the two companies positioned?
This section dissects the operational DNA of EQR and MAA by comparing their revenue distribution and internal dynamics. The goal is to confront their economic moats and identify which model offers the most resilient, sustainable advantage today.
Revenue Segmentation: The Strategic Mix
This visual comparison dissects how Equity Residential and Mid-America Apartment Communities diversify their income streams and where their primary sector bets lie:
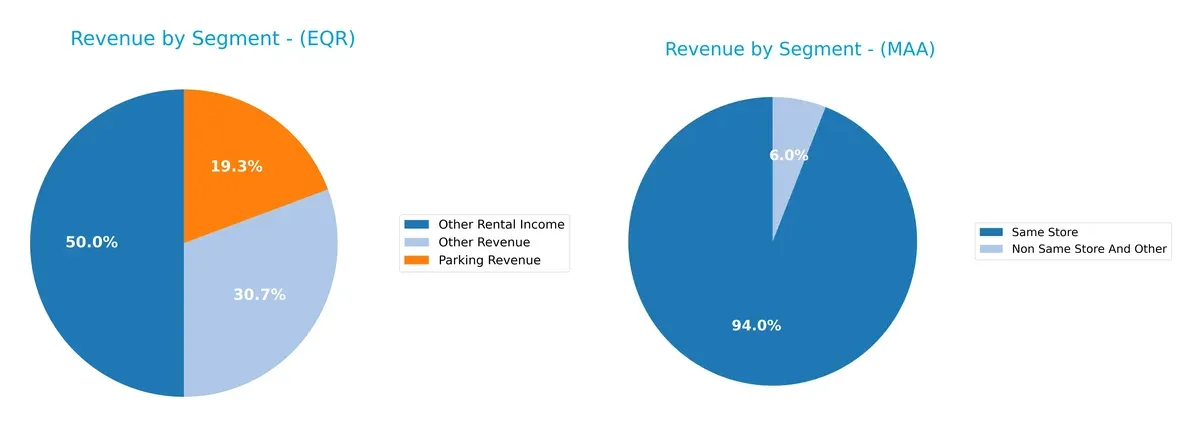
Equity Residential reveals a fragmented revenue base with smaller segments like Other Rental Income at $57.5M and Parking Revenue at $22.2M in 2020, indicating diversification beyond core leasing. Mid-America Apartment Communities anchors revenue more heavily in Same Store operations, generating $2.08B in 2024, dwarfing its Non Same Store segment at $106M. MAA’s focus suggests stable cash flow from established assets, while EQR’s mix reduces concentration risk but may dilute operational focus.
Strengths and Weaknesses Comparison
This table compares the strengths and weaknesses of Equity Residential and Mid-America Apartment Communities, Inc.:
Equity Residential Strengths
- High net margin of 34.76%
- Favorable interest coverage at 5.58
- Strong fixed asset turnover at 6.54
- Dividend yield of 3.76%
Mid-America Apartment Communities Strengths
- Extremely high ROIC at 1017.71%
- Favorable WACC at 6.46%
- Solid net margin of 20.23%
- Dividend yield of 4.36%
Equity Residential Weaknesses
- Unfavorable ROE at 9.38%
- Low current and quick ratios at 0.16
- Unfavorable P/E of 26.24
- Low asset turnover of 0.14
Mid-America Apartment Communities Weaknesses
- Unfavorable P/E of 36.36
- Zero current and quick ratios
- Unfavorable fixed asset turnover at 0
- Interest coverage moderate at 3.76
Both companies show slightly unfavorable overall financial ratios, though MAA’s exceptional ROIC contrasts with its liquidity concerns. EQR exhibits better liquidity ratios but weaker capital efficiency. These distinctions imply differing strategic focuses on asset utilization and financial structure.
The Moat Duel: Analyzing Competitive Defensibility
A structural moat protects long-term profits from relentless competitive pressure. It defines which firms sustain market power and which fade away:
Equity Residential (EQR): Urban Concentration and Operational Efficiency
EQR’s moat stems from its focus on high-demand urban coastal markets, generating stable margins and a growing ROIC trend. New developments in tech hubs could deepen this advantage in 2026.
Mid-America Apartment Communities, Inc. (MAA): Regional Scale and Capital Discipline
MAA leverages scale in the Sunbelt and Mid-Atlantic with a strong ROIC far exceeding WACC, reflecting superior capital allocation. Expansion into emerging Sunbelt cities promises to reinforce its moat.
Market Positioning: Urban Core Focus vs. Regional Scale Dominance
MAA’s significantly higher ROIC and value creation signal a deeper moat than EQR’s urban niche. MAA’s disciplined capital use better equips it to defend and grow market share amid evolving residential demand.
Which stock offers better returns?
Both Equity Residential and Mid-America Apartment Communities, Inc. exhibit modest price gains over the past year, with Equity Residential showing stronger recent upward momentum.
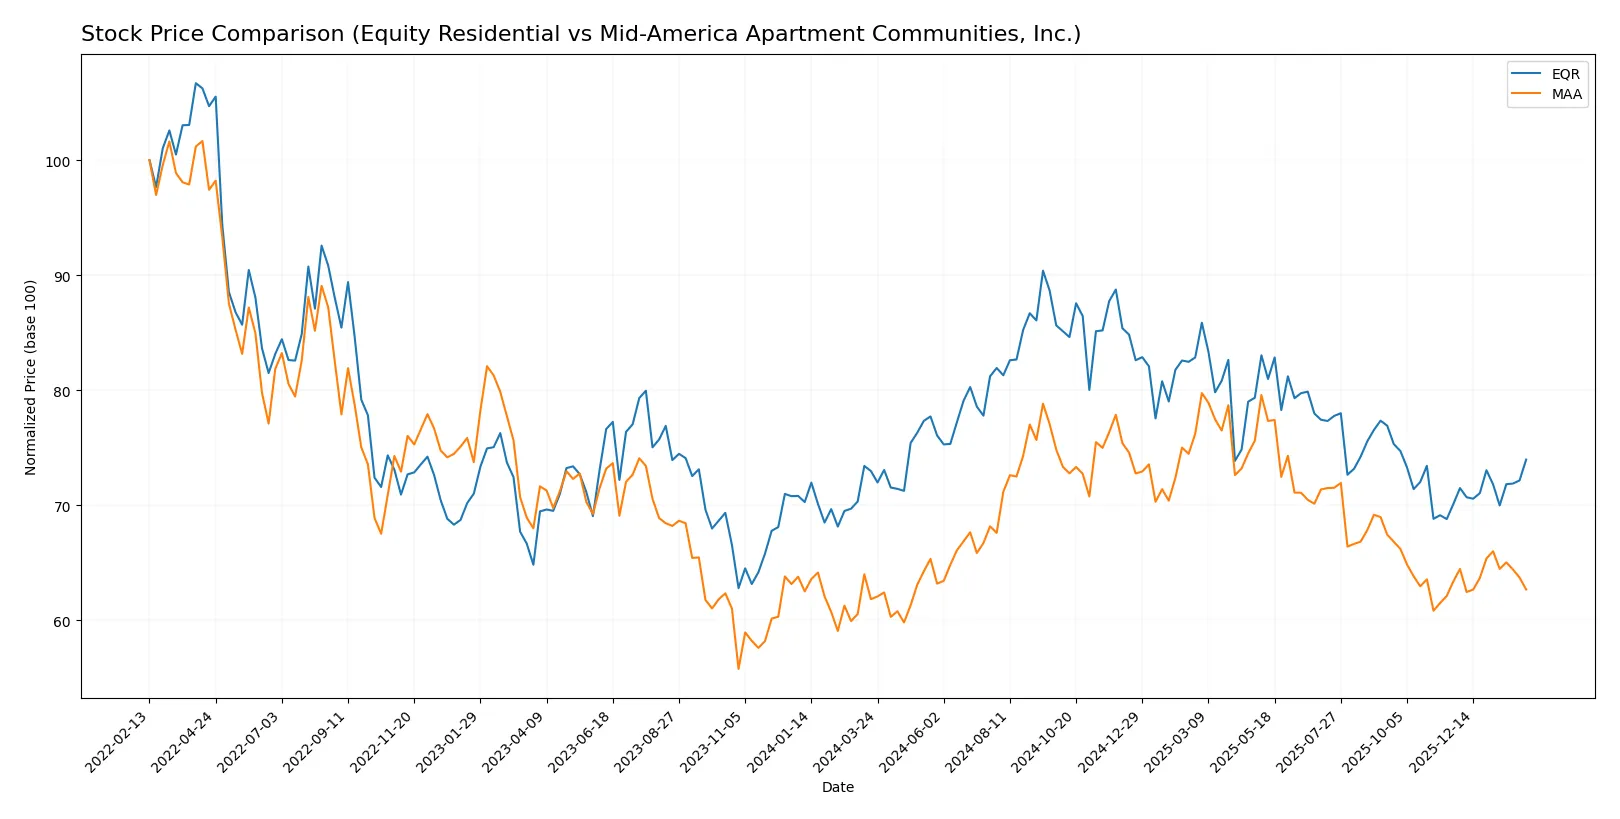
Trend Comparison
Equity Residential’s stock rose 1.36% over the past 12 months, indicating a mild bullish trend with accelerating momentum and a narrowing recent volatility of 0.97.
Mid-America Apartment Communities, Inc. gained 1.37% over the same period, also bullish with acceleration but higher overall volatility at 11.52; recent months show a slight bearish pullback.
Equity Residential’s recent positive slope and buyer dominance suggest stronger short-term performance compared to Mid-America’s slight recent decline despite similar annual gains.
Target Prices
Analysts present a clear target price consensus for both Equity Residential and Mid-America Apartment Communities, Inc.
| Company | Target Low | Target High | Consensus |
|---|---|---|---|
| Equity Residential | 35 | 78.5 | 69.29 |
| Mid-America Apartment Communities, Inc. | 134 | 158 | 143.38 |
The consensus target for Equity Residential exceeds its current price of $63.89, signaling moderate upside potential. Mid-America Apartment Communities, trading at $132.13, also shows a meaningful premium to consensus targets, reflecting strong analyst confidence.

Don’t Let Luck Decide Your Entry Point
Optimize your entry points with our advanced ProRealTime indicators. You’ll get efficient buy signals with precise price targets for maximum performance. Start outperforming now!
How do institutions grade them?
Equity Residential Grades
The table below summarizes recent institutional grades for Equity Residential:
| Grading Company | Action | New Grade | Date |
|---|---|---|---|
| BMO Capital | Downgrade | Market Perform | 2026-01-09 |
| UBS | Maintain | Buy | 2026-01-08 |
| Barclays | Maintain | Overweight | 2025-11-25 |
| Mizuho | Maintain | Neutral | 2025-11-24 |
| Truist Securities | Maintain | Buy | 2025-11-17 |
| Morgan Stanley | Maintain | Equal Weight | 2025-11-13 |
| Wells Fargo | Maintain | Equal Weight | 2025-11-10 |
| UBS | Maintain | Buy | 2025-11-10 |
| Scotiabank | Maintain | Sector Perform | 2025-11-04 |
| Evercore ISI Group | Maintain | Outperform | 2025-11-03 |
Mid-America Apartment Communities, Inc. Grades
The table below summarizes recent institutional grades for Mid-America Apartment Communities, Inc.:
| Grading Company | Action | New Grade | Date |
|---|---|---|---|
| RBC Capital | Maintain | Sector Perform | 2026-02-06 |
| Mizuho | Maintain | Outperform | 2026-01-12 |
| BMO Capital | Upgrade | Outperform | 2026-01-09 |
| UBS | Maintain | Neutral | 2026-01-08 |
| Evercore ISI Group | Maintain | In Line | 2025-12-15 |
| Scotiabank | Downgrade | Sector Perform | 2025-12-05 |
| BTIG | Maintain | Buy | 2025-12-05 |
| Barclays | Maintain | Equal Weight | 2025-11-25 |
| Wells Fargo | Maintain | Overweight | 2025-11-25 |
| Mizuho | Maintain | Outperform | 2025-11-24 |
Which company has the best grades?
Mid-America Apartment Communities, Inc. holds stronger recent upgrades and a higher frequency of Outperform ratings than Equity Residential. This may signal better institutional confidence, potentially influencing investor perception and demand.
Risks specific to each company
The following categories identify critical pressure points and systemic threats facing both firms in the 2026 market environment:
1. Market & Competition
Equity Residential
- Faces high competition in top-tier urban markets with premium pricing pressures.
Mid-America Apartment Communities, Inc.
- Operates in diverse regions with risk of regional economic slowdowns impacting demand.
2. Capital Structure & Debt
Equity Residential
- Moderate leverage (D/E 0.76), interest coverage strong at 5.58x, signaling comfort servicing debt.
Mid-America Apartment Communities, Inc.
- Higher leverage (D/E 0.95) with weaker interest coverage at 3.76x, increasing refinancing risk.
3. Stock Volatility
Equity Residential
- Beta at 0.76 indicates lower volatility than market; price range stable between 58.38-75.86.
Mid-America Apartment Communities, Inc.
- Slightly higher beta of 0.78 suggests marginally more sensitivity to market swings.
4. Regulatory & Legal
Equity Residential
- Regulatory risk concentrated in high-cost coastal cities with strict rent controls.
Mid-America Apartment Communities, Inc.
- Exposure to regulatory shifts in Southeast and Southwest states with evolving housing policies.
5. Supply Chain & Operations
Equity Residential
- Urban development projects face rising construction costs and labor shortages.
Mid-America Apartment Communities, Inc.
- Regional dependencies may cause operational disruptions amid localized supply chain issues.
6. ESG & Climate Transition
Equity Residential
- High exposure to coastal climate risks; investment in sustainability initiatives ongoing.
Mid-America Apartment Communities, Inc.
- Growing ESG focus but faces challenges adapting to climate risks across multiple states.
7. Geopolitical Exposure
Equity Residential
- Primarily U.S.-focused with limited direct geopolitical risk.
Mid-America Apartment Communities, Inc.
- Similar domestic focus but regional economic policies could impact profitability.
Which company shows a better risk-adjusted profile?
Equity Residential’s strongest risk is its regulatory exposure in expensive urban markets. Mid-America’s most pressing risk is its elevated leverage combined with weaker interest coverage. Despite both showing slight financial vulnerabilities, Equity Residential’s lower debt stress and stronger interest coverage give it a better risk-adjusted profile. Notably, MAA’s Altman Z-score places it in the distress zone, signaling elevated bankruptcy risk compared to EQR’s grey zone status. This financial caution tips the scales in favor of Equity Residential for more prudent risk management in 2026.
Final Verdict: Which stock to choose?
Equity Residential’s superpower lies in its solid operational efficiency and strong dividend yield, making it a consistent cash generator. However, its low liquidity ratios warrant caution as a point of vigilance. This stock fits well in an aggressive growth portfolio seeking steady income with moderate risk tolerance.
Mid-America Apartment Communities boasts a strategic moat through its exceptional capital efficiency and a robust, growing ROIC that signals sustainable competitive advantage. It offers a safer profile compared to Equity Residential, appealing to investors prioritizing resilience. This makes it suitable for a GARP (Growth at a Reasonable Price) portfolio.
If you prioritize cash flow stability and income generation, Equity Residential is the compelling choice due to its proven operational efficiency and attractive dividend yield. However, if you seek durable competitive advantage with better capital allocation and value creation, Mid-America Apartment Communities offers superior long-term stability and growth potential.
Disclaimer: Investment carries a risk of loss of initial capital. The past performance is not a reliable indicator of future results. Be sure to understand risks before making an investment decision.
Go Further
I encourage you to read the complete analyses of Equity Residential and Mid-America Apartment Communities, Inc. to enhance your investment decisions: