Home > Comparison > Real Estate > EQR vs ESS
The strategic rivalry between Equity Residential and Essex Property Trust defines the trajectory of the residential REIT sector. Equity Residential operates a broad portfolio across dynamic U.S. cities, emphasizing scale and diversification. Essex Property Trust focuses on integrated development and management in select West Coast markets, prioritizing focused growth. This analysis will assess which operational model offers a superior risk-adjusted return for diversified portfolios amid evolving real estate cycles.

Table of contents
Companies Overview
Equity Residential and Essex Property Trust dominate the U.S. residential REIT landscape with distinct geographic and strategic footprints.
Equity Residential: Urban-Centric Residential REIT
Equity Residential focuses on acquiring, developing, and managing residential properties in key dynamic cities. Its revenue stems from leasing 78,568 apartment units across Boston, New York, Seattle, and other major metros. In 2026, it sharpens its strategy on cultivating high-quality, long-term renter communities, reinforcing its premium urban market positioning.
Essex Property Trust: West Coast Multifamily Specialist
Essex Property Trust is a fully integrated REIT specializing in multifamily residential properties primarily on the West Coast. It generates income through ownership and management of 246 apartment communities totaling 60,000 homes, with active development projects underway. Its 2026 strategy centers on selective acquisitions and redevelopment, maintaining a focused regional market dominance.
Strategic Collision: Similarities & Divergences
Both firms operate as residential REITs emphasizing multifamily rentals, yet Equity Residential pursues a broad urban footprint while Essex concentrates on West Coast markets. Their competition centers on attracting stable, long-term renters in high-demand metro areas. Equity Residential offers scale and geographic diversification, whereas Essex provides a niche, focused exposure, shaping two distinct investment profiles for market participants.
Income Statement Comparison
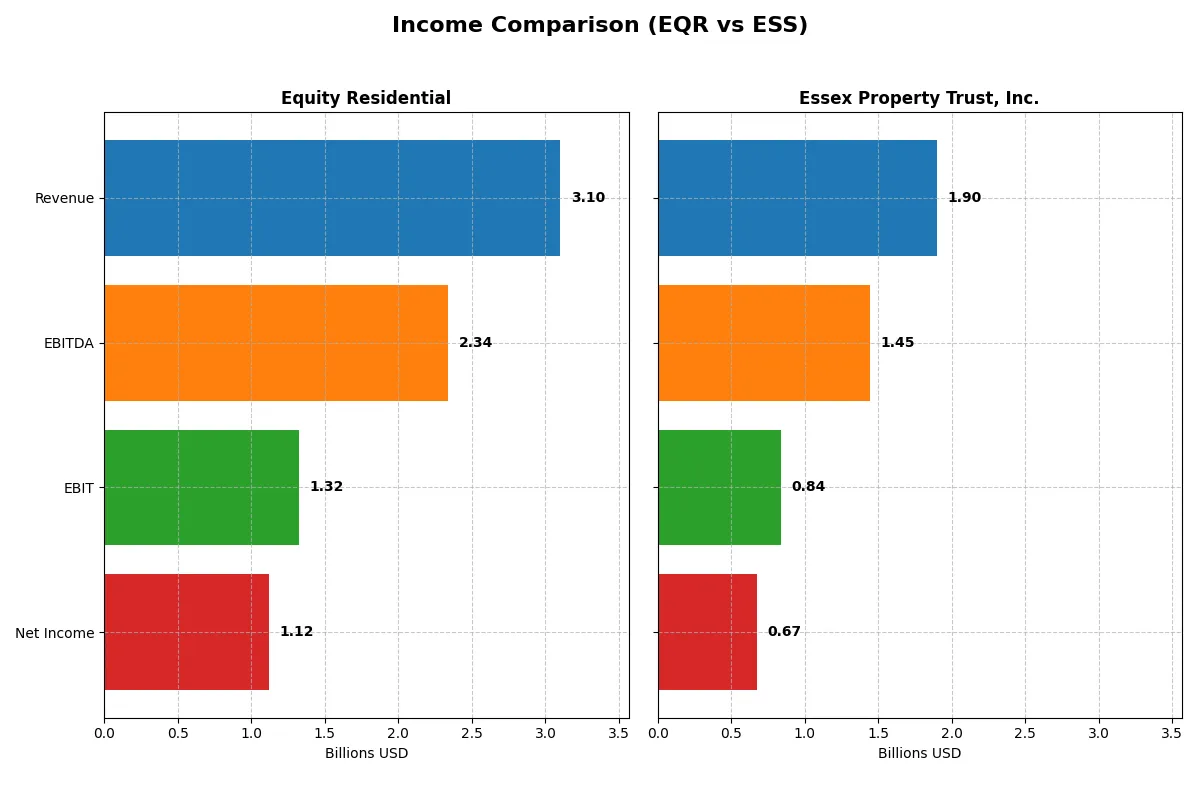
This data dissects the core profitability and scalability of both corporate engines to reveal who dominates the bottom line:
| Metric | Equity Residential (EQR) | Essex Property Trust, Inc. (ESS) |
|---|---|---|
| Revenue | 3.10B | 1.90B |
| Cost of Revenue | 1.66B | 593M |
| Operating Expenses | 310M | 474M |
| Gross Profit | 1.44B | 1.31B |
| EBITDA | 2.34B | 1.45B |
| EBIT | 1.32B | 838M |
| Interest Expense | 237M | 257M |
| Net Income | 1.12B | 672M |
| EPS | 2.97 | 10.41 |
| Fiscal Year | 2025 | 2025 |
Income Statement Analysis: The Bottom-Line Duel
This income statement comparison unveils the core efficiency and profitability dynamics driving each company’s financial engine.
Equity Residential Analysis
Equity Residential’s revenue climbs steadily, reaching $3.1B in 2025, while net income shows moderate growth to $1.12B. Its gross margin contracts to 46.3%, reflecting cost pressures, but EBIT margin rises sharply to 42.7%, signaling enhanced operational efficiency. The 2025 surge in EBIT by 52% underlines strong momentum despite a slight dip in gross profit.
Essex Property Trust, Inc. Analysis
Essex Property Trust grows revenue by 7.1% to $1.9B in 2025, with net income advancing 37.6% over five years to $672M. It boasts a robust gross margin near 69%, outperforming peers, although EBIT margin dips to 44.1% in 2025 following a 20% EBIT decline. The company faces rising interest expenses, pressuring net margin slightly to 35.4%.
Margin Dominance vs. Growth Resilience
Equity Residential demonstrates operational leverage with improved EBIT margins and solid net income growth, despite margin compression. Essex excels in gross margin and long-term net income growth but struggles with recent EBIT and net margin declines. Investors seeking margin stability may prefer Equity; those favoring growth and high gross margins might lean toward Essex.
Financial Ratios Comparison
These vital ratios act as a diagnostic tool to expose the underlying fiscal health, valuation premiums, and capital efficiency of each company:
| Ratios | Equity Residential (EQR) | Essex Property Trust, Inc. (ESS) |
|---|---|---|
| ROE | 9.38% | 13.39% |
| ROIC | 8.93% | 5.61% |
| P/E | 26.24 | 25.08 |
| P/B | 2.46 | 3.31 |
| Current Ratio | 0.16 | 0.66 |
| Quick Ratio | 0.16 | 0.66 |
| D/E (Debt-to-Equity) | 0.76 | 1.20 |
| Debt-to-Assets | 40.4% | 51.5% |
| Interest Coverage | 6.38 | 2.99 |
| Asset Turnover | 0.14 | 0.14 |
| Fixed Asset Turnover | 6.54 | 0.00* |
| Payout Ratio | 98.6% | 97.4% |
| Dividend Yield | 3.76% | 3.88% |
| Fiscal Year | 2024 | 2025 |
*Fixed Asset Turnover for ESS in 2025 is reported as zero.
Efficiency & Valuation Duel: The Vital Signs
Financial ratios act as a company’s DNA, revealing hidden risks and operational excellence that numbers alone cannot express.
Equity Residential
Equity Residential shows a solid net margin of 34.76%, indicating efficient core profitability despite a modest ROE at 9.38%. Its P/E ratio of 26.24 suggests a stretched valuation compared to sector averages. The company rewards shareholders with a 3.76% dividend yield, reflecting steady income rather than aggressive reinvestment.
Essex Property Trust, Inc.
Essex Property Trust posts a similarly strong net margin at 35.38%, but lacks ROE and ROIC data, limiting profitability insight. Its P/E of 25.08 also points to a premium valuation. Essex maintains a comparable dividend yield of 3.88%, signaling consistent shareholder returns amid limited reinvestment visibility.
Valuation Stretch vs. Operational Clarity
Both companies trade at elevated multiples with favorable net margins but face questions on return metrics and liquidity. Equity Residential offers clearer operational efficiency and a stable dividend, while Essex’s incomplete profitability data injects uncertainty. Investors prioritizing transparency and steady income may lean toward Equity Residential.
Which one offers the Superior Shareholder Reward?
I observe that Equity Residential (EQR) delivers a solid dividend yield near 3.8%, backed by nearly full free cash flow coverage and modest buybacks, reflecting a balanced cash return model. Essex Property Trust (ESS) maintains a slightly lower dividend yield around 3.4%, with a higher payout ratio exceeding 100%, signaling aggressive distributions. However, ESS’s larger free cash flow per share and robust operating margins support its capacity for buybacks and dividends, albeit with higher leverage. I find EQR’s distribution model more sustainable given its prudent payout and strong cash flow coverage, which reduces risk in volatile markets. Therefore, in 2026, EQR offers a superior total return profile combining steady dividends and buybacks with financial discipline.
Comparative Score Analysis: The Strategic Profile
The radar chart reveals the fundamental DNA and trade-offs of Equity Residential and Essex Property Trust, Inc.:
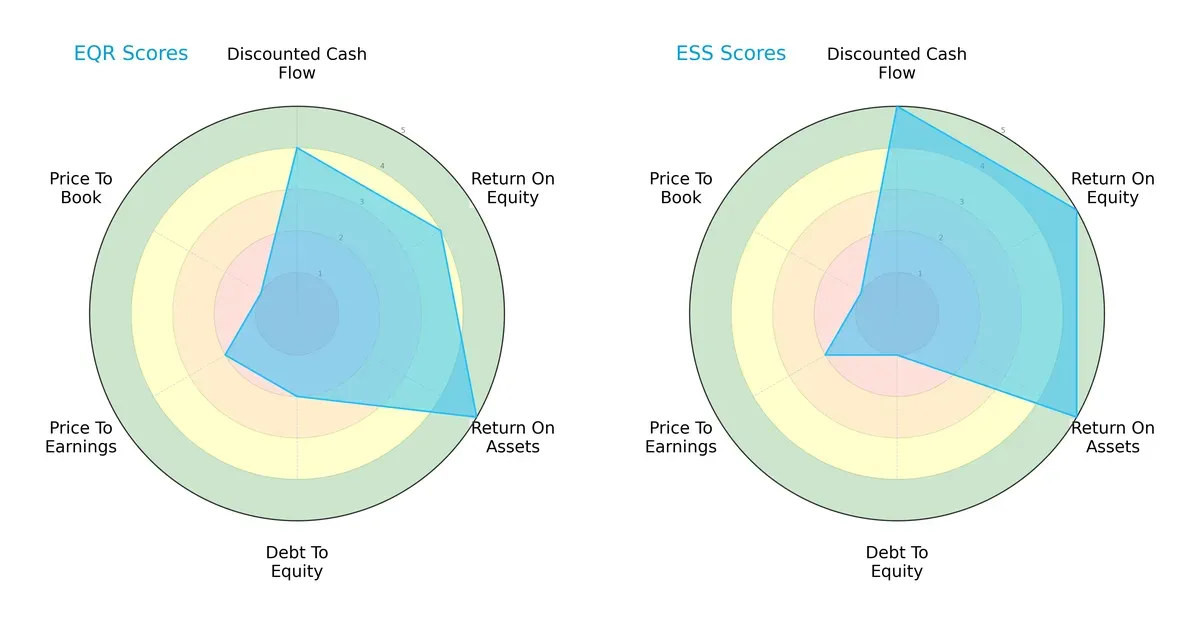
Equity Residential shows balanced strength in ROA (5) and solid DCF (4) and ROE (4) scores but struggles with debt-to-equity (2) and valuation metrics (P/E 2, P/B 1). Essex Property Trust edges out with top scores in DCF (5), ROE (5), and ROA (5), yet faces a very unfavorable debt-to-equity score (1) similar to Equity’s valuation challenges. Essex leans heavily on operational efficiency and cash flow strength, while Equity presents a more moderate risk profile despite weaker leverage metrics.
Bankruptcy Risk: Solvency Showdown
The Altman Z-Score delta highlights a solvency gap with Equity Residential at 1.80 (grey zone) versus Essex Property Trust at 1.70 (distress zone):
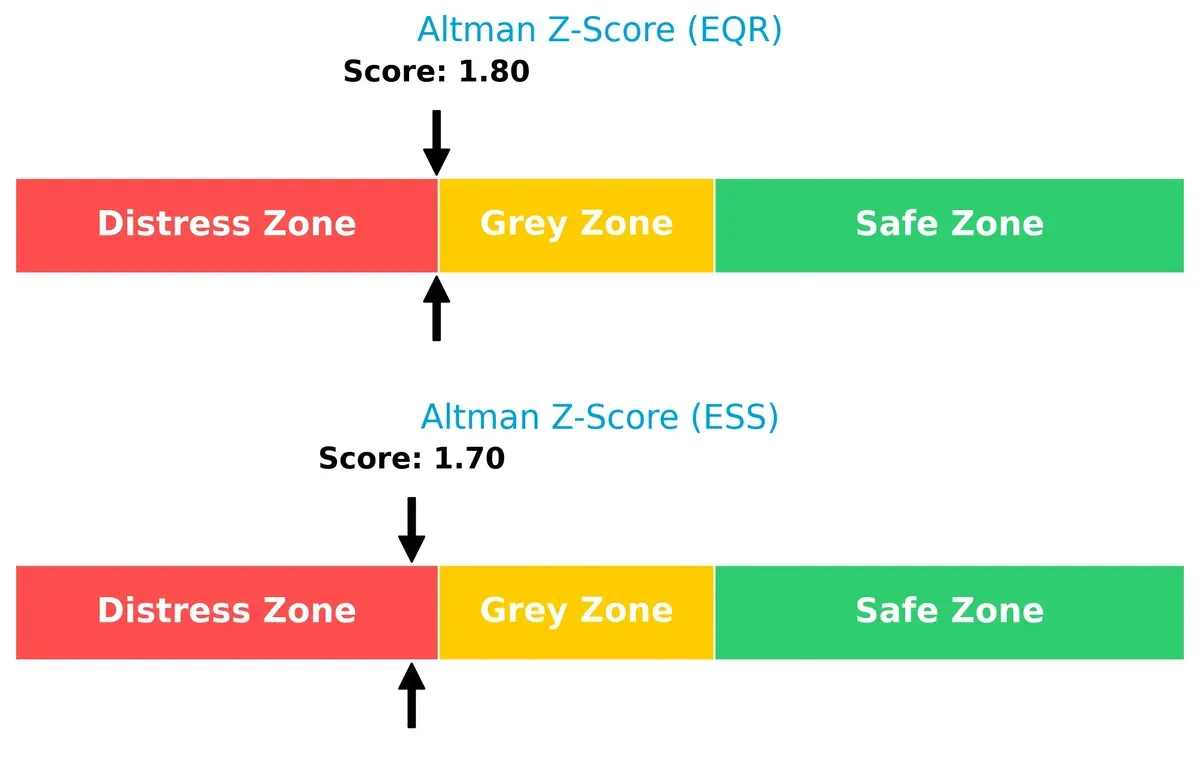
Both firms hover near financial distress thresholds, but Equity Residential maintains a marginally safer position. This suggests Essex faces elevated bankruptcy risk under current economic pressures, warranting cautious portfolio exposure.
Financial Health: Quality of Operations
Piotroski F-Scores reveal operational quality differences: Equity Residential scores 6 (average), Essex Property Trust scores 7 (strong):
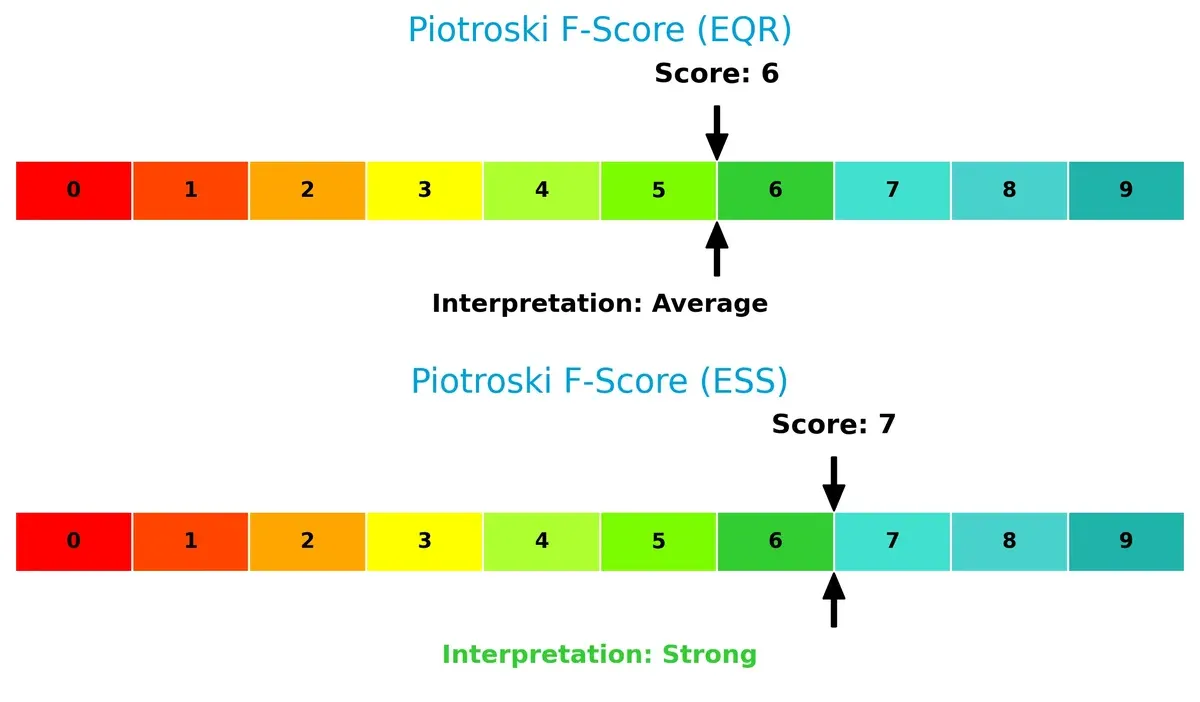
Essex demonstrates superior internal financial health, reflecting stronger profitability and efficiency metrics. Equity’s average score signals some red flags in operational consistency compared to Essex’s more robust profile, reinforcing Essex’s relative strength despite solvency concerns.
How are the two companies positioned?
This section dissects the operational DNA of Equity Residential and Essex Property Trust by comparing their revenue distribution and internal strengths and weaknesses. The goal is to confront their economic moats and reveal which business model delivers the most resilient competitive advantage today.
Revenue Segmentation: The Strategic Mix
This visual comparison dissects how Equity Residential and Essex Property Trust diversify their income streams and where their primary sector bets lie:
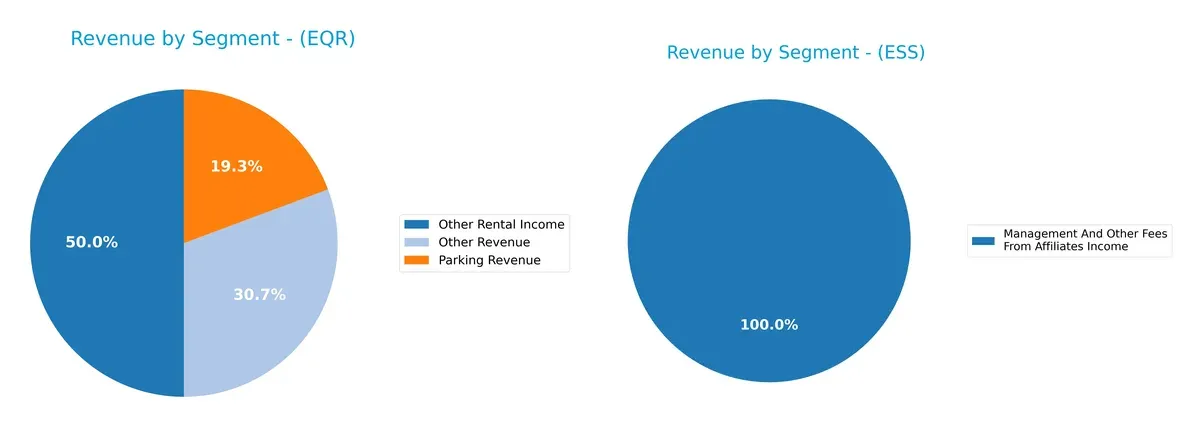
Equity Residential leans on a more diversified revenue mix with segments like Other Rental Income ($92.6M in 2019) and Parking Revenue ($22.2M in 2020). Essex Property Trust pivots heavily on Rental and Other Property Revenues, posting $1.28B in 2018, overshadowing its modest Management Fees (~$11M). Equity’s spread reduces concentration risk, while Essex’s reliance on core property rentals signals infrastructure dominance but exposes it to market cycle swings.
Strengths and Weaknesses Comparison
This table compares the Strengths and Weaknesses of Equity Residential and Essex Property Trust, Inc.:
Equity Residential Strengths
- Strong net margin at 34.76%
- Favorable interest coverage at 5.58
- Solid fixed asset turnover at 6.54
- Consistent dividend yield near 3.76%
- Diversified rental income streams
Essex Property Trust Strengths
- Slightly higher net margin at 35.38%
- Favorable debt-to-equity and debt-to-assets ratios
- Favorable price-to-book ratio
- Dividend yield slightly above 3.8%
- Concentrated revenue in Northern and Southern California
Equity Residential Weaknesses
- Unfavorable low current and quick ratios at 0.16
- Unfavorable price-to-earnings ratio at 26.24
- Unfavorable return on equity at 9.38%
- Asset turnover at 0.14 is low
- Slightly unfavorable overall financial ratio profile
Essex Property Trust Weaknesses
- Zero reported ROE and ROIC, signaling operational challenges
- Unfavorable current and quick ratios at 0
- Unfavorable price-to-earnings ratio at 25.08
- Unfavorable asset and fixed asset turnover at 0
- Higher proportion of unfavorable ratios overall
Equity Residential shows strengths in asset efficiency and interest coverage, but liquidity and profitability metrics warrant caution. Essex Property Trust benefits from lower leverage and strong margins but faces operational return and liquidity concerns. Each company’s profile suggests strategic priorities differ significantly.
The Moat Duel: Analyzing Competitive Defensibility
A structural moat shields long-term profits from relentless competition erosion. Without it, pricing power and market share quickly deteriorate:
Equity Residential: Urban Footprint and Tenant Loyalty
Equity Residential leverages a broad urban portfolio in high-demand cities, creating switching costs for renters. Its stable margins and growing ROIC signal efficient capital use. Expanding in vibrant markets could deepen this moat in 2026.
Essex Property Trust: West Coast Market Concentration
Essex’s moat stems from focused ownership in affluent West Coast markets, contrasting Equity’s broader geography. It commands superior gross margins but faces ROIC decline risks. Redevelopment projects offer growth, yet concentration exposes it to regional downturns.
Urban Scale vs. Regional Focus: Defending Market Share in Residential REITs
Equity Residential’s growing ROIC and geographic diversification build a wider moat than Essex’s narrower but higher-margin West Coast niche. I see Equity better positioned to defend market share amid evolving urban rental trends.
Which stock offers better returns?
Over the past year, Equity Residential and Essex Property Trust, Inc. showed distinct price movements and trading dynamics, with Equity Residential accelerating its gains while Essex displayed a decelerating bullish trend.
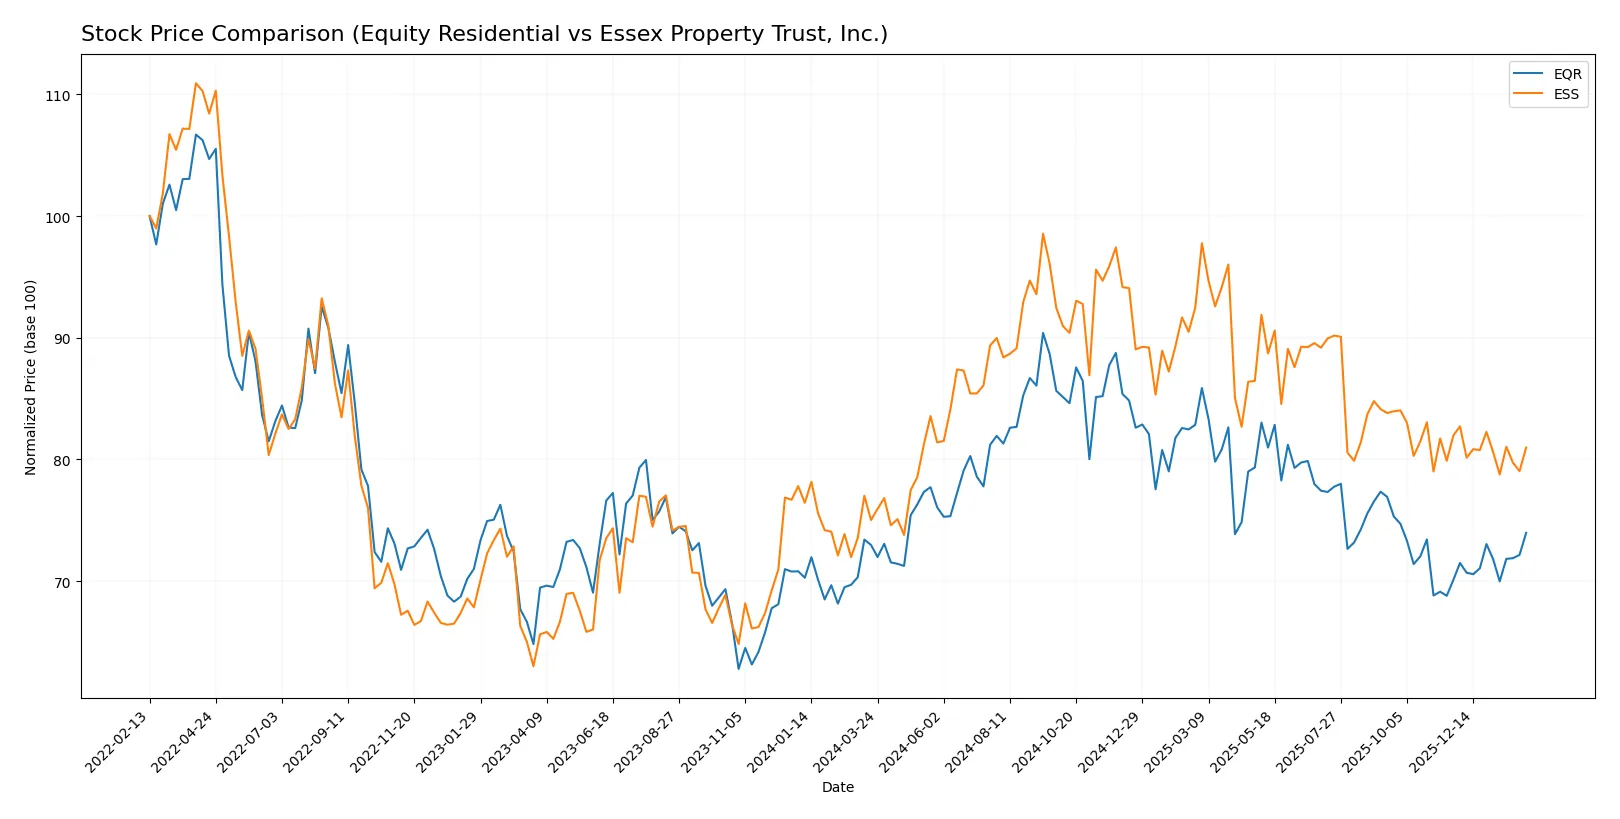
Trend Comparison
Equity Residential’s stock increased 1.36% over the last 12 months, signaling a bullish trend with accelerating momentum and a steady low volatility of 4.63%. The price ranged between 59.42 and 78.08.
Essex Property Trust’s stock rose 7.94% over the same period, marking a bullish trend but with decelerating momentum and high volatility of 18.8%. Prices fluctuated between 235.17 and 314.05.
Essex outperformed Equity Residential in market gains despite slowing momentum, delivering the highest price appreciation in the past year.
Target Prices
Analysts present a bullish consensus for both Equity Residential and Essex Property Trust, reflecting confidence in their residential REIT fundamentals.
| Company | Target Low | Target High | Consensus |
|---|---|---|---|
| Equity Residential | 35 | 78.5 | 69.29 |
| Essex Property Trust, Inc. | 271 | 292 | 280.4 |
The consensus targets for EQR and ESS exceed current prices by 8.5% and 8.6%, respectively, indicating upside potential aligned with sector recovery and urban housing demand.

Don’t Let Luck Decide Your Entry Point
Optimize your entry points with our advanced ProRealTime indicators. You’ll get efficient buy signals with precise price targets for maximum performance. Start outperforming now!
How do institutions grade them?
Equity Residential Grades
Below is a summary of recent institutional grades for Equity Residential:
| Grading Company | Action | New Grade | Date |
|---|---|---|---|
| BMO Capital | Downgrade | Market Perform | 2026-01-09 |
| UBS | Maintain | Buy | 2026-01-08 |
| Barclays | Maintain | Overweight | 2025-11-25 |
| Mizuho | Maintain | Neutral | 2025-11-24 |
| Truist Securities | Maintain | Buy | 2025-11-17 |
| Morgan Stanley | Maintain | Equal Weight | 2025-11-13 |
| Wells Fargo | Maintain | Equal Weight | 2025-11-10 |
| UBS | Maintain | Buy | 2025-11-10 |
| Scotiabank | Maintain | Sector Perform | 2025-11-04 |
| Evercore ISI Group | Maintain | Outperform | 2025-11-03 |
Essex Property Trust, Inc. Grades
Here are the latest institutional grades for Essex Property Trust, Inc.:
| Grading Company | Action | New Grade | Date |
|---|---|---|---|
| BMO Capital | Downgrade | Market Perform | 2026-01-09 |
| UBS | Maintain | Neutral | 2026-01-08 |
| Jefferies | Downgrade | Hold | 2025-12-16 |
| Truist Securities | Maintain | Hold | 2025-12-16 |
| Barclays | Maintain | Equal Weight | 2025-11-25 |
| Mizuho | Maintain | Outperform | 2025-11-24 |
| UBS | Maintain | Neutral | 2025-11-10 |
| Wells Fargo | Maintain | Equal Weight | 2025-11-10 |
| Scotiabank | Maintain | Sector Outperform | 2025-11-04 |
| Evercore ISI Group | Maintain | In Line | 2025-11-03 |
Which company has the best grades?
Equity Residential holds more Buy and Outperform ratings compared to Essex Property Trust’s Neutral and Hold grades. This suggests stronger analyst conviction in Equity Residential, potentially influencing investor confidence accordingly.
Risks specific to each company
The following categories identify critical pressure points and systemic threats facing both firms in the 2026 market environment:
1. Market & Competition
Equity Residential (EQR)
- Operates in several high-demand urban markets with 78,568 units, facing intense pricing competition.
Essex Property Trust, Inc. (ESS)
- Focused on West Coast markets with 60,000 units, contending with regional supply constraints and rising rents.
2. Capital Structure & Debt
Equity Residential (EQR)
- Debt-to-equity ratio of 0.76 signals moderate leverage; interest coverage at 5.58 is favorable.
Essex Property Trust, Inc. (ESS)
- Debt-to-equity data unavailable but rated very unfavorable; interest coverage at 3.26 is less robust, increasing risk.
3. Stock Volatility
Equity Residential (EQR)
- Beta of 0.76 indicates moderate sensitivity to market swings, offering relative stability.
Essex Property Trust, Inc. (ESS)
- Beta of 0.738 also shows moderate volatility, slightly lower but comparable to EQR.
4. Regulatory & Legal
Equity Residential (EQR)
- Subject to US residential real estate regulations; diversified operations reduce localized regulatory risk.
Essex Property Trust, Inc. (ESS)
- West Coast focus exposes ESS to stricter environmental and rent control regulation risks.
5. Supply Chain & Operations
Equity Residential (EQR)
- Owns 305 properties, benefiting from scale but exposed to urban construction and maintenance cost inflation.
Essex Property Trust, Inc. (ESS)
- Smaller portfolio of 246 properties; ongoing development projects may increase operational risks.
6. ESG & Climate Transition
Equity Residential (EQR)
- Faces pressure to improve sustainability across multiple urban hubs; ESG initiatives critical to tenant retention.
Essex Property Trust, Inc. (ESS)
- West Coast presence intensifies climate risk; regulatory compliance and energy efficiency are urgent priorities.
7. Geopolitical Exposure
Equity Residential (EQR)
- Primarily US domestic exposure with low geopolitical risk but sensitive to national economic cycles.
Essex Property Trust, Inc. (ESS)
- Concentrated West Coast exposure heightens vulnerability to regional economic and policy shifts.
Which company shows a better risk-adjusted profile?
Equity Residential’s most impactful risk lies in its moderate leverage amid rising interest rates. Essex Property Trust faces significant financial distress risk, reflected in its low Altman Z-score and unfavorable debt profile. I consider EQR’s diversified urban footprint and stronger interest coverage make it better positioned to manage 2026’s challenges. The recent Piotroski scores confirm ESS’s stronger operational health but warn of financial fragility. Overall, EQR shows a more balanced risk-adjusted profile for cautious investors.
Final Verdict: Which stock to choose?
Equity Residential’s superpower lies in its operational efficiency and resilient income generation, supporting a bullish market trend. However, its low liquidity ratios warrant vigilance. It suits investors seeking steady income with a tolerance for moderate balance sheet risk—ideal for an income-focused or core holding portfolio.
Essex Property Trust boasts a strong strategic moat with robust gross margins and a favorable capital structure, offering better financial stability than Equity Residential. Its consistent margin expansion and strong free cash flow appeal to investors favoring GARP strategies who value both growth and relative safety.
If you prioritize operational efficiency and consistent income, Equity Residential is the compelling choice due to its strong cash flow generation despite liquidity concerns. However, if you seek a well-moated growth profile with better balance sheet stability, Essex Property Trust offers superior margin resilience and capital discipline. Both present slightly unfavorable financial ratio profiles, so risk-aware investors should weigh their portfolio fit accordingly.
Disclaimer: Investment carries a risk of loss of initial capital. The past performance is not a reliable indicator of future results. Be sure to understand risks before making an investment decision.
Go Further
I encourage you to read the complete analyses of Equity Residential and Essex Property Trust, Inc. to enhance your investment decisions: