Home > Comparison > Real Estate > EQIX vs WY
The strategic rivalry between Equinix, Inc. and Weyerhaeuser Company shapes the real estate investment trust sector’s evolution. Equinix operates as a high-tech digital infrastructure REIT, while Weyerhaeuser focuses on timberland and sustainable wood products. This analysis explores their contrasting operational models and growth drivers. I will determine which company offers a superior risk-adjusted profile for diversified portfolios looking to balance innovation with traditional asset stability.
Table of contents
Companies Overview
Equinix and Weyerhaeuser are leaders in distinct specialty REIT markets with significant strategic influence.
Equinix, Inc.: Digital Infrastructure Powerhouse
Equinix dominates the digital infrastructure sector, operating a global platform that interconnects businesses with their essential digital ecosystems. Its core revenue comes from data center services that enable companies to scale and innovate rapidly. In 2026, Equinix focuses on expanding its footprint to enhance agility and accelerate digital transformation for clients worldwide.
Weyerhaeuser Company: Timberland and Wood Products Leader
Weyerhaeuser commands the timberland REIT space as one of the largest private owners of timberlands in North America. It generates revenue through sustainable timber management and wood product manufacturing. The company’s 2026 strategy emphasizes sustainable forestry practices while optimizing timberland asset management to meet growing demand for eco-friendly materials.
Strategic Collision: Similarities & Divergences
Both firms operate as specialty REITs but pursue vastly different business models—Equinix focuses on digital ecosystems, Weyerhaeuser on natural resource stewardship. Their primary battleground is asset quality and operational efficiency, though in unrelated sectors. Equinix offers a tech-driven growth profile, while Weyerhaeuser presents a resource-based stability, appealing to distinct investor appetites.
Income Statement Comparison
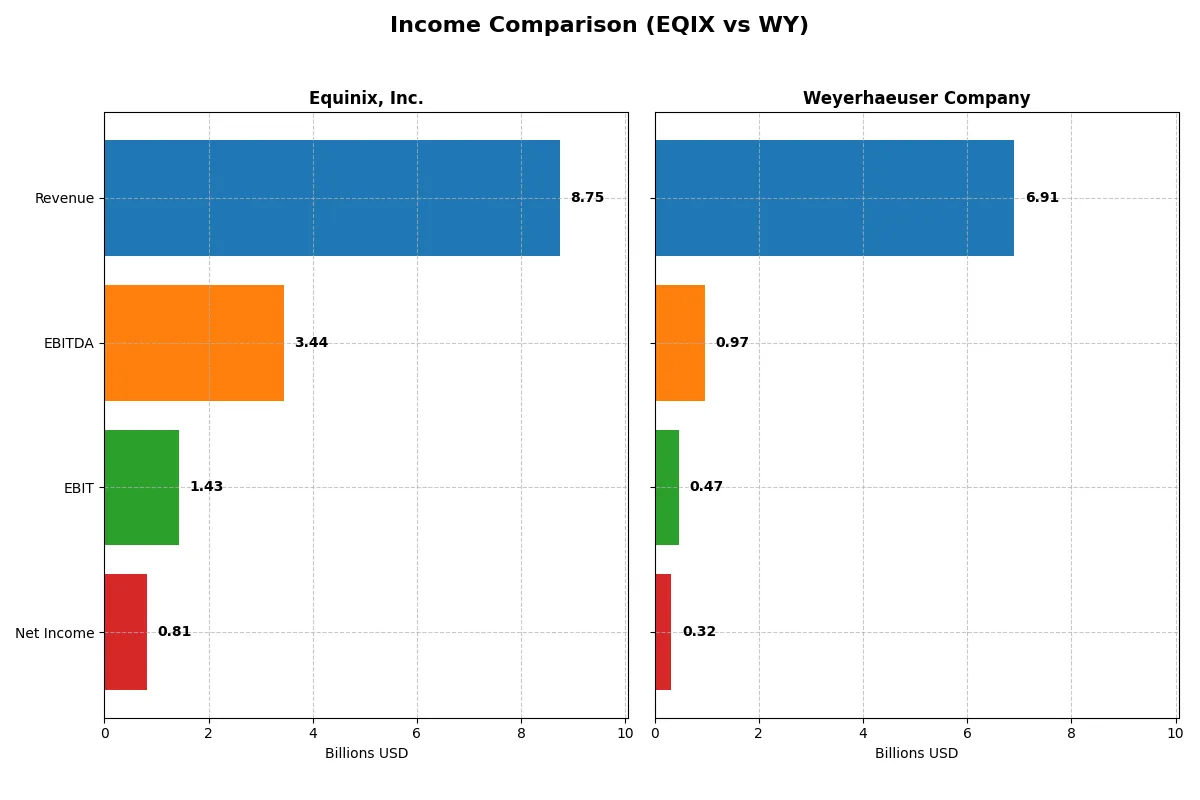
This data dissects the core profitability and scalability of both corporate engines to reveal who dominates the bottom line:
| Metric | Equinix, Inc. (EQIX) | Weyerhaeuser Company (WY) |
|---|---|---|
| Revenue | 8.75B | 6.91B |
| Cost of Revenue | 4.47B | 5.88B |
| Operating Expenses | 2.95B | 0 |
| Gross Profit | 4.28B | 1.03B |
| EBITDA | 3.44B | 974M |
| EBIT | 1.43B | 465M |
| Interest Expense | 457M | 0 |
| Net Income | 815M | 324M |
| EPS | 8.54 | 0.45 |
| Fiscal Year | 2024 | 2025 |
Income Statement Analysis: The Bottom-Line Duel
This income statement comparison reveals the true efficiency and profitability trajectories of Equinix, Inc. and Weyerhaeuser Company.
Equinix, Inc. Analysis
Equinix’s revenue climbed steadily from 6B in 2020 to 8.7B in 2024, with net income rising from 370M to 815M. Its gross margin remains strong near 49%, reflecting efficient cost control. Despite a 6% revenue growth in 2024, net income and EBIT margins contracted, signaling margin pressure and rising operating expenses.
Weyerhaeuser Company Analysis
Weyerhaeuser’s revenue declined from 10.2B in 2021 to 6.9B in 2025, dragging net income down from 2.6B to 324M. Gross margin dropped to 15%, indicating rising costs or pricing pressure. The 2025 EBIT margin fell to 6.7%, with net margin at 4.7%, showing weak profitability and shrinking operational efficiency.
Margin Power vs. Revenue Scale
Equinix clearly outperforms Weyerhaeuser in margin stability and long-term earnings growth, despite recent margin softness. Weyerhaeuser faces steep declines in revenue and net income, reflecting structural challenges. Equinix’s profile suits investors seeking resilient profitability; Weyerhaeuser’s metrics signal caution amid ongoing contraction.
Financial Ratios Comparison
These vital ratios act as a diagnostic tool to expose underlying fiscal health, valuation premiums, and capital efficiency for a rigorous company comparison:
| Ratios | Equinix (EQIX) | Weyerhaeuser (WY) |
|---|---|---|
| ROE | 6.0% | 3.4% |
| ROIC | 3.3% | 2.9% |
| P/E | 110.4 | 52.9 |
| P/B | 6.7 | 1.8 |
| Current Ratio | 1.63 | 1.29 |
| Quick Ratio | 1.63 | 1.29 |
| D/E | 1.40 | 0.59 |
| Debt-to-Assets | 54.0% | 33.5% |
| Interest Coverage | 2.91 | 0.00* |
| Asset Turnover | 0.25 | 0.42 |
| Fixed Asset Turnover | 0.42 | 2.50 |
| Payout Ratio | 202% | 187% |
| Dividend Yield | 1.83% | 3.54% |
| Fiscal Year | 2024 | 2025 |
*Weyerhaeuser’s interest coverage ratio reported as zero, indicating potential data limitation or very low coverage.
Efficiency & Valuation Duel: The Vital Signs
Ratios act as a company’s DNA, revealing hidden risks and operational excellence that shape investor outcomes.
Equinix, Inc.
Equinix posts a modest ROE of 6.02% with a net margin near 9.3%, indicating moderate profitability but challenged efficiency. Its valuation appears stretched, with a P/E soaring above 110 and a P/S over 12. The company returns value through a 1.83% dividend yield amid high leverage and subdued asset turnover, signaling cautious capital allocation.
Weyerhaeuser Company
Weyerhaeuser shows weaker profitability, with a 3.44% ROE and under 5% net margin, reflecting operational pressures. Its valuation is more reasonable, trading at a P/E near 53 and P/B at 1.82. The firm supports shareholders with a healthy 3.54% dividend yield and maintains lower leverage, balancing moderate returns with financial stability.
Premium Valuation vs. Operational Safety
Equinix carries a premium valuation but reveals operational constraints and high debt, raising risk. Weyerhaeuser offers a more balanced risk-return profile with better dividend yield and lower leverage. Investors prioritizing growth face Equinix’s stretched multiples, while those seeking income and stability may prefer Weyerhaeuser’s steadier footprint.
Which one offers the Superior Shareholder Reward?
I compare Equinix and Weyerhaeuser’s distribution strategies. Equinix pays a modest 1.8% dividend yield with a payout ratio above 200%, signaling dividend coverage risks. Its free cash flow per share is minimal (1.9), and buybacks appear restrained given high valuation multiples. Weyerhaeuser yields nearly double at 3.5%–4.8%, with a more sustainable payout ratio around 170%, backed by solid free cash flow per share (~0.47–1.03) and consistent buybacks. Historically, Weyerhaeuser’s capital allocation balances dividend growth and buybacks better. For 2026, I favor Weyerhaeuser’s shareholder reward profile due to higher yield, sustainable payout, and stronger cash flow coverage supporting total returns.
Comparative Score Analysis: The Strategic Profile
The radar chart reveals the fundamental DNA and trade-offs of Equinix, Inc. and Weyerhaeuser Company, highlighting their financial strengths and weaknesses:
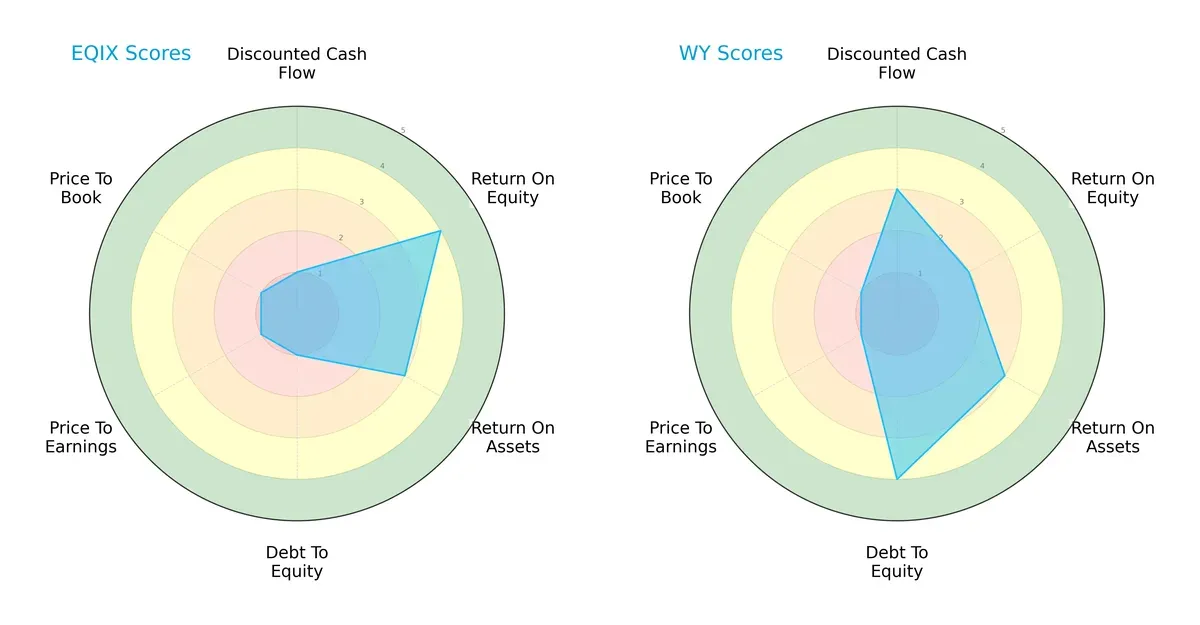
Equinix excels in return on equity (ROE 4) and return on assets (ROA 3), but suffers from poor discounted cash flow (DCF 1) and high leverage (debt-to-equity 1). Weyerhaeuser shows a more balanced profile with moderate DCF (3), ROE (2), and ROA (3), plus a strong debt-to-equity score (4). Equinix relies on operational efficiency; Weyerhaeuser leans on financial stability.
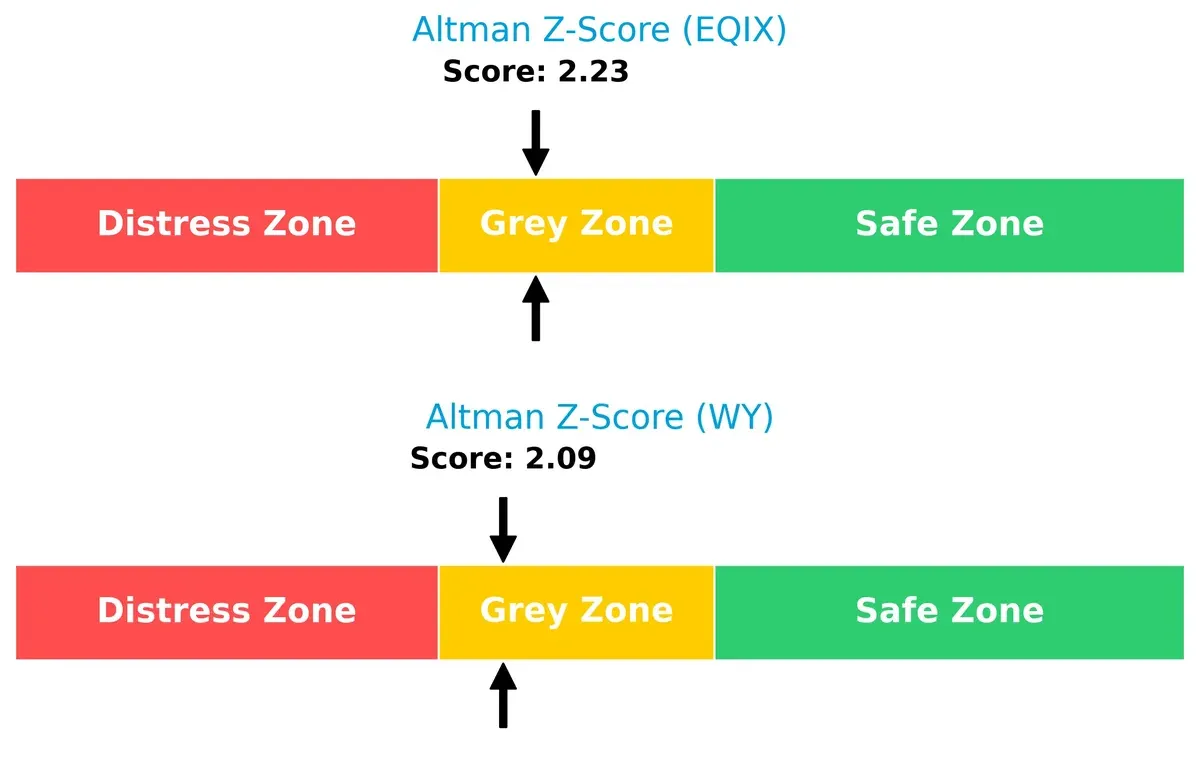
Bankruptcy Risk: Solvency Showdown
Equinix’s Altman Z-Score of 2.23 slightly edges out Weyerhaeuser’s 2.09, placing both firms in the grey zone of moderate bankruptcy risk in this cycle:
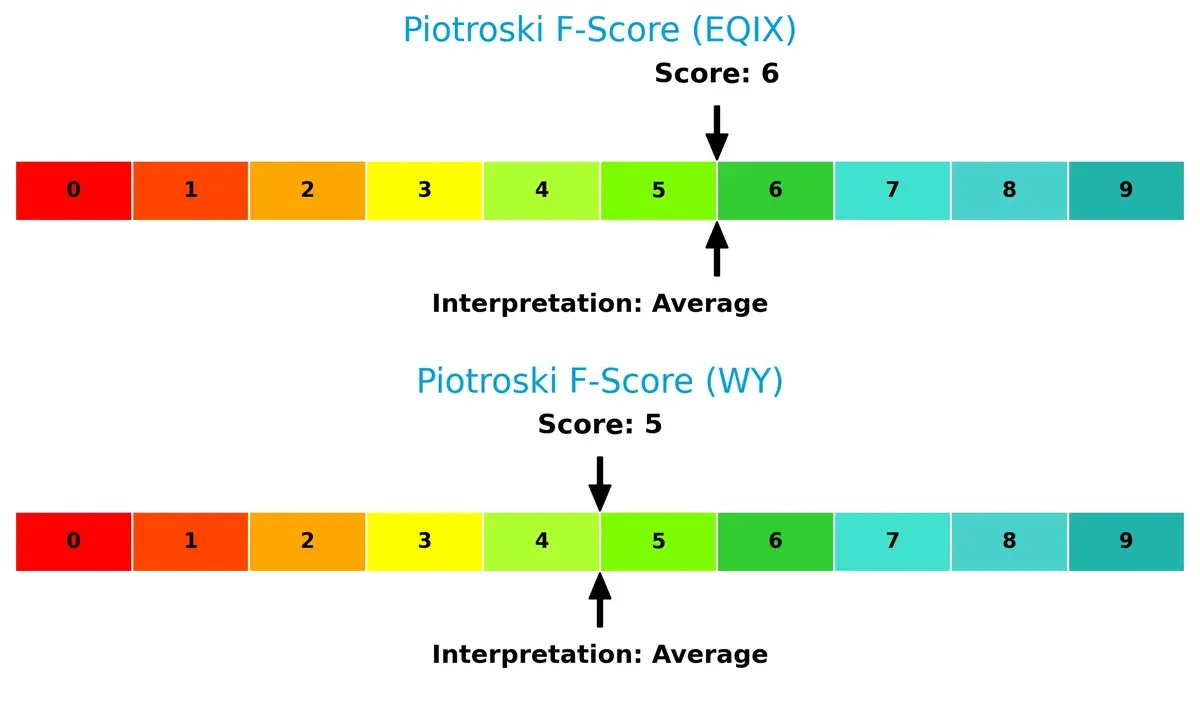
Financial Health: Quality of Operations
Equinix scores a 6 on the Piotroski F-Score, just above Weyerhaeuser’s 5, indicating marginally stronger internal financial health and fewer operational red flags:
How are the two companies positioned?
This section dissects the operational DNA of EQIX and WY by comparing their revenue distribution and internal dynamics. The goal is to confront their economic moats to reveal which model offers the most resilient, sustainable advantage.
Revenue Segmentation: The Strategic Mix
The following visual comparison dissects how Equinix, Inc. and Weyerhaeuser Company diversify their income streams and where their primary sector bets lie:
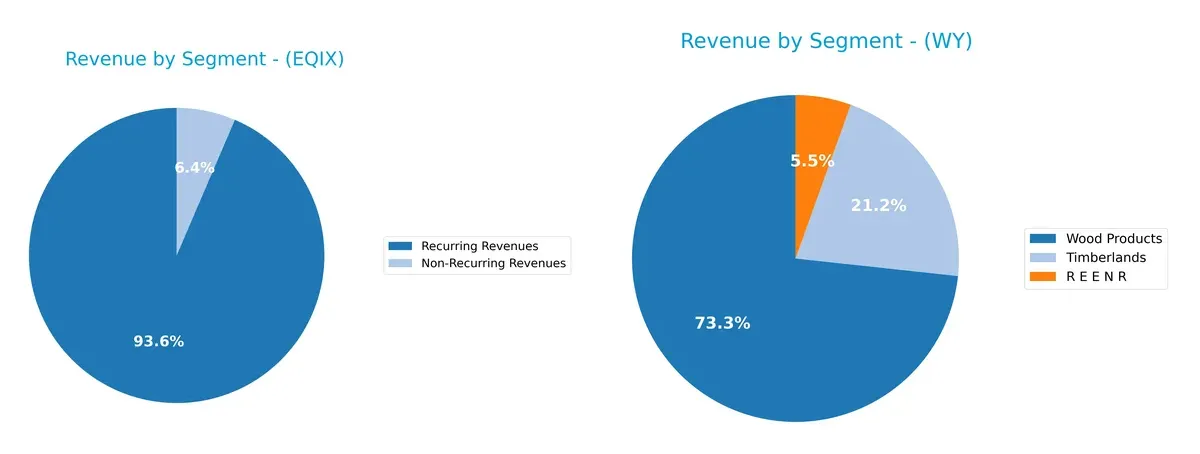
Equinix relies heavily on Co-Location, which dwarfs other segments at $5.77B in 2023. Its Interconnection ($1.39B) and Managed Infrastructure ($452M) add some diversification but remain secondary. In contrast, Weyerhaeuser pivots on Wood Products ($5.22B) and Timberlands ($1.51B) with a smaller REENR segment ($391M). Equinix’s focus anchors it in infrastructure dominance, while Weyerhaeuser balances between natural resources and manufacturing, reducing concentration risk.
Strengths and Weaknesses Comparison
This table compares the Strengths and Weaknesses of Equinix, Inc. and Weyerhaeuser Company:
Equinix Strengths
- Strong recurring revenues of 8.18B USD in 2024
- Diversified geographic presence across Americas, Asia Pacific, EMEA
- Favorable current and quick ratios indicate liquidity
- WACC below ROIC suggesting cost-efficient capital use
Weyerhaeuser Strengths
- Large revenue base from Wood Products (5.22B) and Timberlands (1.51B) in 2024
- Favorable interest coverage and dividend yield at 3.54%
- Moderate leverage with neutral debt to assets at 33.54%
- Presence in multiple countries including US, Canada, Japan, China
Equinix Weaknesses
- Unfavorable ROE (6.02%) and ROIC (3.33%) below WACC (7.6%)
- High debt to assets at 54.04% indicates leverage risk
- Unfavorable valuation multiples (PE 110.44, PB 6.65)
- Low asset turnover points to capital efficiency issues
Weyerhaeuser Weaknesses
- Unfavorable net margin (4.69%) and ROE (3.44%)
- Unfavorable PE ratio at 52.88
- Neutral to unfavorable asset turnover and fixed asset turnover
- Less diversified revenue streams concentrated in Wood Products
Equinix shows strength in its recurring revenue and global footprint but faces challenges in profitability and leverage. Weyerhaeuser benefits from stable interest coverage and dividend yield but struggles with margins and asset efficiency. Both companies demonstrate strategic trade-offs between growth, capital structure, and operational efficiency.
The Moat Duel: Analyzing Competitive Defensibility
A structural moat shields long-term profits from relentless competition erosion. Without it, market share and pricing power quickly vanish:
Equinix, Inc.: Network Effects Powering Digital Infrastructure
Equinix’s moat stems from powerful network effects that connect global digital ecosystems. This delivers stable margins near 16% EBIT and robust gross margins near 49%. Expansion into emerging markets deepens this moat in 2026.
Weyerhaeuser Company: Asset-Heavy Timberland Cost Advantage
Weyerhaeuser relies on vast, sustainably managed timberlands as a cost advantage. However, its lower 7% EBIT margin and declining revenue reveal a shrinking moat. Market pressures and falling ROIC threaten future resilience.
Network Effects vs. Asset Scale: The Moat Showdown
Equinix’s growing ROIC trend and strong margin profile create a wider, more durable moat than Weyerhaeuser’s capital-intensive, declining returns. Equinix is better equipped to defend and expand its market share in 2026.
Which stock offers better returns?
Equinix, Inc. and Weyerhaeuser Company show notable price shifts over the past 12 months, with both experiencing bearish trends but differing in volatility and recent momentum.
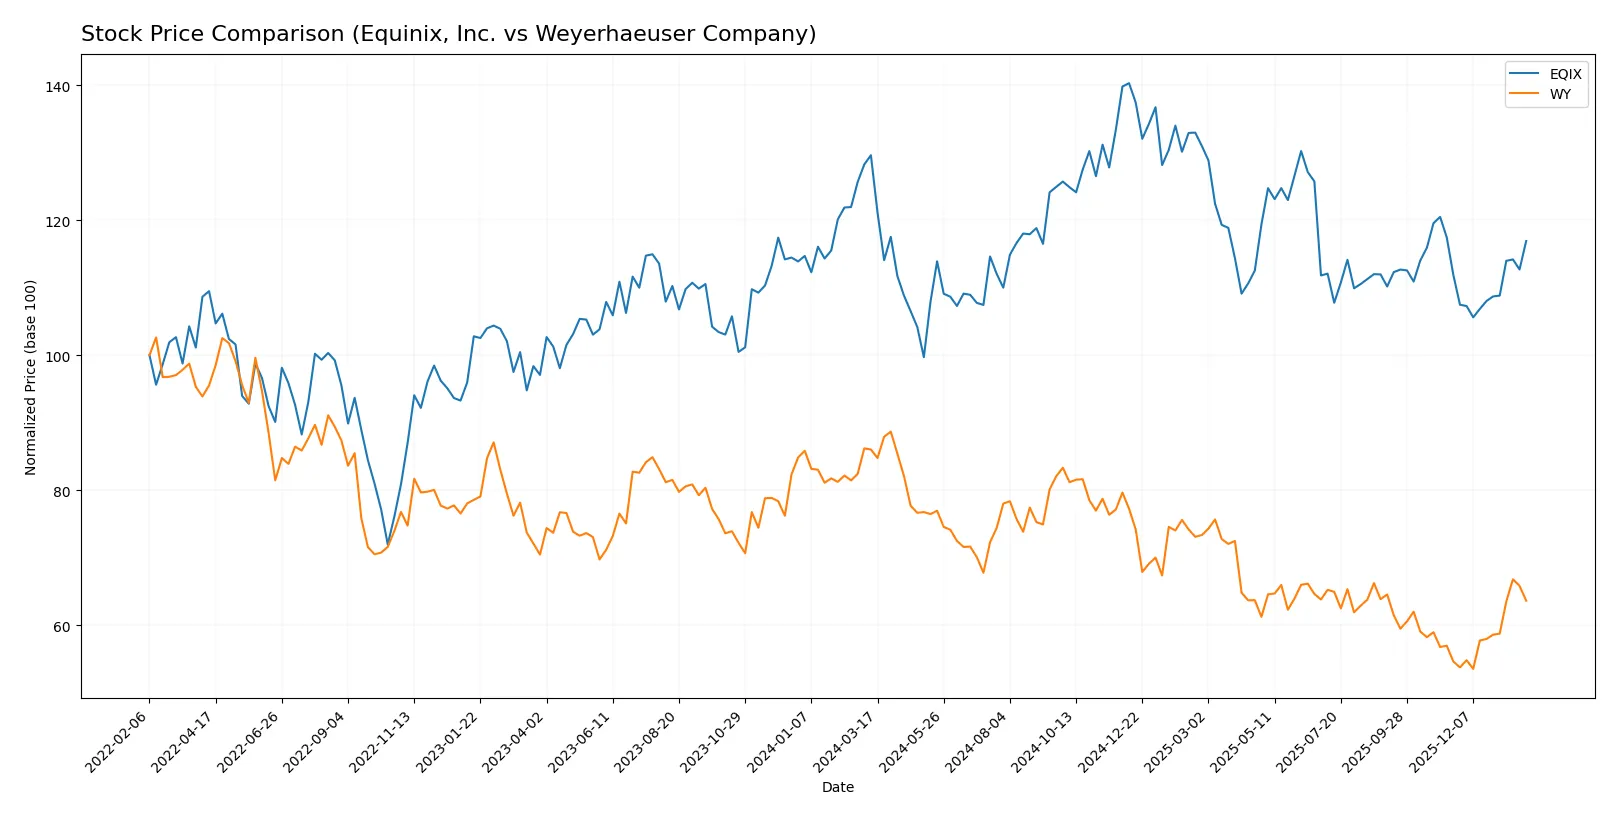
Trend Comparison
Equinix’s stock fell 9.8% over the past year, marking a bearish trend with accelerating decline. It ranged between 700.18 and 985.0 and shows recent positive momentum gaining 4.5%.
Weyerhaeuser’s stock declined 26.0%, confirming a bearish trend with accelerating losses. Prices fluctuated from 21.69 to 35.91. The recent rebound is stronger, rising 16.49% since November 2025.
Weyerhaeuser suffered a steeper yearly loss but posted a higher recent gain than Equinix, indicating a stronger short-term recovery despite overall weak performance.
Target Prices
Analysts present a clear consensus on target prices for Equinix, Inc. and Weyerhaeuser Company, reflecting moderate upside potential.
| Company | Target Low | Target High | Consensus |
|---|---|---|---|
| Equinix, Inc. | 795 | 1050 | 922.38 |
| Weyerhaeuser Company | 28 | 33 | 30 |
Equinix’s consensus target of 922.38 suggests a roughly 12% upside from the current price of 820.93. Weyerhaeuser’s target of 30 implies a 16% potential increase over its current 25.78.

Don’t Let Luck Decide Your Entry Point
Optimize your entry points with our advanced ProRealTime indicators. You’ll get efficient buy signals with precise price targets for maximum performance. Start outperforming now!
How do institutions grade them?
Equinix, Inc. Grades
The following table summarizes recent grades and actions from reputable grading firms for Equinix, Inc.:
| Grading Company | Action | New Grade | Date |
|---|---|---|---|
| Scotiabank | Maintain | Sector Outperform | 2026-01-14 |
| BMO Capital | Upgrade | Outperform | 2025-12-03 |
| Truist Securities | Maintain | Buy | 2025-11-18 |
| JP Morgan | Maintain | Overweight | 2025-10-30 |
| TD Cowen | Maintain | Buy | 2025-10-30 |
| Barclays | Maintain | Equal Weight | 2025-08-20 |
| Truist Securities | Maintain | Buy | 2025-08-07 |
| JP Morgan | Maintain | Overweight | 2025-07-31 |
| JMP Securities | Maintain | Market Outperform | 2025-07-22 |
| UBS | Maintain | Buy | 2025-07-11 |
Weyerhaeuser Company Grades
The following table summarizes recent grades and actions from reputable grading firms for Weyerhaeuser Company:
| Grading Company | Action | New Grade | Date |
|---|---|---|---|
| Citigroup | Maintain | Buy | 2026-01-14 |
| Truist Securities | Maintain | Hold | 2026-01-06 |
| CIBC | Maintain | Outperform | 2025-12-12 |
| B of A Securities | Downgrade | Neutral | 2025-11-17 |
| JP Morgan | Maintain | Overweight | 2025-11-14 |
| Citigroup | Maintain | Buy | 2025-11-12 |
| RBC Capital | Maintain | Outperform | 2025-11-03 |
| DA Davidson | Maintain | Buy | 2025-11-03 |
| Citigroup | Maintain | Buy | 2025-10-27 |
| Truist Securities | Maintain | Hold | 2025-10-13 |
Which company has the best grades?
Equinix, Inc. consistently receives high grades such as “Buy,” “Outperform,” and “Overweight” from multiple firms, including recent upgrades. Weyerhaeuser shows a mix of “Buy,” “Hold,” and some downgrades, reflecting more cautious sentiment. Equinix’s stronger grades suggest a more positive institutional outlook, potentially attracting investor interest more strongly.
Risks specific to each company
The following categories identify the critical pressure points and systemic threats facing both firms in the 2026 market environment:
1. Market & Competition
Equinix, Inc.
- Dominates digital infrastructure but faces intense tech sector competition and rapid innovation cycles.
Weyerhaeuser Company
- Operates in cyclical timber and wood products markets, vulnerable to housing demand fluctuations.
2. Capital Structure & Debt
Equinix, Inc.
- High debt-to-assets ratio at 54%, raising leverage risk; interest coverage is moderate.
Weyerhaeuser Company
- Lower leverage with 33.5% debt-to-assets; strong interest coverage with effectively no risk of default.
3. Stock Volatility
Equinix, Inc.
- Beta near 1.04 indicates market-aligned volatility; trading range wide from 701 to 953 USD.
Weyerhaeuser Company
- Beta slightly higher at 1.05; broader trading volume suggests more liquidity but also sensitivity to market swings.
4. Regulatory & Legal
Equinix, Inc.
- Faces data privacy and infrastructure regulation risks amid global digital policies.
Weyerhaeuser Company
- Subject to environmental laws and sustainable forestry regulations impacting operational costs.
5. Supply Chain & Operations
Equinix, Inc.
- Relies on global data center build-outs; supply chain disruptions impact expansion speed.
Weyerhaeuser Company
- Timber supply tied to natural resource cycles; weather and permit delays pose operational risks.
6. ESG & Climate Transition
Equinix, Inc.
- Must invest heavily in energy efficiency and carbon reduction to meet client ESG demands.
Weyerhaeuser Company
- Recognized for sustainable forestry; ESG initiatives integral but exposed to climate-related risks.
7. Geopolitical Exposure
Equinix, Inc.
- Digital infrastructure sensitive to global trade tensions and tech sovereignty policies.
Weyerhaeuser Company
- Timberland operations mostly North American; less exposed but vulnerable to cross-border trade tariffs.
Which company shows a better risk-adjusted profile?
Weyerhaeuser shows a more balanced risk profile. Its lower leverage and strong interest coverage reduce financial distress risk. Equinix’s heavy leverage and valuation multiples heighten vulnerability despite market leadership. Weyerhaeuser’s timber business, while cyclical, benefits from sustainable practices and lower capital intensity. Equinix’s exposure to tech disruption and regulatory shifts demands cautious monitoring. The most impactful risk for Equinix is its elevated debt burden, while for Weyerhaeuser, cyclical market demand remains pressing. I note Weyerhaeuser’s superior interest coverage and more moderate valuation support its relative stability in 2026.
Final Verdict: Which stock to choose?
Equinix, Inc. commands attention with its superpower: unmatched scale and network effects in global data centers. Its growing ROIC trend signals improving profitability despite current value destruction. A point of vigilance remains its high leverage, which could amplify risks in volatile markets. Equinix suits an Aggressive Growth portfolio aiming for long-term tech infrastructure dominance.
Weyerhaeuser Company’s strategic moat lies in its vast, sustainable timberland holdings providing recurring cash flow and natural asset scarcity. It offers a more conservative safety profile with moderate leverage and stronger interest coverage than Equinix. Weyerhaeuser fits well within a GARP (Growth at a Reasonable Price) portfolio focused on steady income and value resilience.
If you prioritize aggressive growth and network-driven scalability, Equinix is the compelling choice due to its expanding profitability and sector leadership. However, if you seek stability with tangible assets and consistent cash flow, Weyerhaeuser offers better stability and a defensive posture amid economic cycles. Both present analytical scenarios shaped by differing risk appetites and investment horizons.
Disclaimer: Investment carries a risk of loss of initial capital. The past performance is not a reliable indicator of future results. Be sure to understand risks before making an investment decision.
Go Further
I encourage you to read the complete analyses of Equinix, Inc. and Weyerhaeuser Company to enhance your investment decisions: