Home > Comparison > Real Estate > EQIX vs IRM
The strategic rivalry between Equinix, Inc. and Iron Mountain Incorporated shapes the specialty REIT sector’s outlook. Equinix operates as a high-growth digital infrastructure platform, while Iron Mountain offers a diversified storage and information management network. This head-to-head contrasts innovative tech-driven expansion against traditional asset-heavy real estate. This analysis will determine which model delivers the superior risk-adjusted return for a well-balanced portfolio in today’s evolving market environment.
Table of contents
Companies Overview
Equinix and Iron Mountain stand as leaders in the specialty REIT sector, each shaping vital infrastructure markets globally.
Equinix, Inc.: Digital Infrastructure Powerhouse
Equinix is a global digital infrastructure company specializing in interconnected data centers. It generates revenue by enabling businesses to access diverse digital ecosystems, accelerating their digital services. In 2026, its strategic focus centers on expanding platform connectivity to enhance agility and scale for digital leaders worldwide.
Iron Mountain Incorporated: Trusted Information Management Leader
Iron Mountain operates as a global leader in storage and information management services, serving over 225,000 organizations. Its core revenue comes from secure records storage, digital transformation, and data center services. In 2026, it emphasizes integrated solutions that lower costs, manage risk, and support clients’ digital workforces.
Strategic Collision: Similarities & Divergences
Both companies leverage specialty REIT structures but diverge in focus—Equinix champions an open digital ecosystem, while Iron Mountain emphasizes secure information lifecycle management. Their primary battleground is the expanding digital infrastructure market. Equinix offers tech-centric growth potential; Iron Mountain provides stable, diversified cash flow driven by data and physical asset protection.
Income Statement Comparison
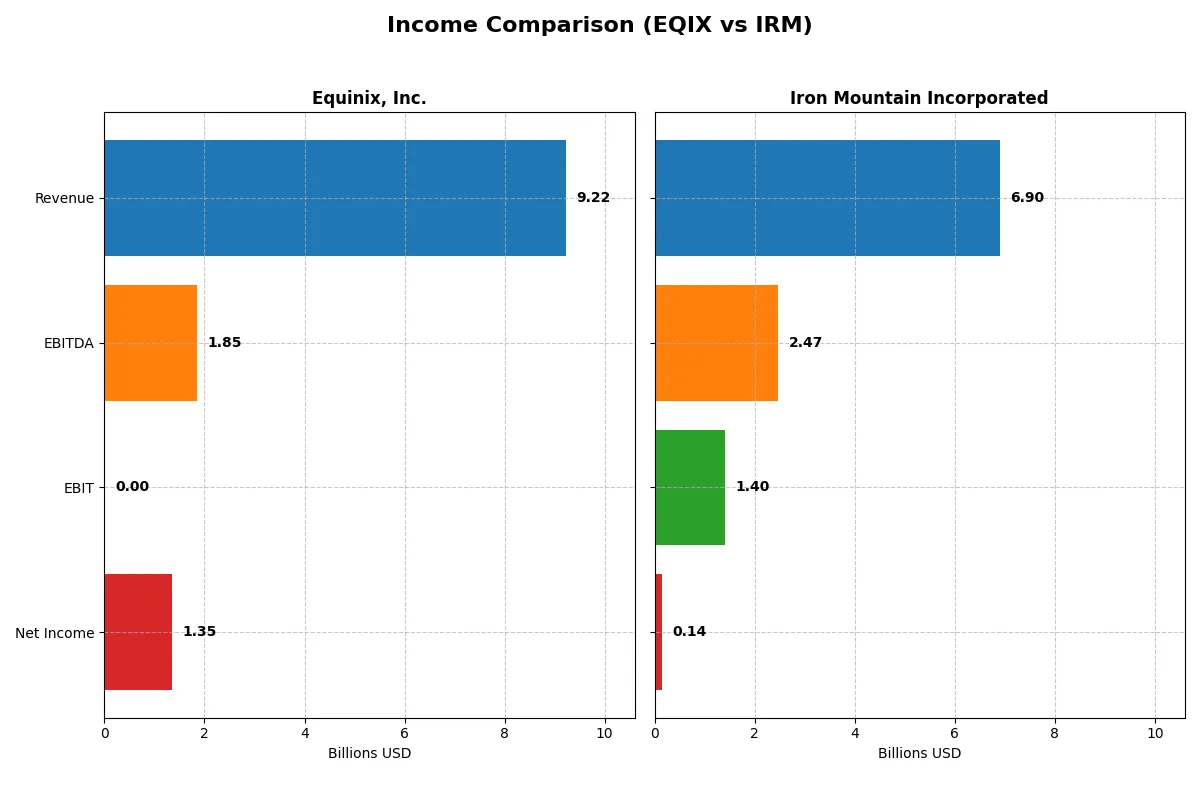
This detailed income statement data dissects the core profitability and scalability of both corporate engines to reveal who dominates the bottom line:
| Metric | Equinix, Inc. (EQIX) | Iron Mountain Inc. (IRM) |
|---|---|---|
| Revenue | 9.22B | 6.90B |
| Cost of Revenue | 4.51B | 3.08B |
| Operating Expenses | 2.86B | 2.66B |
| Gross Profit | 4.71B | 3.82B |
| EBITDA | 1.85B | 2.47B |
| EBIT | 0 | 1.40B |
| Interest Expense | -527M | 829M |
| Net Income | 1.35B | 145M |
| EPS | 13.79 | 0.49 |
| Fiscal Year | 2025 | 2025 |
Income Statement Analysis: The Bottom-Line Duel
The following income statement comparison exposes each company’s operational efficiency and profit generation power to reveal their core financial strengths.
Equinix, Inc. Analysis
Equinix’s revenue grew steadily from 6.6B in 2021 to 9.2B in 2025, while net income surged from 500M to 1.35B. Its gross margin holds strong above 51%, reflecting solid cost control. Despite an EBIT margin collapse in 2025, net margin and EPS jumped sharply, signaling improved bottom-line efficiency and robust earnings momentum.
Iron Mountain Incorporated Analysis
Iron Mountain expanded revenue by over 53% from 4.5B in 2021 to 6.9B in 2025, with gross margin healthy at 55%. EBIT margin rose to a solid 20%, but net margin languished around 2%, dragged by rising interest expenses. Net income declined drastically over five years, showing profit generation struggles despite top-line growth.
Margin Mastery vs. Revenue Expansion
Equinix triumphs with remarkable net income growth and margin improvement, outperforming Iron Mountain’s broader revenue base but weaker profitability. For investors prioritizing earnings quality and margin resilience, Equinix’s profile offers a clearer path to sustained value creation.
Financial Ratios Comparison
These vital ratios act as a diagnostic tool to expose the underlying fiscal health, valuation premiums, and capital efficiency of the companies compared below:
| Ratios | Equinix, Inc. (EQIX) | Iron Mountain Inc. (IRM) |
|---|---|---|
| ROE | 9.54% | -14.74% |
| ROIC | 5.05% | 4.48% |
| P/E | 55.55 | 169.47 |
| P/B | 5.30 | -24.98 |
| Current Ratio | 1.32 | 0.74 |
| Quick Ratio | 1.32 | 0.74 |
| D/E | 1.47 | -19.10 |
| Debt-to-Assets | 51.67% | 88.67% |
| Interest Coverage | -3.51 | 1.40 |
| Asset Turnover | 0.23 | 0.33 |
| Fixed Asset Turnover | 0.37 | 0.57 |
| Payout ratio | 137% | 636% |
| Dividend yield | 2.47% | 3.75% |
| Fiscal Year | 2025 | 2025 |
Efficiency & Valuation Duel: The Vital Signs
Ratios act as a company’s DNA, exposing hidden risks and operational strengths that shape investment decisions.
Equinix, Inc.
Equinix posts a solid 14.65% net margin but a modest 9.54% ROE, signaling moderate profitability. The stock trades at a stretched P/E of 55.55 and a P/B of 5.3, reflecting premium valuation. With a 2.47% dividend yield, Equinix returns cash to shareholders, balancing growth and income.
Iron Mountain Incorporated
Iron Mountain struggles with a low 2.09% net margin and negative ROE at -14.74%, indicating operational challenges. Its P/E soars to 169.47, marking it as highly expensive relative to earnings. Despite financial strain, it offers a 3.75% dividend yield, prioritizing shareholder income amid weak profitability.
Premium Valuation vs. Operational Strain
Equinix balances higher profitability and a reasonable dividend against a stretched valuation. Iron Mountain’s valuation is extreme, paired with weak returns and liquidity concerns. Investors seeking income with risk appetite may lean towards Iron Mountain; those favoring operational stability and moderate growth might prefer Equinix.
Which one offers the Superior Shareholder Reward?
I compare Equinix, Inc. (EQIX) and Iron Mountain Incorporated (IRM) on their shareholder reward strategies. EQIX offers a modest 2.47% dividend yield with a payout ratio of 138%, signaling aggressive dividend distribution likely funded by debt or capital. It supplements returns with significant buybacks, enhancing total shareholder return. Conversely, IRM delivers a higher 3.75% yield but with an unsustainable 636% payout ratio and negative free cash flow, raising red flags on dividend sustainability. IRM’s buyback activity is limited, reflecting its weaker cash flow position. Historically, EQIX’s balanced buyback and dividend approach, despite higher leverage, supports more durable returns in 2026’s market environment. I conclude EQIX offers the superior total return profile due to its more prudent capital allocation and sustainable shareholder distributions.
Comparative Score Analysis: The Strategic Profile
The radar chart reveals the fundamental DNA and trade-offs of Equinix, Inc. and Iron Mountain Incorporated, highlighting their distinct financial strengths and vulnerabilities:
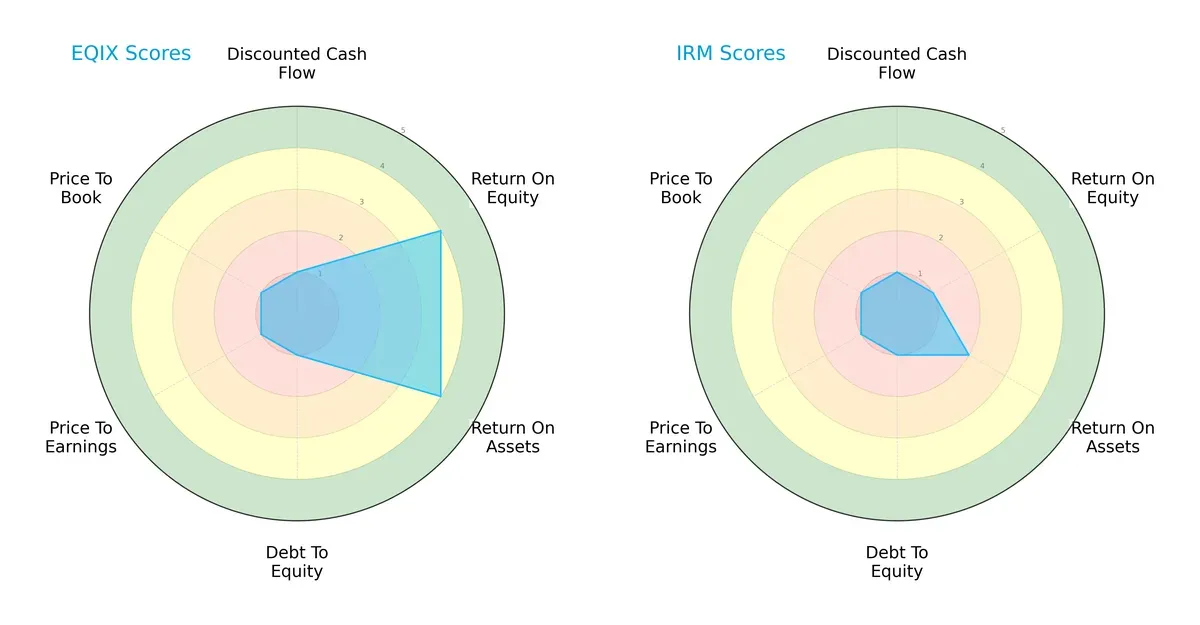
Equinix shows a more balanced profile with strong returns on equity (4) and assets (4), despite weak debt management and valuation metrics (all scored 1). Iron Mountain, however, relies on limited operational efficiency (ROE 1, ROA 2) and shares similarly weak debt and valuation scores. Equinix’s superior profitability metrics provide a clearer edge in capital allocation and operational effectiveness.
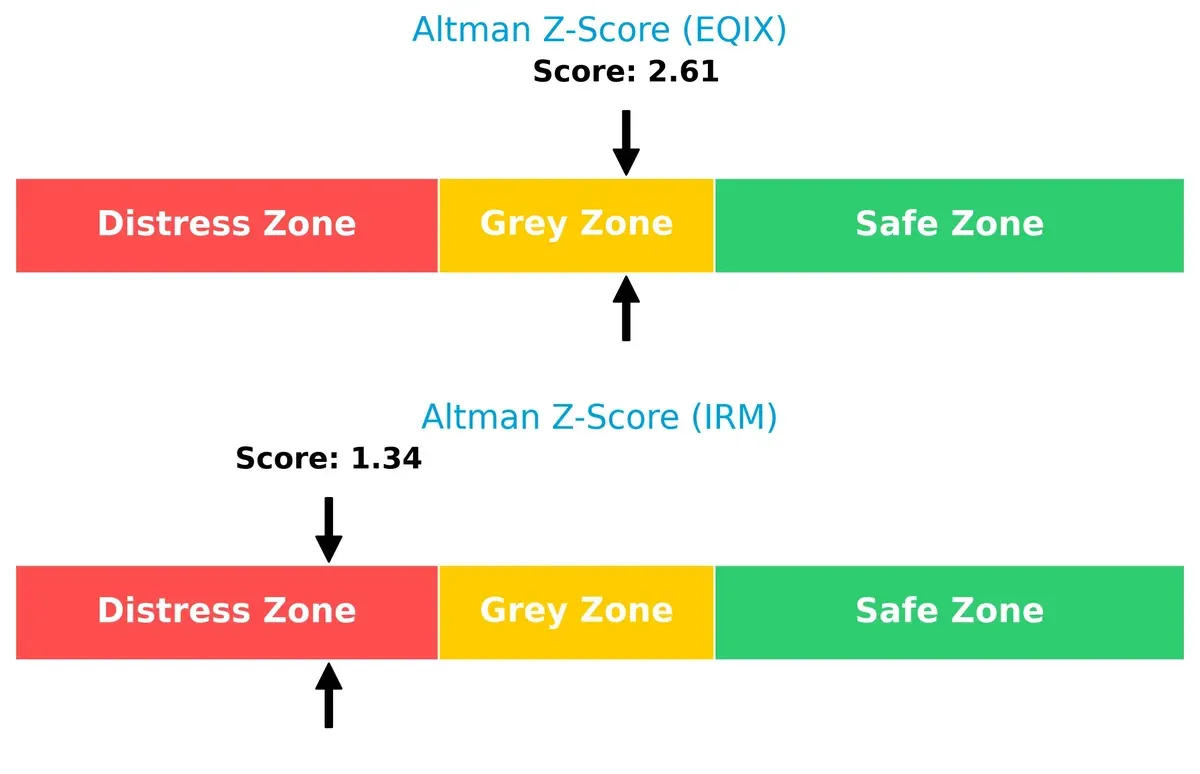
Bankruptcy Risk: Solvency Showdown
The Altman Z-Score difference signals varying bankruptcy risks. Equinix’s 2.61 places it in the grey zone, suggesting moderate survival odds, while Iron Mountain’s 1.34 flags distress and heightened financial risk:
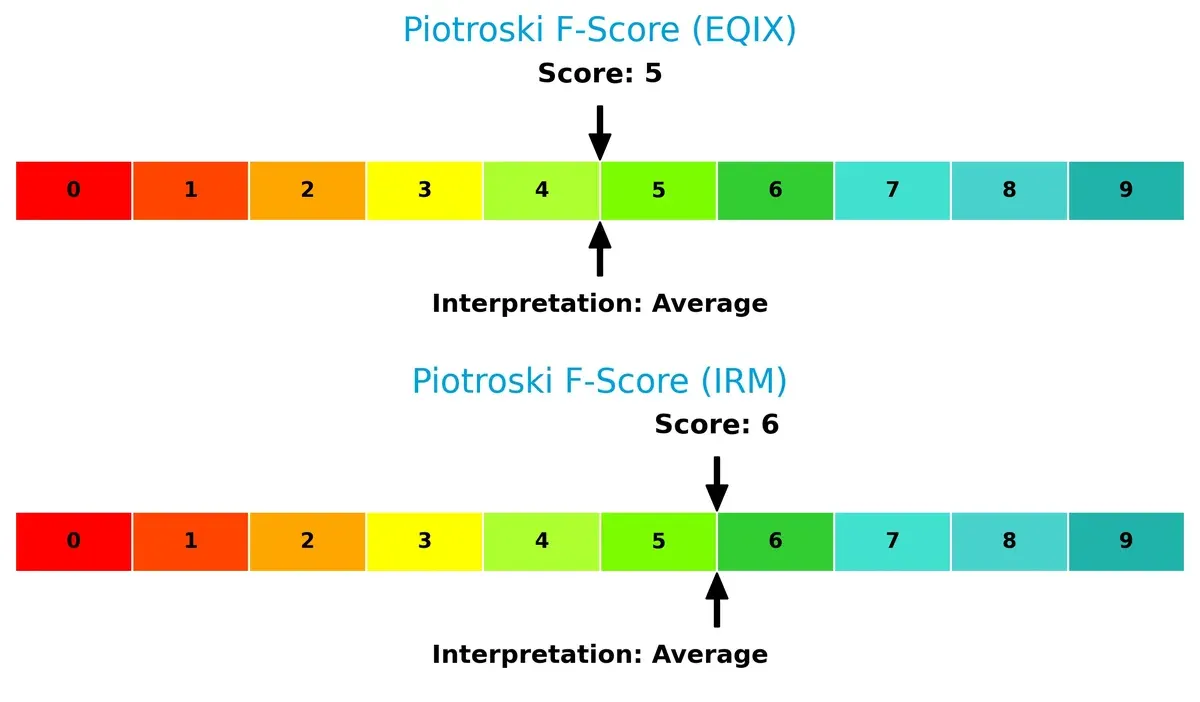
Financial Health: Quality of Operations
Both companies have average Piotroski F-Scores—Equinix at 5 and Iron Mountain at 6—indicating moderate financial health without glaring red flags, but no firm demonstrates peak operational quality:
How are the two companies positioned?
This section dissects Equinix and Iron Mountain’s operational DNA by comparing their revenue distribution and internal strengths and weaknesses. The final objective is to confront their economic moats to identify the most resilient, sustainable competitive advantage in today’s market.
Revenue Segmentation: The Strategic Mix
This visual comparison dissects how Equinix, Inc. and Iron Mountain Incorporated diversify their income streams and where their primary sector bets lie:
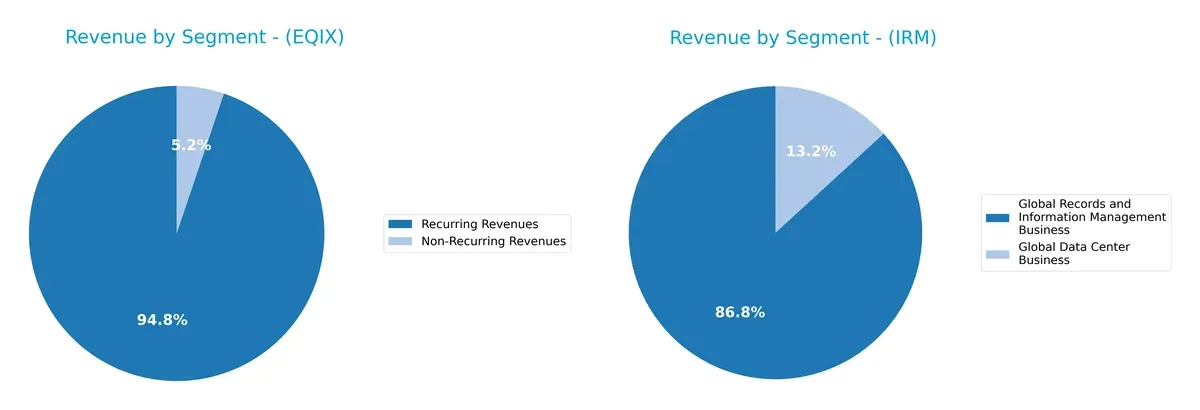
Equinix anchors revenue heavily in Co-Location, with $5.8B in 2023, dwarfing its other streams like Interconnection at $1.4B. In contrast, Iron Mountain leans on Global Records and Information Management, posting $5.3B in 2025, with Data Centers at $803M. Equinix’s focus on infrastructure signals ecosystem lock-in, while Iron Mountain’s concentration risks hinge on records management dominance amid slower diversification.
Strengths and Weaknesses Comparison
This table compares the Strengths and Weaknesses of Equinix, Inc. and Iron Mountain Incorporated:
Equinix Strengths
- Strong recurring revenues at $8.7B in 2025
- Diversified revenue streams in colocation and interconnection
- Solid global presence across Americas, EMEA, Asia Pacific
- Favorable net margin at 14.65%
- Quick ratio of 1.32 indicates liquidity
- Dividend yield of 2.47%
Iron Mountain Strengths
- Leading global records and information management business at $5.3B
- Growing global data center business at $803M
- Favorable WACC at 7.07%
- Favorable PB ratio despite negative equity
- Higher dividend yield at 3.75%
- Presence in key countries including US, UK, Canada
Equinix Weaknesses
- Unfavorable ROE at 9.54% and PE at 55.55
- High debt to assets at 51.67% and weak interest coverage
- Low asset turnover at 0.23 and fixed asset turnover
- Unfavorable D/E ratio at 1.47
- Global ratios evaluation overall unfavorable
- Lower geographic revenue concentration in Asia Pacific
Iron Mountain Weaknesses
- Negative ROE at -14.74% and low net margin at 2.09%
- Unfavorable current and quick ratios below 1
- Very high debt to assets at 88.67% and weak interest coverage
- Unfavorable ROIC at 4.48% and high PE at 169.47
- Global ratios evaluation overall unfavorable
- Lower asset turnover and fixed asset turnover ratios
Both companies face significant financial leverage and profitability challenges, although Equinix benefits from stronger recurring revenues and better liquidity. Iron Mountain’s strategy relies on a dominant records management business but struggles with weaker margins and balance sheet liquidity.
The Moat Duel: Analyzing Competitive Defensibility
A structural moat shields long-term profits from relentless competition erosion. Without it, margins and market share inevitably decline:
Equinix, Inc.: Network Effects Powerhouse
Equinix’s moat stems from powerful network effects linking data centers worldwide. This drives high gross margins (~51%) and stable net margins. Expanding digital infrastructure globally in 2026 could deepen its competitive edge.
Iron Mountain Incorporated: Intangible Assets & Scale
Iron Mountain leverages vast physical storage networks and trusted brand reputation, an intangible asset moat contrasting Equinix’s digital focus. Despite solid gross margins (~55%), declining ROIC signals weakened profitability. Growth in data management services offers modest upside.
Verdict: Network Effects vs. Intangible Scale
Equinix’s network effects create a wider moat with growing ROIC, while Iron Mountain’s scale suffers declining returns. I see Equinix better positioned to defend and expand its market share long-term.
Which stock offers better returns?
The past year shows clear bullish momentum for both stocks, with Iron Mountain’s stronger gains contrasting Equinix’s higher volatility and accelerating price appreciation.
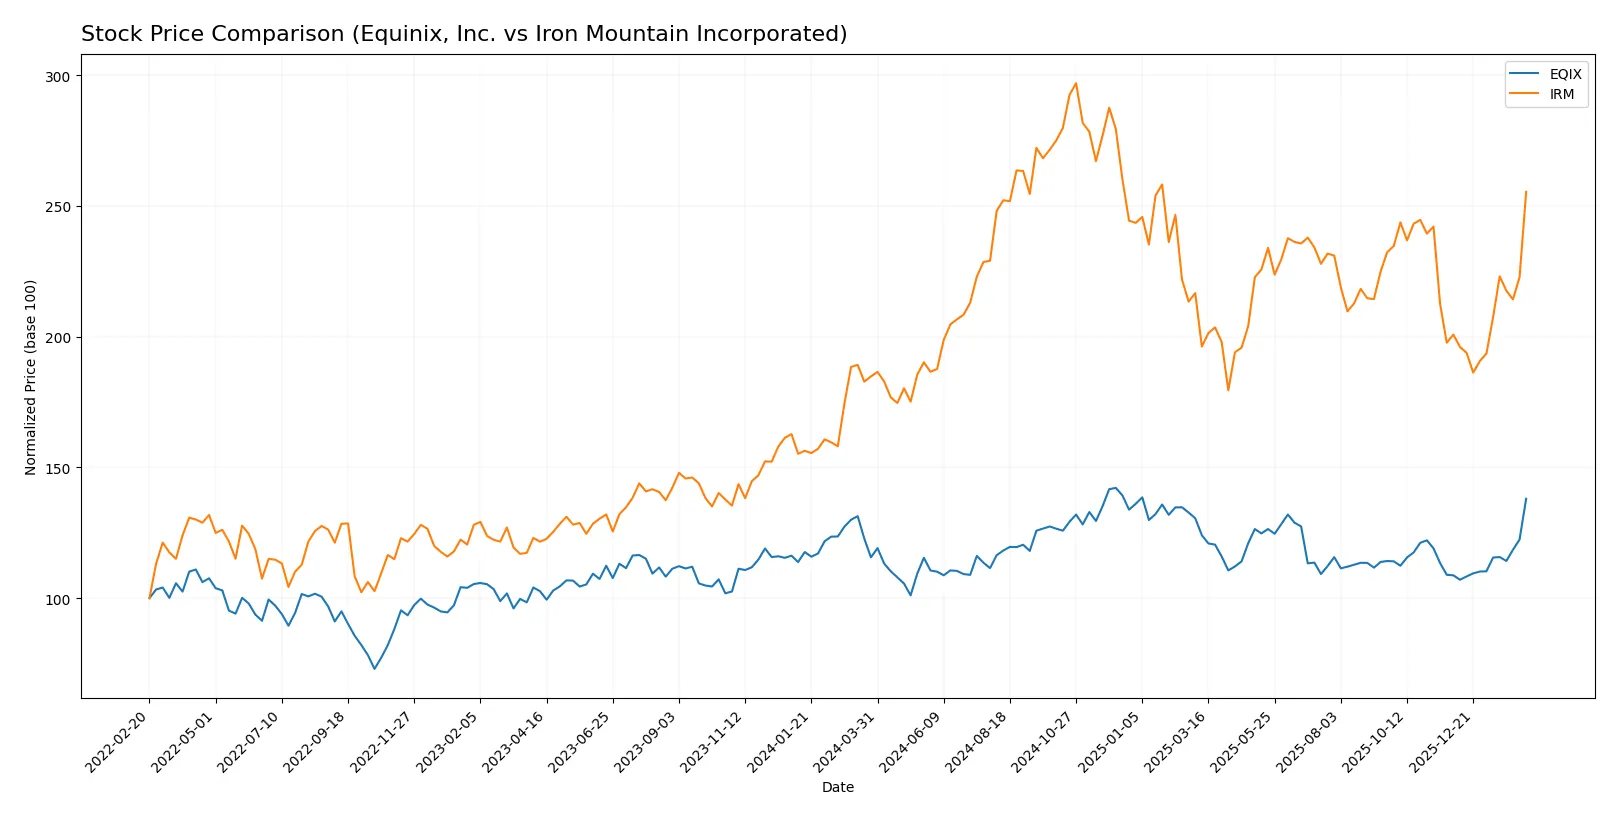
Trend Comparison
Equinix, Inc. gained 19.38% over the past 12 months, marking a bullish trend with price acceleration and high volatility, ranging from 700.18 to 985.0. Recent weeks show a sharper 26.93% rise.
Iron Mountain Incorporated increased 38.22% in the same period, also bullish with accelerating momentum but lower volatility. Prices moved between 75.1 and 127.7, with a recent 27.19% gain.
Iron Mountain’s stock outperformed Equinix, delivering higher total returns despite lower recent acceleration and volatility, indicating stronger market performance overall.
Target Prices
Analysts project moderate upside for both Equinix, Inc. and Iron Mountain Incorporated based on current consensus targets.
| Company | Target Low | Target High | Consensus |
|---|---|---|---|
| Equinix, Inc. | 870 | 1075 | 983.54 |
| Iron Mountain Inc. | 120 | 126 | 123 |
The target consensus for Equinix at $983.54 suggests a slight 3% upside from its $956.19 price. Iron Mountain’s $123 target implies about 12% potential gain over the current $109.83 price. Both reflect cautious optimism.

Don’t Let Luck Decide Your Entry Point
Optimize your entry points with our advanced ProRealTime indicators. You’ll get efficient buy signals with precise price targets for maximum performance. Start outperforming now!
How do institutions grade them?
Equinix, Inc. Grades
The following table summarizes recent institutional grades for Equinix, Inc.:
| Grading Company | Action | New Grade | Date |
|---|---|---|---|
| UBS | Maintain | Buy | 2026-02-12 |
| Scotiabank | Maintain | Sector Outperform | 2026-02-12 |
| BMO Capital | Maintain | Outperform | 2026-02-12 |
| Goldman Sachs | Maintain | Neutral | 2026-02-12 |
| Wells Fargo | Maintain | Overweight | 2026-02-12 |
| Guggenheim | Maintain | Buy | 2026-02-12 |
| Jefferies | Maintain | Buy | 2026-02-12 |
| JP Morgan | Maintain | Overweight | 2026-02-12 |
| Scotiabank | Maintain | Sector Outperform | 2026-01-14 |
| Jefferies | Maintain | Buy | 2025-12-16 |
Iron Mountain Incorporated Grades
The following table summarizes recent institutional grades for Iron Mountain Incorporated:
| Grading Company | Action | New Grade | Date |
|---|---|---|---|
| Barclays | Maintain | Overweight | 2025-11-12 |
| JP Morgan | Maintain | Overweight | 2025-11-06 |
| Barclays | Maintain | Overweight | 2025-08-20 |
| JP Morgan | Maintain | Overweight | 2025-08-07 |
| Barclays | Maintain | Overweight | 2025-05-27 |
| Barclays | Maintain | Overweight | 2025-03-20 |
| JP Morgan | Maintain | Overweight | 2025-02-18 |
| Wells Fargo | Maintain | Overweight | 2025-02-04 |
| Barclays | Maintain | Overweight | 2025-01-28 |
| RBC Capital | Maintain | Outperform | 2024-11-27 |
Which company has the best grades?
Equinix, Inc. consistently receives higher grades such as Buy and Sector Outperform. Iron Mountain is graded mostly Overweight with fewer Outperform ratings. Equinix’s stronger grades suggest more bullish institutional sentiment, which may influence investor confidence and valuation.
Risks specific to each company
The following categories identify critical pressure points and systemic threats facing Equinix, Inc. and Iron Mountain Incorporated in the 2026 market environment:
1. Market & Competition
Equinix, Inc.
- Faces intense competition in the digital infrastructure sector with high innovation demands.
Iron Mountain Incorporated
- Confronts challenges from digital transformation reducing demand for physical storage.
2. Capital Structure & Debt
Equinix, Inc.
- High debt-to-assets ratio (52%) and unfavorable interest coverage signal leverage risk.
Iron Mountain Incorporated
- Extremely high debt-to-assets ratio (89%) combined with weak interest coverage is a red flag.
3. Stock Volatility
Equinix, Inc.
- Beta near 1.07 indicates moderate market sensitivity and relatively stable volatility.
Iron Mountain Incorporated
- Higher beta at 1.18 suggests greater price fluctuations and market risk.
4. Regulatory & Legal
Equinix, Inc.
- Regulatory risks tied to data privacy and digital infrastructure compliance.
Iron Mountain Incorporated
- Exposure to records management regulations and environmental compliance pressures.
5. Supply Chain & Operations
Equinix, Inc.
- Operational risks in managing global data centers with scalability demands.
Iron Mountain Incorporated
- Complex logistics and facility management across 50 countries increase operational risk.
6. ESG & Climate Transition
Equinix, Inc.
- Pressure to reduce carbon footprint in energy-intensive data centers.
Iron Mountain Incorporated
- High exposure to climate risks through physical assets and regulatory ESG requirements.
7. Geopolitical Exposure
Equinix, Inc.
- Global data center footprint exposes it to geopolitical tensions and cyber threats.
Iron Mountain Incorporated
- Extensive international presence risks supply disruptions and political instability effects.
Which company shows a better risk-adjusted profile?
Equinix faces significant leverage and operational risks but benefits from a more stable market position and moderate volatility. Iron Mountain grapples with heavier debt burdens, weaker liquidity, and greater external vulnerabilities. The most impactful risk for Equinix is its high leverage and fragile interest coverage, while Iron Mountain’s critical risk is its excessive debt load paired with financial distress signals. Equinix’s Altman Z-score in the grey zone contrasts with Iron Mountain’s distress zone, indicating a comparatively better risk-adjusted profile despite challenges. Recent data revealing Iron Mountain’s deteriorated liquidity ratio (0.74) justifies heightened caution about solvency.
Final Verdict: Which stock to choose?
Equinix, Inc. wields unmatched efficiency through its growing profitability and strong income quality. Its slight value destruction, reflected in ROIC below WACC, is a point of vigilance. This stock fits well in aggressive growth portfolios seeking exposure to data center infrastructure leadership.
Iron Mountain Incorporated’s strategic moat lies in its resilient recurring revenue and steady operating returns. Despite weaker profitability trends and balance sheet risks, it offers better dividend yield and stability relative to Equinix. It suits value-oriented investors favoring income with moderate growth prospects.
If you prioritize scalable growth and improving profitability, Equinix is the compelling choice due to its accelerating price momentum and income strength. However, if you seek income stability with a defensive tilt, Iron Mountain offers better dividend yield and lower price volatility, albeit with notable financial risks.
Disclaimer: Investment carries a risk of loss of initial capital. The past performance is not a reliable indicator of future results. Be sure to understand risks before making an investment decision.
Go Further
I encourage you to read the complete analyses of Equinix, Inc. and Iron Mountain Incorporated to enhance your investment decisions: