Home > Comparison > Industrials > VRSK vs EFX
The strategic rivalry between Verisk Analytics, Inc. and Equifax Inc. shapes the consulting services landscape within the Industrials sector. Verisk excels as a data analytics powerhouse focused on predictive models across insurance, energy, and financial services. Equifax leads with comprehensive information solutions and business process automation, emphasizing workforce and consumer credit services. This analysis will determine which operational model offers superior risk-adjusted returns for a diversified portfolio amid evolving sector dynamics.
Table of contents
Companies Overview
Verisk Analytics and Equifax both command significant influence in the data-driven consulting services market.
Verisk Analytics, Inc.: Predictive Analytics Powerhouse
Verisk Analytics dominates the consulting services industry with advanced predictive analytics. Its core revenue stems from data solutions across insurance, energy, and financial sectors. In 2026, Verisk sharpens its focus on machine learning and AI models to enhance risk management and fraud detection for property, casualty, and financial clients.
Equifax Inc.: Comprehensive Information Solutions Leader
Equifax excels as a global provider of information solutions and HR outsourcing services. Its revenue primarily flows from credit reporting, identity verification, and fraud prevention across multiple industries worldwide. The company’s 2026 strategy emphasizes expanding workforce solutions and international services to deepen its footprint in consumer and commercial credit analytics.
Strategic Collision: Similarities & Divergences
Both firms operate in consulting services but diverge in approach: Verisk leans on predictive modeling, while Equifax prioritizes credit and identity data. Their competition centers on delivering superior analytics to financial and insurance clients. Verisk’s tech-driven niche contrasts with Equifax’s broad, multinational data platform, shaping distinct risk and growth profiles for investors.
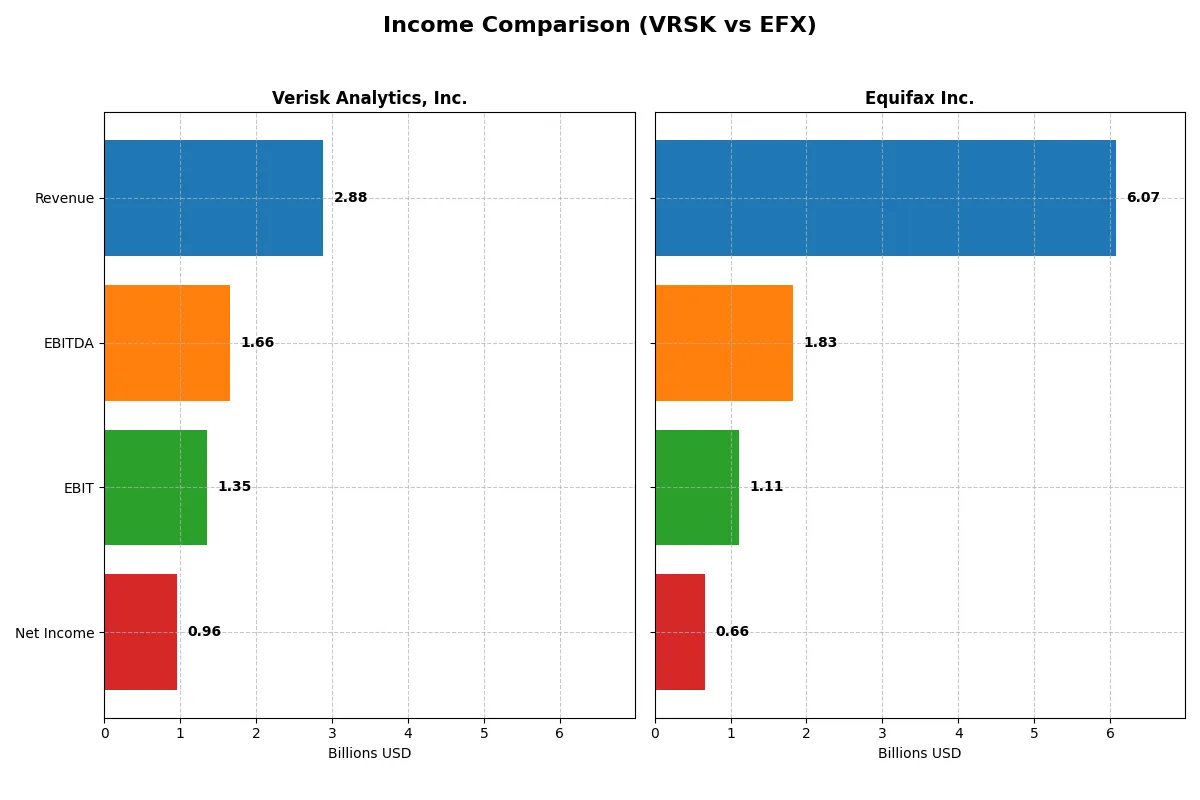
Income Statement Comparison
This data dissects the core profitability and scalability of both corporate engines to reveal who dominates the bottom line:
| Metric | Verisk Analytics, Inc. (VRSK) | Equifax Inc. (EFX) |
|---|---|---|
| Revenue | 2.88B | 5.68B |
| Cost of Revenue | 901M | 2.52B |
| Operating Expenses | 727M | 2.12B |
| Gross Profit | 1.98B | 3.16B |
| EBITDA | 1.66B | 1.72B |
| EBIT | 1.35B | 1.04B |
| Interest Expense | 125M | 229M |
| Net Income | 958M | 604M |
| EPS | 6.74 | 4.88 |
| Fiscal Year | 2024 | 2024 |
Income Statement Analysis: The Bottom-Line Duel
This income statement comparison reveals the true efficiency and profitability of two data analytics giants over recent years.
Verisk Analytics, Inc. (VRSK) Analysis
Verisk’s revenue climbed steadily from 2.27B in 2020 to 2.88B in 2024, lifting net income from 713M to 958M. Its gross margin holds strong at 68.7%, reflecting tight cost control. The 2024 net margin surged to 33.2%, boosted by 60.9% EPS growth, signaling robust operational momentum and high capital efficiency.
Equifax Inc. (EFX) Analysis
Equifax expanded revenue from 4.92B in 2021 to 6.07B in 2025 but saw net income decline from 744M to 660M. Gross margin weakened to 44.6%, squeezing EBIT margin to 18.2%. Despite 6.9% revenue growth in 2025, profit margins and EPS showed only modest improvement, illustrating margin pressure and less efficient cost management.
Margin Strength vs. Scale Growth
Verisk outperforms Equifax by delivering superior margin expansion and stronger net income growth despite smaller revenue scale. Verisk’s ability to convert sales into profit outpaces Equifax’s volume-driven model. For investors, Verisk’s margin resilience and profit momentum present a more compelling fundamental profile.
Financial Ratios Comparison
These vital ratios act as a diagnostic tool to expose the underlying fiscal health, valuation premiums, and capital efficiency of the companies compared:
| Ratios | Verisk Analytics, Inc. (VRSK) | Equifax Inc. (EFX) |
|---|---|---|
| ROE | 9.57% | 14.34% |
| ROIC | 27.21% | 7.69% |
| P/E | 40.89x | 40.48x |
| P/B | 391.15x | 5.81x |
| Current Ratio | 0.74 | 0.60 |
| Quick Ratio | 0.74 | 0.60 |
| D/E (Debt-to-Equity) | 32.43 | 1.11 |
| Debt-to-Assets | 76.11% | 42.93% |
| Interest Coverage | 10.06x | 5.16x |
| Asset Turnover | 0.68 | 0.51 |
| Fixed Asset Turnover | 3.78 | 3.14 |
| Payout Ratio | 23.11% | 35.26% |
| Dividend Yield | 0.57% | 0.87% |
| Fiscal Year | 2024 | 2025 |
Efficiency & Valuation Duel: The Vital Signs
Financial ratios act as the company’s DNA, exposing hidden risks and operational excellence that shape investor decisions and portfolio resilience.
Verisk Analytics, Inc.
Verisk shows exceptional profitability with a 33.23% net margin and an ROE of 956.54%, indicating strong operational efficiency. However, its valuation appears stretched, with a P/E of 40.89 and a P/B of 391.15. The company offers a modest 0.57% dividend yield, suggesting limited cash return but potential reinvestment in core operations.
Equifax Inc.
Equifax delivers moderate profitability, with a 10.87% net margin and 14.34% ROE, reflecting steady but less robust efficiency than Verisk. Its P/E of 40.48 and P/B of 5.81 also signal an expensive stock. The 0.87% dividend yield provides slightly better immediate returns, balanced with neutral reinvestment metrics.
Premium Valuation vs. Operational Safety
Verisk commands a premium valuation justified by superior profitability and efficiency metrics, while Equifax offers a more balanced but less profitable profile. Investors seeking operational excellence may lean toward Verisk, whereas those prioritizing steadier returns might prefer Equifax’s risk profile.
Which one offers the Superior Shareholder Reward?
I see Verisk Analytics (VRSK) and Equifax (EFX) both pay dividends with yields around 0.56% and 0.61%-0.87%, respectively. Equifax’s dividend yield in 2025 stands at a healthier 0.87%, supported by a payout ratio near 35%, indicating a balanced distribution. Verisk holds a lower payout ratio (~23%) and a stable yield around 0.57%. Verisk’s buybacks are less visible but implied by a strong free cash flow per share (~$6.5 in 2024) and disciplined capital allocation. Equifax shows moderate buyback capacity with free cash flow of $9.2 in 2025 but higher capex demands, reducing free cash flow coverage. Given Equifax’s higher dividend yield and reasonable payout, combined with sustainable free cash flow, I judge Equifax offers a superior total shareholder return potential in 2026, balancing income and capital reinvestment better than Verisk.
Comparative Score Analysis: The Strategic Profile
The radar chart reveals the fundamental DNA and trade-offs of Verisk Analytics and Equifax, highlighting their financial strengths and valuation challenges:
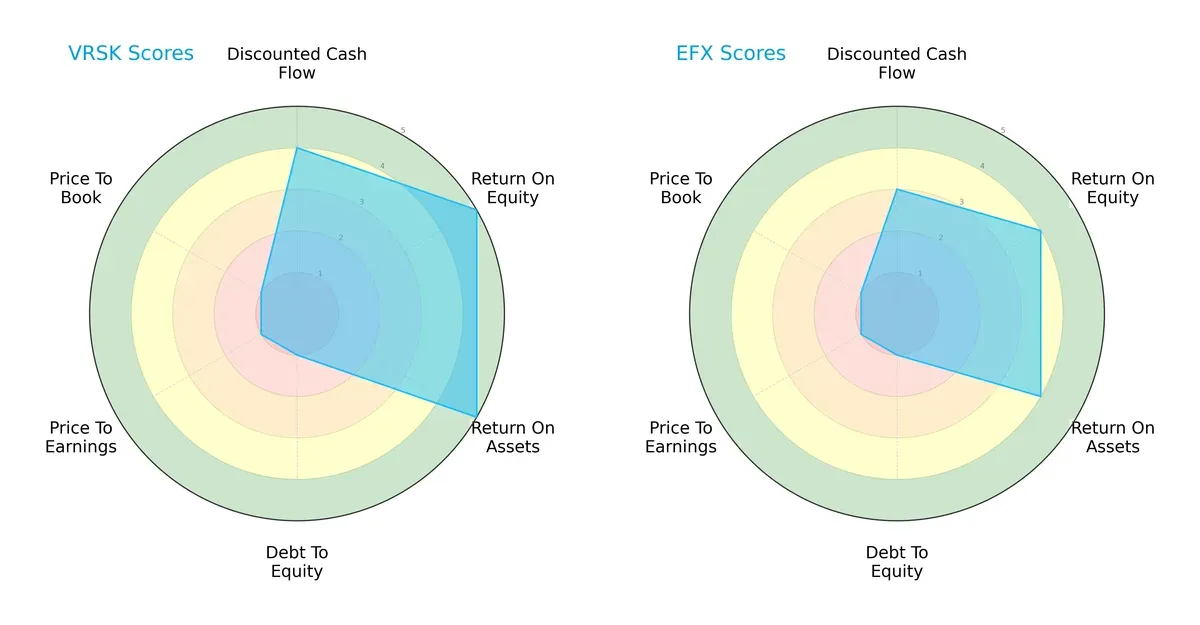
Verisk Analytics leads in profitability with top ROE and ROA scores (5 each), outperforming Equifax’s solid but lower marks (4 each). Both firms share weak debt-to-equity and valuation scores (all 1s), signaling high leverage and expensive multiples. Verisk’s profile is more balanced, leveraging operational efficiency, while Equifax relies on modest profitability gains amid financial strain.
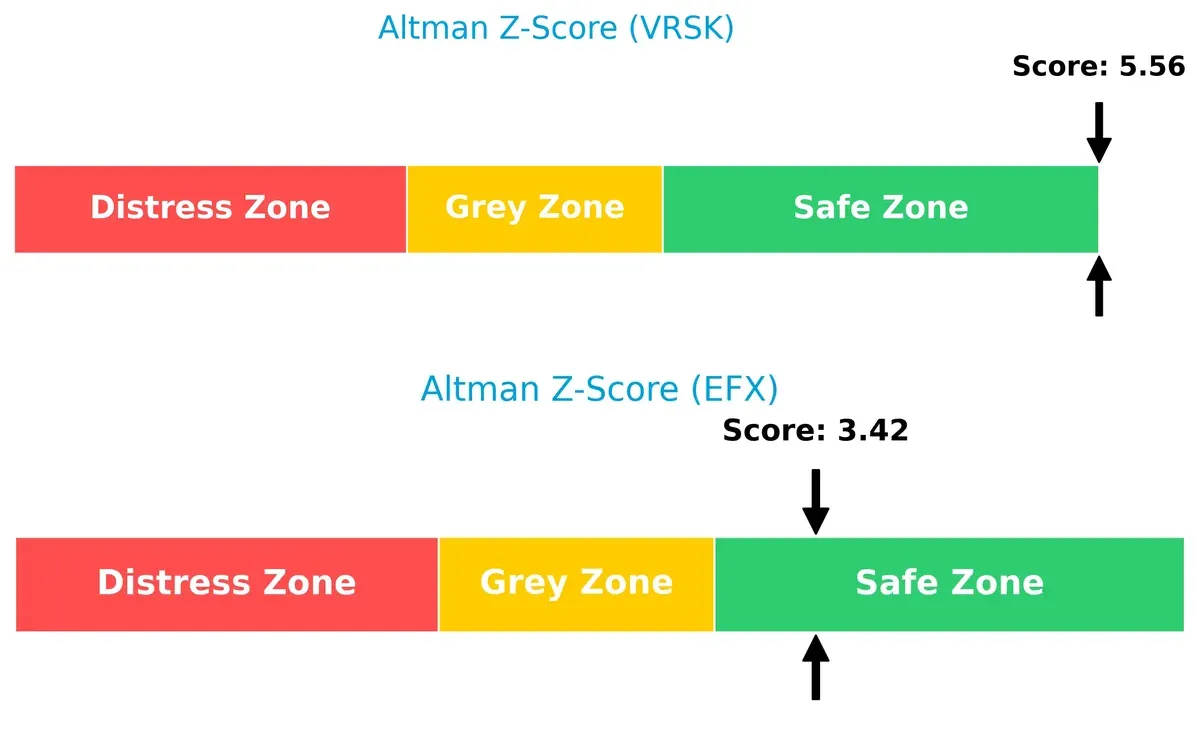
Bankruptcy Risk: Solvency Showdown
Verisk’s Altman Z-Score (5.56) comfortably exceeds Equifax’s (3.42), signaling a stronger buffer against bankruptcy risks in this economic cycle:
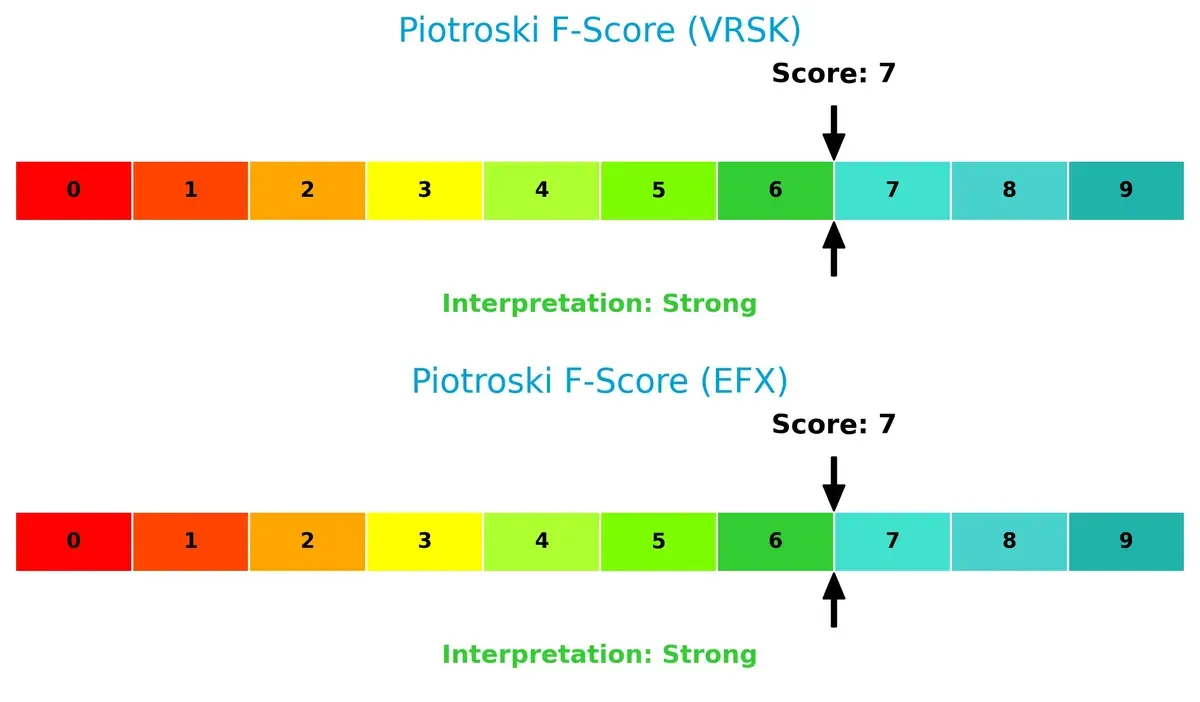
Financial Health: Quality of Operations
Both companies score a robust 7 on the Piotroski F-Score, indicating strong financial health and operational quality with no immediate red flags:
How are the two companies positioned?
This section dissects the operational DNA of Verisk and Equifax by comparing their revenue distribution by segment and internal dynamics. The goal is to confront their economic moats and identify which model offers the most resilient competitive advantage today.
Revenue Segmentation: The Strategic Mix
This visual comparison dissects how Verisk Analytics and Equifax diversify their income streams and where their primary sector bets lie:
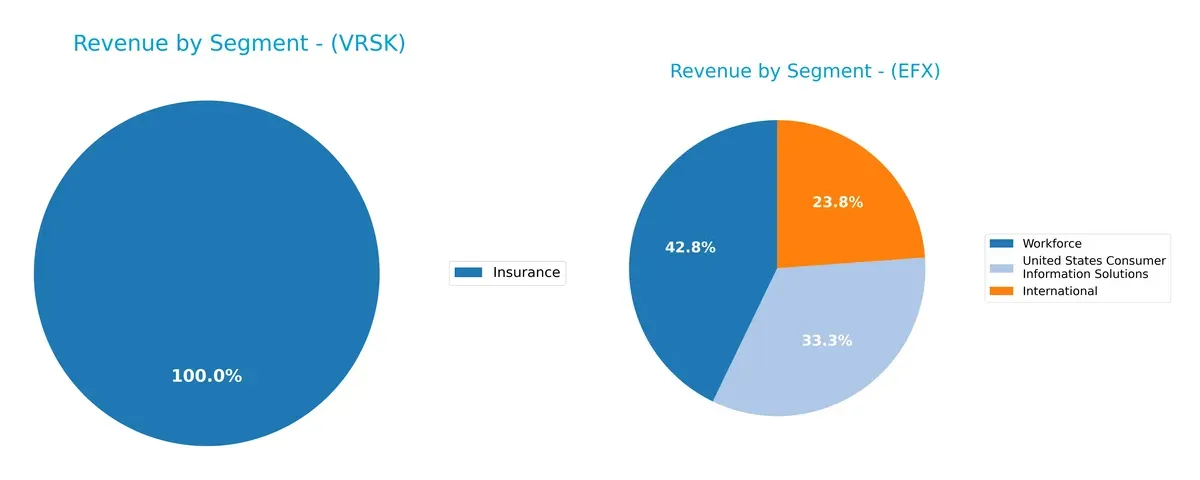
Verisk Analytics leans heavily on its Insurance segment, generating $2.88B in 2024, anchoring its revenue with limited diversification. Equifax, however, boasts a balanced mix: Workforce leads at $2.43B, followed by U.S. Consumer Information Solutions at $1.89B, and International at $1.35B. Equifax’s diversified portfolio reduces concentration risk and supports ecosystem lock-in, while Verisk’s reliance on insurance data exposes it to sector-specific volatility.
Strengths and Weaknesses Comparison
This table compares the Strengths and Weaknesses of Verisk Analytics, Inc. (VRSK) and Equifax Inc. (EFX):
VRSK Strengths
- High net margin at 33.23%
- Very strong ROE at 956.54%
- ROIC well above WACC at 27.21%
- Favorable interest coverage at 10.86
- Diverse revenue streams including insurance and specialized markets
- Solid global presence with significant US and UK sales
EFX Strengths
- Positive net margin at 10.87%
- Favorable interest coverage at 5.22
- Balanced revenue segments including international and workforce
- Strong US market dominance with $4.3B revenue
- Geographic diversification including Australia and UK
- Moderate fixed asset turnover signaling operational efficiency
VRSK Weaknesses
- Unfavorable high P/E at 40.89 and extremely high P/B at 391.15
- Current and quick ratios below 1 indicating liquidity concerns
- High debt to assets ratio at 76.11%, signaling leverage risk
- Dividend yield low at 0.57%
- Moderate asset turnover at 0.68
- Debt-to-equity ratio at 32.43 may weigh on financial stability
EFX Weaknesses
- Also elevated P/E at 40.48 and P/B at 5.81
- Low current and quick ratios at 0.6, reflecting liquidity pressure
- Debt-to-equity very low at 1.11 but with neutral debt to assets at 42.93%
- Dividend yield at 0.87% considered low
- ROE and ROIC only neutral, near cost of capital
- Asset turnover comparatively weaker at 0.51
Both companies show slightly unfavorable global ratio profiles, but VRSK excels in profitability and returns, whereas EFX demonstrates stronger geographic and segment diversification. Each faces liquidity and valuation challenges that may influence strategic capital allocation and risk management.
The Moat Duel: Analyzing Competitive Defensibility
A durable structural moat shields long-term profits from relentless competitive pressure. Let’s dissect the core moats of two industry leaders:
Verisk Analytics, Inc.: Data-Driven Predictive Power
Verisk’s moat lies in its intangible assets and advanced analytics, reflected in a commanding 47% EBIT margin and growing ROIC. Expansion in AI-enhanced risk models promises deeper market entrenchment in 2026.
Equifax Inc.: Credit Data Network with Waning Returns
Equifax leverages a broad credit data network, yet its declining ROIC and compressed margins reveal weakening competitive positioning. Growth hinges on international expansion and digital identity services to offset margin pressures.
Moat Mastery: Predictive Analytics vs. Data Network Resilience
Verisk’s growing ROIC outpaces Equifax’s declining profitability, signaling a wider moat. Verisk is better equipped to defend and expand its market share through innovation and margin strength.
Which stock offers better returns?
Over the past 12 months, both Verisk Analytics and Equifax experienced notable declines, with Verisk showing greater volatility and a sharper price drop.
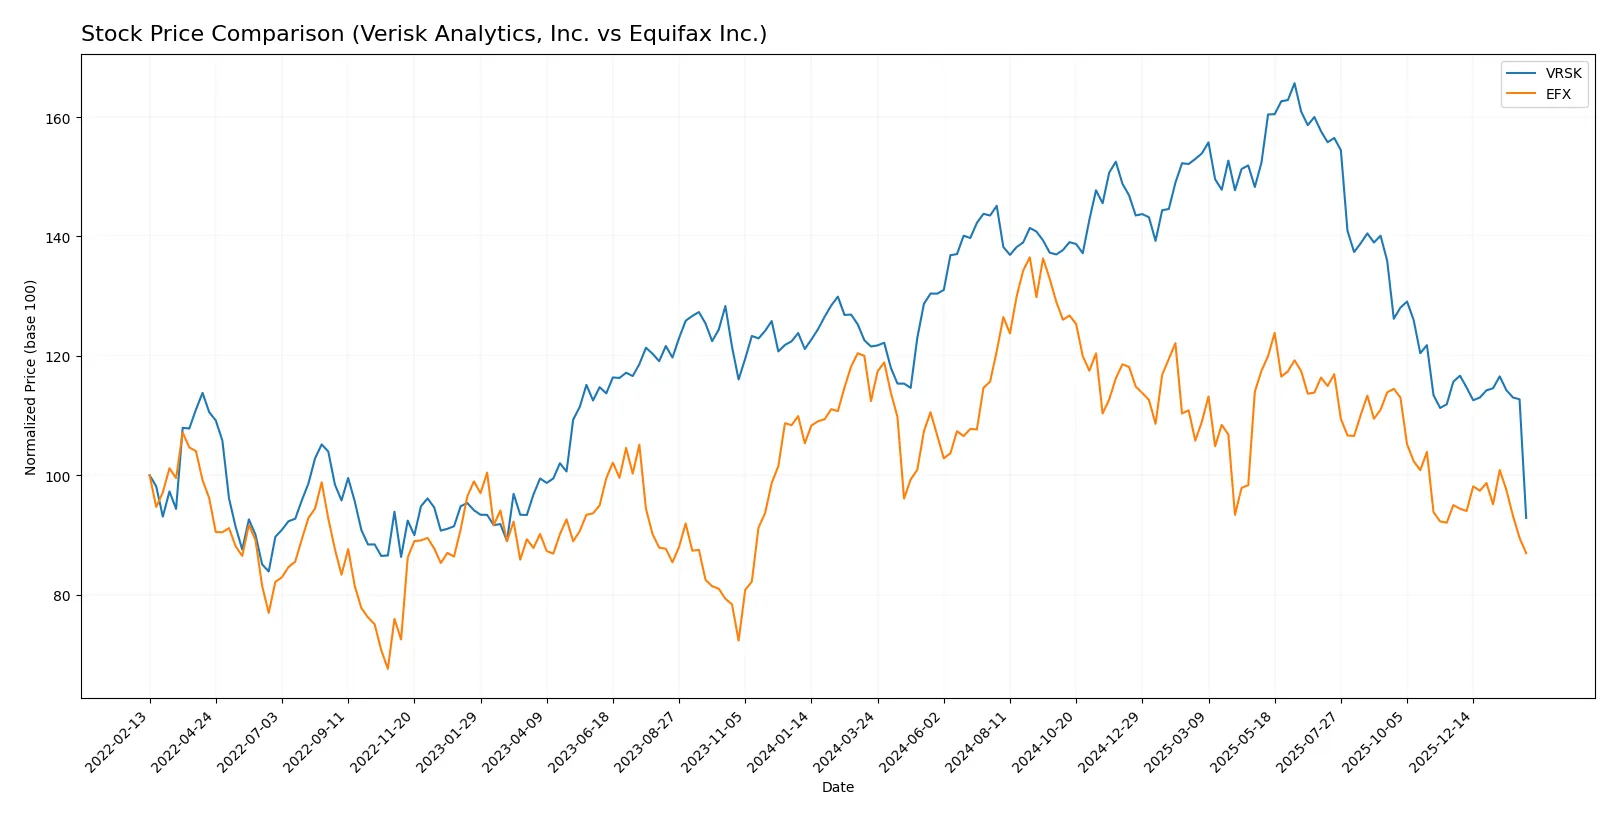
Trend Comparison
Verisk Analytics’ stock fell 23.63% over the last year, indicating a bearish trend with decelerating losses and high volatility, peaking at 319.6 and bottoming at 179.1.
Equifax’s stock dropped 22.66%, also bearish with deceleration and slightly lower volatility. It ranged between 307.13 at its high and 195.62 at its low.
Verisk’s price decline exceeded Equifax’s, delivering a weaker market performance over the past year.
Target Prices
Analysts present a bullish consensus for Verisk Analytics and Equifax, suggesting notable upside potential.
| Company | Target Low | Target High | Consensus |
|---|---|---|---|
| Verisk Analytics, Inc. | 233 | 334 | 267.67 |
| Equifax Inc. | 195 | 285 | 238.18 |
Both companies trade well below their consensus targets, implying analysts expect meaningful price appreciation. Verisk’s current price of 179.1 and Equifax’s 195.62 leave ample room for growth according to these forecasts.

Don’t Let Luck Decide Your Entry Point
Optimize your entry points with our advanced ProRealTime indicators. You’ll get efficient buy signals with precise price targets for maximum performance. Start outperforming now!
How do institutions grade them?
Institutional grades for Verisk Analytics, Inc. and Equifax Inc. are summarized as follows:
Verisk Analytics, Inc. Grades
The following table lists recent grades and actions from major grading companies for Verisk Analytics, Inc.:
| Grading Company | Action | New Grade | Date |
|---|---|---|---|
| Morgan Stanley | maintain | Equal Weight | 2025-12-17 |
| Goldman Sachs | maintain | Neutral | 2025-10-30 |
| RBC Capital | maintain | Outperform | 2025-10-30 |
| Evercore ISI Group | maintain | In Line | 2025-10-30 |
| Barclays | upgrade | Overweight | 2025-10-30 |
| JP Morgan | maintain | Overweight | 2025-10-30 |
| Wells Fargo | maintain | Overweight | 2025-10-30 |
| Rothschild & Co | downgrade | Sell | 2025-10-16 |
| Evercore ISI Group | maintain | In Line | 2025-10-14 |
| Wells Fargo | maintain | Overweight | 2025-09-17 |
Equifax Inc. Grades
The following table lists recent grades and actions from major grading companies for Equifax Inc.:
| Grading Company | Action | New Grade | Date |
|---|---|---|---|
| Stifel | maintain | Buy | 2026-02-05 |
| Morgan Stanley | maintain | Overweight | 2026-02-05 |
| Wells Fargo | maintain | Overweight | 2026-02-05 |
| RBC Capital | maintain | Outperform | 2026-02-05 |
| Barclays | maintain | Equal Weight | 2026-02-05 |
| Needham | maintain | Buy | 2026-02-05 |
| JP Morgan | maintain | Overweight | 2026-02-05 |
| Wells Fargo | maintain | Overweight | 2026-01-14 |
| Oppenheimer | maintain | Outperform | 2026-01-12 |
| Morgan Stanley | maintain | Overweight | 2025-12-17 |
Which company has the best grades?
Equifax Inc. consistently receives higher grades, including multiple “Buy,” “Overweight,” and “Outperform” ratings. Verisk Analytics shows mixed grades with some downgrades. Investors may view Equifax’s stronger consensus as a sign of greater institutional confidence.
Risks specific to each company
The following categories identify the critical pressure points and systemic threats facing both firms in the 2026 market environment:
1. Market & Competition
Verisk Analytics, Inc. (VRSK)
- Operates in competitive analytics and consulting; strong AI integration but faces pricing pressure from new entrants.
Equifax Inc. (EFX)
- Broad geographic footprint and diverse segments; exposed to intense credit data competition and evolving fintech disruptors.
2. Capital Structure & Debt
Verisk Analytics, Inc. (VRSK)
- High debt-to-assets at 76% signals leveraged balance sheet; interest coverage remains comfortable at 10.9x.
Equifax Inc. (EFX)
- Moderate debt-to-assets at 43%; debt-to-equity very unfavorable, signaling financial risk despite decent interest coverage of 5.2x.
3. Stock Volatility
Verisk Analytics, Inc. (VRSK)
- Beta of 0.80 indicates below-market volatility, suggesting defensive stock characteristics.
Equifax Inc. (EFX)
- Beta of 1.54 shows higher market sensitivity, implying greater price swings and risk.
4. Regulatory & Legal
Verisk Analytics, Inc. (VRSK)
- Faces regulatory scrutiny on data privacy, but less exposed internationally.
Equifax Inc. (EFX)
- Extensive global operations increase regulatory complexity and legal risks, especially in privacy and consumer protection.
5. Supply Chain & Operations
Verisk Analytics, Inc. (VRSK)
- Relies on data infrastructure and AI models; operational risk limited but dependent on technology uptime.
Equifax Inc. (EFX)
- Operates complex global data systems; vulnerable to operational disruptions and cybersecurity threats.
6. ESG & Climate Transition
Verisk Analytics, Inc. (VRSK)
- Provides analytics supporting climate risk assessment; proactive ESG initiatives boost profile.
Equifax Inc. (EFX)
- ESG efforts growing but lag peers; climate transition risks less directly tied to core business.
7. Geopolitical Exposure
Verisk Analytics, Inc. (VRSK)
- Primarily US-focused with limited international risk; geopolitical tensions have minor direct impact.
Equifax Inc. (EFX)
- Broad international footprint exposes firm to geopolitical instability and regulatory divergence risks.
Which company shows a better risk-adjusted profile?
Verisk’s highest risk is its elevated leverage, which could limit financial flexibility despite strong interest coverage. Equifax’s major risk lies in its volatile stock behavior and complex global regulatory environment. Overall, Verisk’s lower beta and stronger operational focus suggest a better risk-adjusted profile, although leverage remains a critical watchpoint. Recent data confirm Verisk’s reliance on debt as a key vulnerability, while Equifax’s international regulatory exposure demands cautious evaluation.
Final Verdict: Which stock to choose?
Verisk Analytics leverages a robust economic moat fueled by a rising ROIC well above its cost of capital. Its superpower lies in consistently creating value through operational efficiency and strong profitability. However, the low liquidity ratios warrant vigilance. It suits investors with an appetite for aggressive growth and durable moats.
Equifax stands out for its strategic moat built on recurring revenue streams and a solid foothold in credit reporting. It offers a more conservative profile compared to Verisk, with moderate returns and a steadier capital structure. This positions Equifax well for GARP-focused portfolios seeking growth with reasonable risk.
If you prioritize sustainable value creation and high operating returns, Verisk outshines due to its expanding profitability and efficient capital use. However, if your focus is on stability and steady recurring cash flow, Equifax offers better stability despite weaker ROIC metrics. Each fits distinct investor profiles balancing growth ambitions and risk tolerance.
Disclaimer: Investment carries a risk of loss of initial capital. The past performance is not a reliable indicator of future results. Be sure to understand risks before making an investment decision.
Go Further
I encourage you to read the complete analyses of Verisk Analytics, Inc. and Equifax Inc. to enhance your investment decisions: