EQT Corporation and Texas Pacific Land Corporation stand out in the competitive oil and gas exploration and production industry, each with unique approaches to resource management and innovation. EQT focuses on natural gas production with vast reserves, while Texas Pacific emphasizes land and water services in the Permian Basin. This article will guide you through their key differences to help determine which company offers the most compelling investment opportunity in 2026.
Table of contents
Companies Overview
I will begin the comparison between EQT Corporation and Texas Pacific Land Corporation by providing an overview of these two companies and their main differences.
EQT Corporation Overview
EQT Corporation operates as a natural gas production company in the United States, focusing on producing natural gas and natural gas liquids such as ethane, propane, and butane. With 25.0T cubic feet of proved reserves across 2.0M gross acres, including 1.7M acres in the Marcellus play, EQT is a major player in the energy sector. Founded in 1878, it is headquartered in Pittsburgh, PA.
Texas Pacific Land Corporation Overview
Texas Pacific Land Corporation engages in land and resource management alongside water services and operations, managing about 880K acres of land. The company holds various nonparticipating royalty interests and leases land for multiple energy-related activities. Its water services segment supports operators in the Permian Basin with sourcing, treatment, and infrastructure. Founded in 1888, it is based in Dallas, TX.
Key similarities and differences
Both companies operate within the energy sector and are listed on the NYSE, focusing on oil and gas-related activities. EQT primarily produces natural gas and liquids, while Texas Pacific Land emphasizes land/resource management and water services. EQT has a considerably larger workforce (881 vs. 111 employees) and a higher market cap ($31.9B vs. $21.5B), highlighting differences in scale and operational focus.
Income Statement Comparison
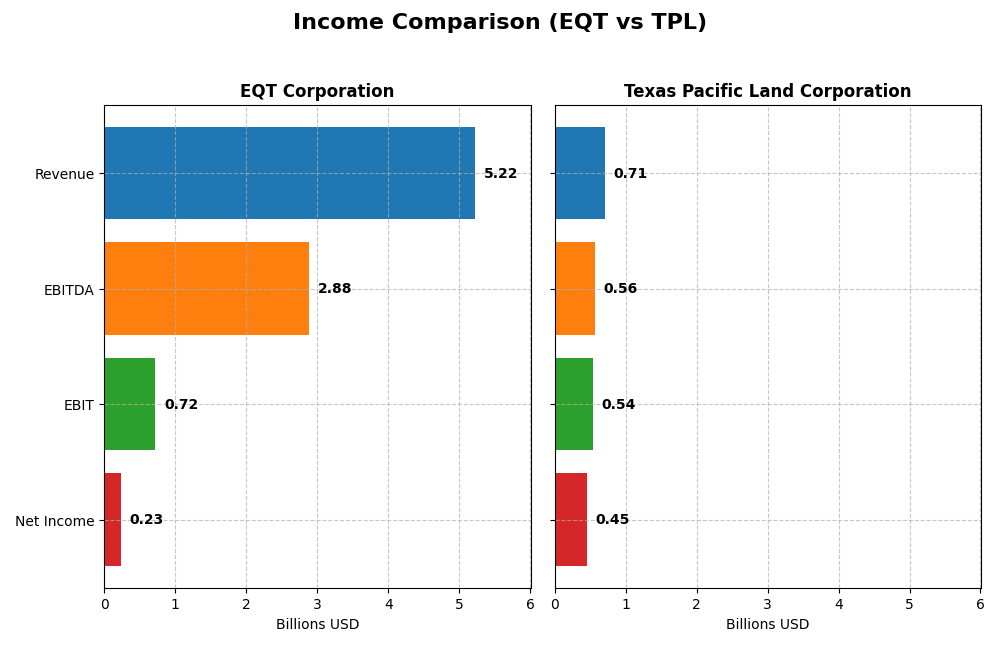
Below is the income statement comparison for fiscal year 2024 of EQT Corporation and Texas Pacific Land Corporation, highlighting key financial metrics side by side.
| Metric | EQT Corporation | Texas Pacific Land Corporation |
|---|---|---|
| Market Cap | 31.9B | 21.5B |
| Revenue | 5.22B | 706M |
| EBITDA | 2.88B | 564M |
| EBIT | 719M | 539M |
| Net Income | 231M | 454M |
| EPS | 0.45 | 6.58 |
| Fiscal Year | 2024 | 2024 |
Income Statement Interpretations
EQT Corporation
EQT Corporation showed an overall revenue growth of 96.4% and net income growth of 124% from 2020 to 2024, with net margin improvements of 112.2%. However, the most recent year saw a 3% revenue increase but significant declines in gross profit (−18.5%), EBIT (−69.1%), and net margin (−87.1%), indicating deteriorating profitability despite a stable gross margin of 14.7%.
Texas Pacific Land Corporation
Texas Pacific Land Corporation experienced robust growth with 133.3% revenue and 157.9% net income increases over 2020–2024, maintaining high margins: gross margin at 89.9%, EBIT margin at 76.4%, and net margin at 64.3%. In 2024, revenue rose 11.8%, gross profit 8.8%, and EBIT 10.9%, while net margin remained stable, reflecting consistent profitability and operational efficiency.
Which one has the stronger fundamentals?
Texas Pacific Land Corporation presents stronger fundamentals with predominantly favorable margin levels and consistent growth in revenues and earnings, alongside zero interest expense. EQT Corporation, while showing long-term growth, has a mixed recent performance with declining margins and profitability, leading to a neutral overall income statement evaluation.
Financial Ratios Comparison
The table below presents a side-by-side comparison of key financial ratios for EQT Corporation and Texas Pacific Land Corporation based on their latest fiscal year data.
| Ratios | EQT Corporation (2024) | Texas Pacific Land Corporation (2024) |
|---|---|---|
| ROE | 1.12% | 40.09% |
| ROIC | 1.66% | 35.60% |
| P/E | 101.91 | 18.67 |
| P/B | 1.14 | 7.48 |
| Current Ratio | 0.70 | 8.33 |
| Quick Ratio | 0.70 | 8.33 |
| D/E (Debt-to-Equity) | 0.45 | 0.0004 |
| Debt-to-Assets | 23.5% | 0.04% |
| Interest Coverage | 1.51 | 0 |
| Asset Turnover | 0.13 | 0.57 |
| Fixed Asset Turnover | 0.16 | 1.27 |
| Payout Ratio | 142% | 77% |
| Dividend Yield | 1.39% | 4.10% |
Interpretation of the Ratios
EQT Corporation
EQT’s 2024 ratios reveal several weaknesses: low net margin (4.42%), poor return on equity (1.12%), and low return on invested capital (1.66%), all unfavorable. Its liquidity ratios are below 1, signaling potential short-term liquidity issues, while debt metrics are favorable. The company offers a modest dividend yield of 1.39%, but overall ratio evaluation is unfavorable.
Texas Pacific Land Corporation
Texas Pacific Land shows strong profitability with a 64.32% net margin, high return on equity (40.09%), and robust ROIC (35.6%). Most leverage ratios are favorable, including zero debt to equity and minimal debt to assets. Liquidity ratios are mixed, with an overly high current ratio. The dividend yield is attractive at 4.1%, supporting a favorable overall ratio assessment.
Which one has the best ratios?
Comparing both, Texas Pacific Land Corporation clearly exhibits stronger profitability and financial health ratios than EQT Corporation. While EQT struggles with low returns and liquidity, Texas Pacific Land maintains favorable leverage, earnings, and dividend metrics. The global ratio opinion favors Texas Pacific Land, indicating a more solid financial position in 2024.
Strategic Positioning
This section compares the strategic positioning of EQT Corporation and Texas Pacific Land Corporation, including market position, key segments, and exposure to technological disruption:
EQT Corporation
- Large natural gas producer with 25T cubic feet reserves, facing competition in oil & gas E&P sector.
- Revenue driven by natural gas, NGLs, and oil sales; focused on production and midstream operations.
- Limited explicit exposure to technological disruption noted; traditional hydrocarbon production focus.
Texas Pacific Land Corporation
- Manages 880K acres with royalty interests; niche land and water services in Permian Basin.
- Revenue from land easements, oil & gas royalties, and water services; diversified within land management.
- Water services segment includes infrastructure and analytics, suggesting adaptation to operational tech demands.
EQT Corporation vs Texas Pacific Land Corporation Positioning
EQT pursues a concentrated strategy centered on hydrocarbon production with significant reserves, while Texas Pacific Land adopts a diversified approach combining land management, royalties, and water services. EQT’s scale offers volume advantages; Texas Pacific Land benefits from asset diversification and service innovation.
Which has the best competitive advantage?
Texas Pacific Land shows a very favorable moat with ROIC exceeding WACC by 27.4% and steady growth, indicating a durable competitive advantage. EQT’s moat is slightly unfavorable, destroying value despite improving profitability.
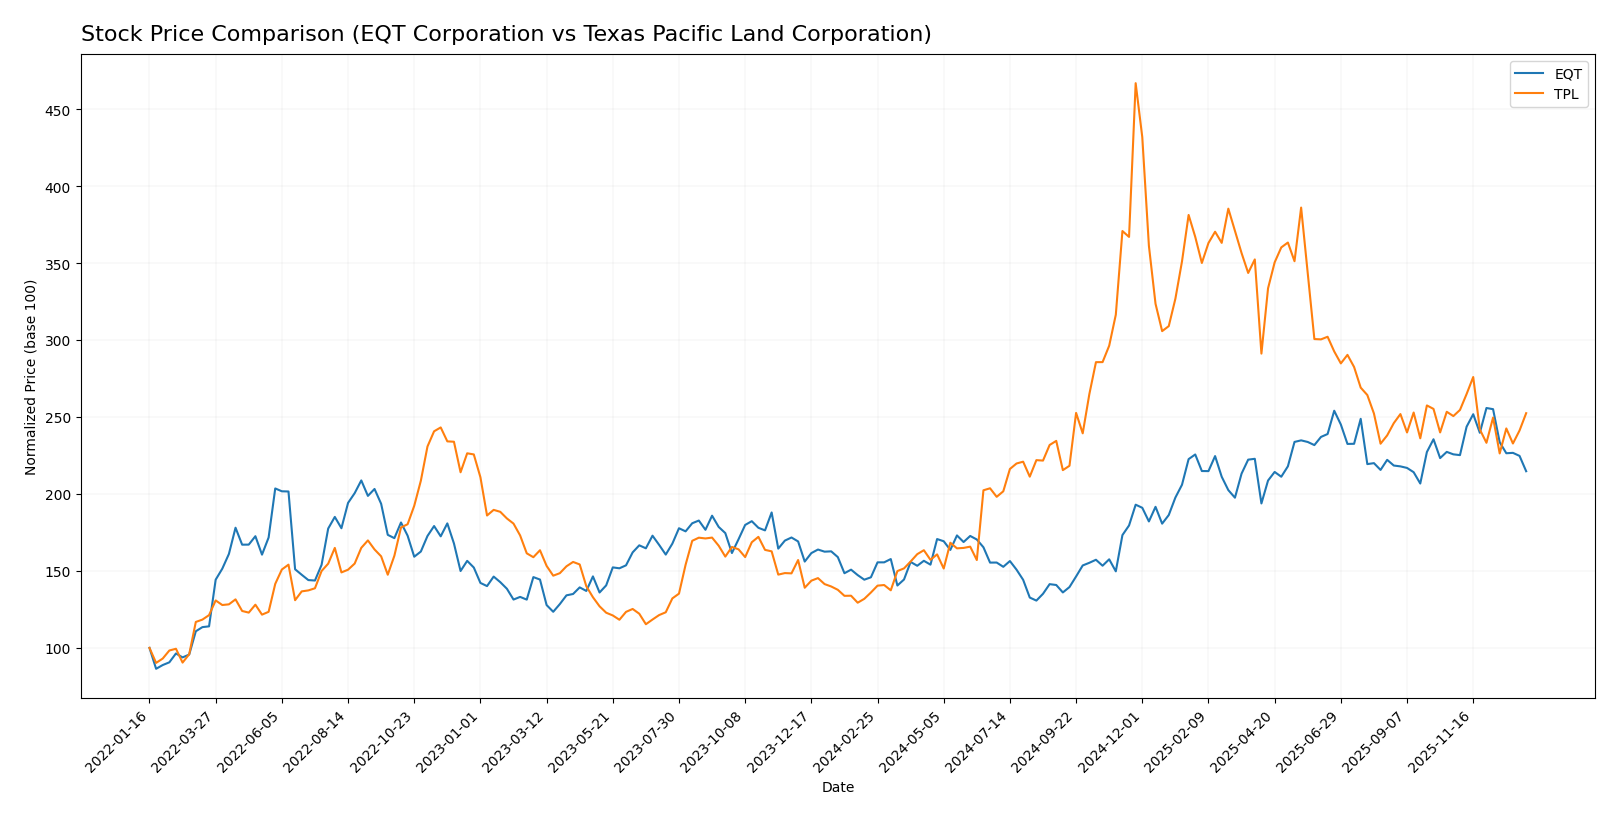
Stock Comparison
The stock price movements of EQT Corporation and Texas Pacific Land Corporation over the past 12 months reveal strong bullish trends with decelerating momentum, highlighting significant gains and distinct trading dynamics.
Trend Analysis
EQT Corporation’s stock showed a 47.23% increase over the past year, indicating a bullish trend with deceleration. The price ranged from a low of 31.1 to a high of 60.86, with volatility measured by an 8.62 standard deviation.
Texas Pacific Land Corporation’s stock gained 85.66% over the same period, also bullish with deceleration. It experienced higher volatility, with a standard deviation of 91.94, and prices fluctuated between 167.98 and 576.67.
Comparing the two, Texas Pacific Land Corporation delivered the highest market performance with an 85.66% increase, outperforming EQT’s 47.23% gain over the past year.
Target Prices
The target price consensus for EQT Corporation and Texas Pacific Land Corporation reflects a broad range of analyst expectations.
| Company | Target High | Target Low | Consensus |
|---|---|---|---|
| EQT Corporation | 55 | 23 | 41.11 |
| Texas Pacific Land Corporation | 1050 | 1050 | 1050 |
Analysts expect EQT’s stock price to settle below its current price of 51.09 USD, indicating some downside risk. Texas Pacific Land’s consensus target is significantly above its current price of 311.87 USD, suggesting strong growth potential.
Analyst Opinions Comparison
This section compares analysts’ ratings and grades for EQT Corporation and Texas Pacific Land Corporation:
Rating Comparison
EQT Rating
- Rating: A- with a very favorable status indicating strong financial standing.
- Discounted Cash Flow Score: 5, very favorable, suggesting undervaluation based on future cash flow.
- ROE Score: 4, favorable, showing efficient profit generation from equity.
- ROA Score: 4, favorable, reflecting effective asset utilization.
- Debt To Equity Score: 2, moderate, implying higher financial risk compared to TPL.
- Overall Score: 4, favorable, summarizing a strong financial position.
TPL Rating
- Rating: A- with a very favorable status indicating strong financial standing.
- Discounted Cash Flow Score: 4, favorable, indicating fairly valued but less strong than EQT.
- ROE Score: 5, very favorable, indicating superior efficiency in generating profit from equity.
- ROA Score: 5, very favorable, indicating more effective use of assets to generate earnings.
- Debt To Equity Score: 3, moderate, indicating slightly better financial stability than EQT.
- Overall Score: 4, favorable, summarizing a strong financial position.
Which one is the best rated?
Both EQT and TPL hold an identical overall rating of A- with favorable overall scores. TPL scores higher in ROE and ROA, indicating stronger profitability and asset use, while EQT leads in discounted cash flow valuation. Debt-to-equity scores are moderate for both, with TPL slightly better.
Scores Comparison
Here is a comparison of the Altman Z-Score and Piotroski Score for the two companies:
EQT Scores
- Altman Z-Score: 2.01, positioned in the grey zone, indicating moderate bankruptcy risk.
- Piotroski Score: 8, classified as very strong financial health.
TPL Scores
- Altman Z-Score: 29.77, well within the safe zone, showing very low bankruptcy risk.
- Piotroski Score: 4, representing average financial strength.
Which company has the best scores?
Based strictly on the provided data, TPL has a significantly higher Altman Z-Score in the safe zone, while EQT has a much stronger Piotroski Score. Each company shows strengths in different financial score metrics.
Grades Comparison
The grades comparison for EQT Corporation and Texas Pacific Land Corporation from established grading companies is as follows:
EQT Corporation Grades
This table summarizes recent grades from recognized grading companies for EQT Corporation.
| Grading Company | Action | New Grade | Date |
|---|---|---|---|
| Bernstein | Maintain | Outperform | 2026-01-05 |
| Citigroup | Maintain | Buy | 2025-12-19 |
| Mizuho | Maintain | Outperform | 2025-12-12 |
| UBS | Maintain | Buy | 2025-12-12 |
| Scotiabank | Maintain | Sector Perform | 2025-11-21 |
| Piper Sandler | Maintain | Neutral | 2025-11-18 |
| Wells Fargo | Maintain | Overweight | 2025-10-23 |
| UBS | Maintain | Buy | 2025-10-17 |
| Scotiabank | Maintain | Sector Perform | 2025-10-09 |
| Barclays | Maintain | Overweight | 2025-10-07 |
EQT Corporation’s grades consistently range from Buy/Outperform to Sector Perform, indicating a generally positive outlook with no downgrades.
Texas Pacific Land Corporation Grades
This table summarizes recent grades from recognized grading companies for Texas Pacific Land Corporation.
| Grading Company | Action | New Grade | Date |
|---|---|---|---|
| BWS Financial | Maintain | Buy | 2024-08-12 |
| BWS Financial | Maintain | Buy | 2024-05-10 |
| BWS Financial | Maintain | Buy | 2024-04-02 |
| Stifel | Maintain | Hold | 2024-01-23 |
| Stifel | Maintain | Hold | 2023-11-30 |
| Stifel | Maintain | Hold | 2023-05-22 |
| Stifel | Maintain | Hold | 2023-05-21 |
| Stifel | Maintain | Hold | 2023-04-27 |
| Stifel | Maintain | Hold | 2023-04-26 |
| Stifel | Maintain | Hold | 2023-04-12 |
Texas Pacific Land Corporation’s grades are predominantly Hold with several Buy ratings from BWS Financial, reflecting a more cautious consensus.
Which company has the best grades?
EQT Corporation has received stronger and more consistent Buy and Outperform grades compared to Texas Pacific Land Corporation’s mix of Buy and Hold ratings. This suggests that investors might perceive EQT as having higher growth or value potential, while TPL’s more mixed grades imply a more moderate outlook and potentially higher caution.
Strengths and Weaknesses
Below is a comparative table outlining the main strengths and weaknesses of EQT Corporation and Texas Pacific Land Corporation (TPL) based on recent financial and operational data.
| Criterion | EQT Corporation | Texas Pacific Land Corporation |
|---|---|---|
| Diversification | Moderate, primarily natural gas sales with some NGLs and oil exposure | Diversified revenue streams including royalties, easements, land sales, and water-related revenues |
| Profitability | Low net margin (4.42%) and ROIC (1.66%), currently shedding value | High net margin (64.32%) and ROIC (35.6%), consistently creating value |
| Innovation | Limited evidence of innovation impact, operating in traditional energy extraction | Focus on land management and resource royalties provides a unique market position |
| Global presence | Primarily US-focused natural gas operations | US land holdings, no significant global footprint |
| Market Share | Significant player in US natural gas market but facing profitability challenges | Niche leader in land and mineral rights with strong competitive moat |
Key takeaways: TPL demonstrates a robust and diversified business model with strong profitability and a durable competitive advantage. EQT, while growing profitability, currently struggles with value creation and financial ratios, indicating higher investment risk.
Risk Analysis
Below is a comparative table outlining key risks for EQT Corporation and Texas Pacific Land Corporation based on the most recent data for 2024.
| Metric | EQT Corporation | Texas Pacific Land Corporation |
|---|---|---|
| Market Risk | Moderate (Beta 0.68) | Moderate-High (Beta 0.94) |
| Debt Level | Moderate (Debt/Equity 0.45) | Very Low (Debt/Equity 0.0) |
| Regulatory Risk | Elevated (Energy sector, US regulations) | Moderate (land/resource mgmt, US) |
| Operational Risk | High (Oil & gas production complexities) | Moderate (resource & water services) |
| Environmental Risk | Significant (natural gas extraction impacts) | Moderate (land and water management) |
| Geopolitical Risk | Moderate (US-focused operations) | Moderate (US-focused operations) |
EQT faces higher operational and environmental risks due to its extensive natural gas production activities. Texas Pacific Land benefits from negligible debt and strong financial health but carries moderate market risk due to higher beta. Both are exposed to regulatory shifts in the US energy sector, with EQT more vulnerable to market volatility and operational disruptions.
Which Stock to Choose?
EQT Corporation shows moderate income growth over five years with a 3% revenue increase in the last year but faces unfavorable profitability and financial ratios in 2024, including low ROE (1.12%) and high net debt to EBITDA (3.18), though it holds a very favorable overall rating of A-.
Texas Pacific Land Corporation demonstrates strong income growth with an 11.75% revenue increase last year and favorable profitability ratios in 2024, including a high ROE of 40.09% and a negative net debt to EBITDA indicating no debt, supported by a very favorable overall rating of A-.
For investors, TPL might appear more favorable for those prioritizing growth and strong profitability with a durable competitive moat, while EQT could be more relevant for those focused on companies with improving profitability trends despite some financial weaknesses; both carry different risk profiles aligned with distinct investment strategies.
Disclaimer: Investment carries a risk of loss of initial capital. The past performance is not a reliable indicator of future results. Be sure to understand risks before making an investment decision.
Go Further
I encourage you to read the complete analyses of EQT Corporation and Texas Pacific Land Corporation to enhance your investment decisions: