Investors seeking exposure to the energy sector often consider leaders in oil and gas exploration and production. Occidental Petroleum Corporation (OXY) and EQT Corporation (EQT) both operate within this industry, yet they differ in scale, resource focus, and innovation approaches. This comparison highlights their market strategies and financial profiles to help you identify which company may offer the most compelling investment opportunity in 2026. Let’s explore which stock deserves a place in your portfolio.
Table of contents
Companies Overview
I will begin the comparison between Occidental Petroleum Corporation and EQT Corporation by providing an overview of these two companies and their main differences.
Occidental Petroleum Corporation Overview
Occidental Petroleum Corporation, headquartered in Houston, Texas, engages in the acquisition, exploration, and development of oil and gas properties globally. Founded in 1920, OXY operates through three segments: Oil and Gas, Chemical, and Midstream and Marketing. It is a major player in the energy sector with a market cap of 42.2B USD, focusing on diverse products including oil, natural gas, and chemicals.
EQT Corporation Overview
EQT Corporation, based in Pittsburgh, Pennsylvania, specializes in natural gas production in the United States. Established in 1878, EQT holds significant proved reserves across roughly 2.0M gross acres, primarily in the Marcellus play. With a market cap of 31.9B USD, EQT concentrates on natural gas and natural gas liquids, positioning itself firmly within the energy industry.
Key similarities and differences
Both companies operate in the Oil & Gas Exploration & Production industry and trade on the NYSE. While Occidental has a broader product portfolio including chemicals and midstream operations, EQT focuses specifically on natural gas and related liquids. Occidental is considerably larger by market cap and employs more staff, whereas EQT has a more concentrated geographic reserve base in the U.S.
Income Statement Comparison
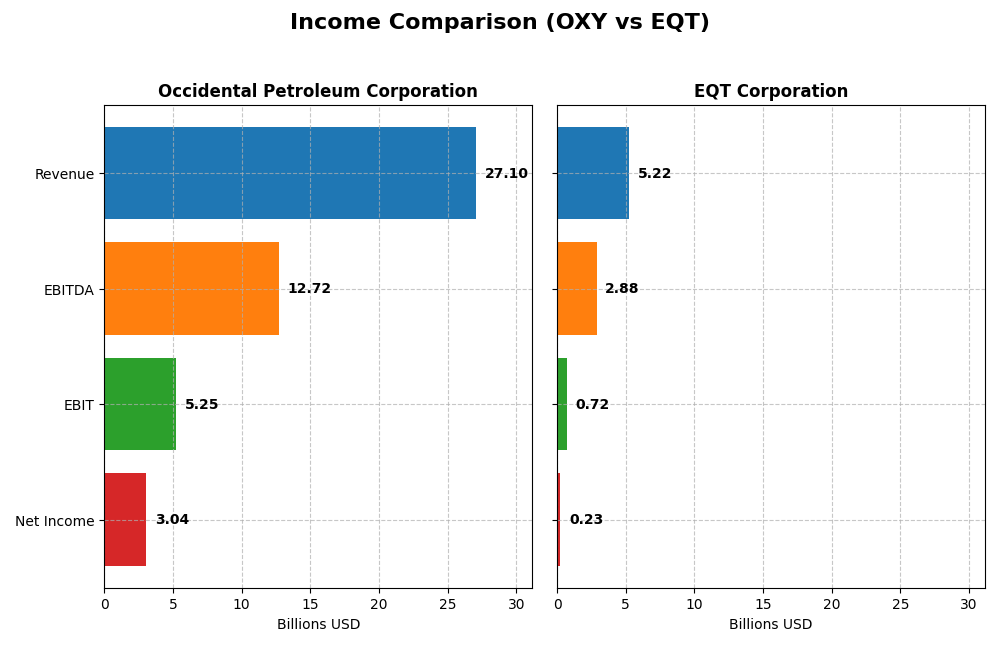
The table below presents a side-by-side comparison of key income statement metrics for Occidental Petroleum Corporation (OXY) and EQT Corporation (EQT) for the fiscal year 2024.
| Metric | Occidental Petroleum Corporation (OXY) | EQT Corporation (EQT) |
|---|---|---|
| Market Cap | 42.2B | 31.9B |
| Revenue | 27.1B | 5.2B |
| EBITDA | 12.7B | 2.9B |
| EBIT | 5.2B | 0.7B |
| Net Income | 3.0B | 0.2B |
| EPS | 2.59 | 0.45 |
| Fiscal Year | 2024 | 2024 |
Income Statement Interpretations
Occidental Petroleum Corporation
Occidental Petroleum’s revenue and net income showed strong growth over 2020–2024, with revenue increasing by 58.12% and net income by 120.52%. Margins remained favorable, with a gross margin of 35.61% and a net margin of 11.23%. However, the latest fiscal year saw a 4.35% revenue decline and a 31.92% drop in net margin, indicating recent softness in profitability.
EQT Corporation
EQT’s revenue nearly doubled over the period, growing 96.42%, with net income increasing by 124.05%. The company maintained a favorable EBIT margin of 13.77%, though gross and net margins were generally neutral. The most recent year showed a 3% revenue increase but declines in gross profit (-18.52%) and net margin (-87.1%), reflecting margin pressure despite top-line growth.
Which one has the stronger fundamentals?
Occidental exhibits a more consistent margin profile with favorable gross, EBIT, and net margins, despite recent declines in growth metrics. EQT shows higher overall revenue growth but mixed margin results and recent sharp margin contractions. Overall, Occidental’s income statement reflects stronger fundamentals, while EQT’s profile is more mixed with neutral income statement strength.
Financial Ratios Comparison
The table below presents the most recent key financial ratios for Occidental Petroleum Corporation (OXY) and EQT Corporation (EQT) as of fiscal year 2024, offering a clear comparison of their performance metrics.
| Ratios | Occidental Petroleum Corporation (OXY) | EQT Corporation (EQT) |
|---|---|---|
| ROE | 8.91% | 1.12% |
| ROIC | 5.48% | 1.66% |
| P/E | 14.81 | 101.91 |
| P/B | 1.32 | 1.14 |
| Current Ratio | 0.95 | 0.70 |
| Quick Ratio | 0.73 | 0.70 |
| D/E (Debt to Equity) | 0.79 | 0.45 |
| Debt-to-Assets | 31.72% | 23.51% |
| Interest Coverage | 5.08 | 1.51 |
| Asset Turnover | 0.32 | 0.13 |
| Fixed Asset Turnover | 0.39 | 0.16 |
| Payout Ratio | 47.52% | 141.64% |
| Dividend Yield | 3.21% | 1.39% |
Interpretation of the Ratios
Occidental Petroleum Corporation
Occidental Petroleum shows a mixed ratio profile with favorable net margin (11.23%) and valuation multiples (PE 14.81, PB 1.32), but weak liquidity ratios (current ratio 0.95) and asset turnover. Return on equity is low at 8.91%, indicating some operational challenges. The company pays dividends with a 3.21% yield, reflecting a stable shareholder return but necessitating caution on payout sustainability.
EQT Corporation
EQT’s financial ratios lean toward weakness, with low profitability metrics such as a 4.42% net margin and 1.12% ROE, and a high PE ratio of 101.91 signalling valuation concerns. Liquidity ratios are poor (current ratio 0.7), and interest coverage is limited. The dividend yield is modest at 1.39%, indicating limited income return, likely reflecting reinvestment priorities amid operational constraints.
Which one has the best ratios?
Occidental Petroleum exhibits a more balanced ratio set with stronger profitability and valuation metrics, albeit with liquidity concerns. EQT struggles with profitability and coverage ratios, plus a higher valuation multiple. Overall, Occidental presents a more favorable ratio profile, while EQT’s ratios raise more caution about operational and financial efficiency.
Strategic Positioning
This section compares the strategic positioning of Occidental Petroleum Corporation and EQT Corporation, including market position, key segments, and exposure to technological disruption:
Occidental Petroleum Corporation
- Large market cap of 42B with diversified segments facing moderate competitive pressure.
- Operates Oil & Gas, Chemical, Midstream segments with Oil & Gas driving majority revenue.
- Exposure to disruption not detailed; operates traditional energy segments including chemicals and midstream.
EQT Corporation
- Market cap of 32B, focused on natural gas, facing moderate competitive pressure.
- Primarily natural gas production with significant NGLs and oil sales, concentrated business.
- No explicit disruption mentioned; focused on natural gas production in Marcellus area.
Occidental Petroleum Corporation vs EQT Corporation Positioning
Occidental has a diversified business model spanning chemicals, midstream, and oil and gas, providing multiple revenue streams. EQT concentrates on natural gas production with a narrower focus, which may limit revenue diversification but could offer specialization benefits.
Which has the best competitive advantage?
Occidental shows a slightly favorable moat with growing profitability despite shedding value, indicating improving efficiency. EQT has a slightly unfavorable moat, also with growing profitability but currently destroying value, suggesting Occidental holds a modest competitive advantage based on MOAT evaluation.
Stock Comparison
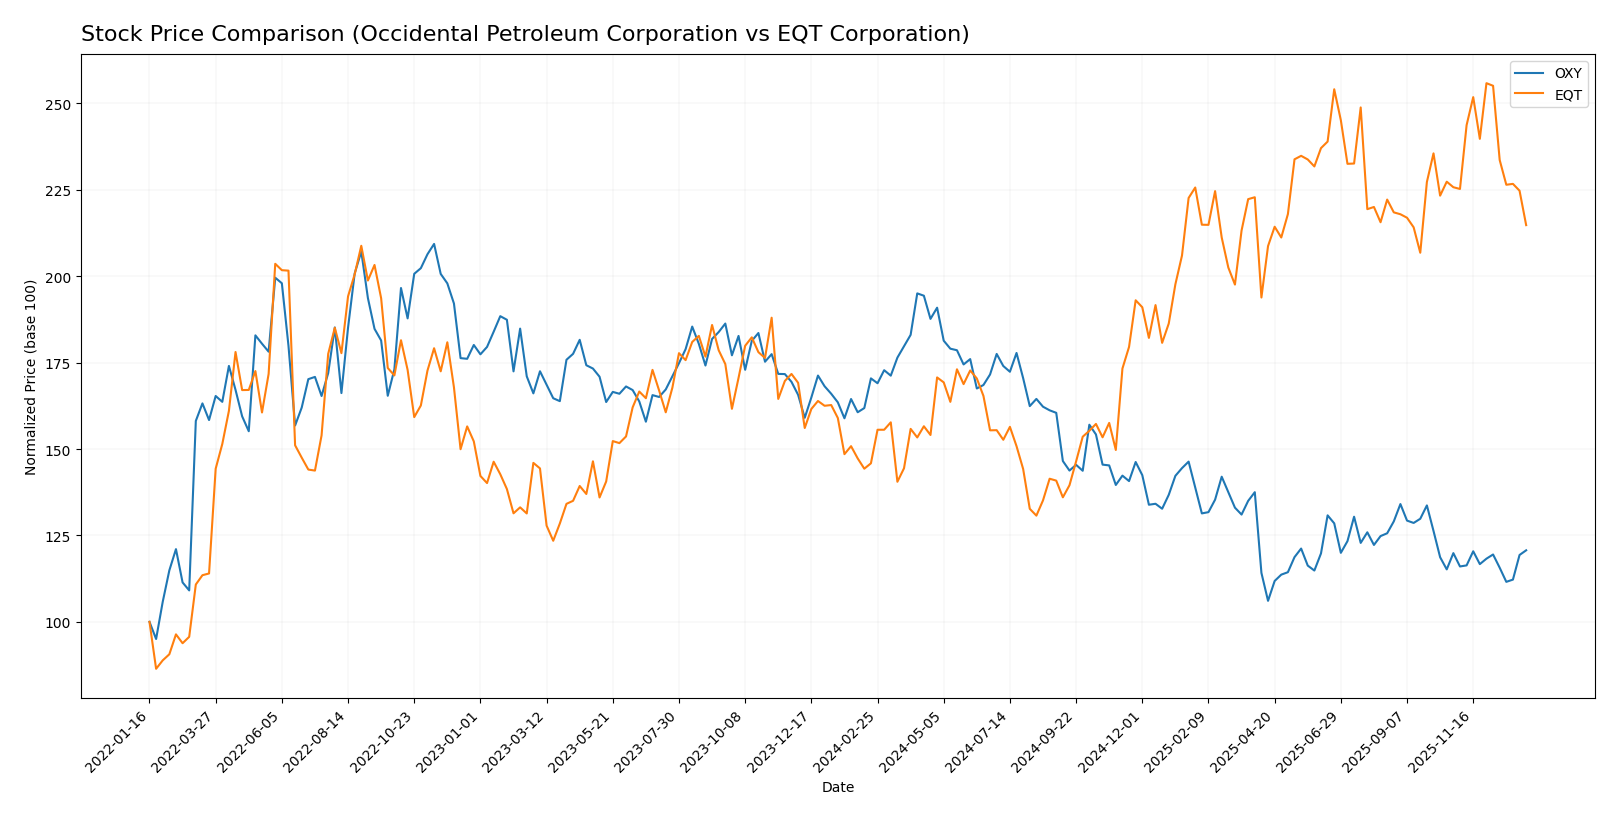
The stock prices of Occidental Petroleum Corporation (OXY) and EQT Corporation (EQT) have shown contrasting movements over the past 12 months, with OXY experiencing a significant decline while EQT delivered a notable gain, each reflecting distinct trading dynamics.
Trend Analysis
Occidental Petroleum Corporation’s stock exhibited a bearish trend over the past year, declining by 29.18%, with accelerating downward momentum, a high volatility level (8.33 std deviation), and a price range between 37.67 and 69.25.
EQT Corporation’s stock showed a bullish trend over the same period, rising 47.23%, though with decelerating gains and slightly higher volatility (8.62 std deviation), reaching between 31.1 and 60.86 in price.
Comparing the two, EQT’s stock outperformed Occidental Petroleum with a substantial positive return, while OXY experienced a sharper decline, indicating stronger market performance for EQT.
Target Prices
The current analyst target consensus for Occidental Petroleum Corporation and EQT Corporation reveals a cautiously optimistic outlook.
| Company | Target High | Target Low | Consensus |
|---|---|---|---|
| Occidental Petroleum Corporation | 64 | 38 | 49.36 |
| EQT Corporation | 55 | 23 | 41.11 |
Analysts set Occidental Petroleum’s consensus target about 15% above its current price of 42.86 USD, while EQT’s consensus target is roughly 20% below its current price of 51.09 USD, indicating mixed expectations.
Analyst Opinions Comparison
This section compares analysts’ ratings and grades for Occidental Petroleum Corporation (OXY) and EQT Corporation (EQT):
Rating Comparison
OXY Rating
- Rating: B+ indicating a very favorable status.
- Discounted Cash Flow Score: 5, very favorable.
- ROE Score: 3, moderate efficiency in profit generation.
- ROA Score: 4, favorable asset utilization.
- Debt To Equity Score: 1, very unfavorable, high financial risk.
- Overall Score: 3, moderate financial standing.
EQT Rating
- Rating: A- indicating a very favorable status.
- Discounted Cash Flow Score: 5, very favorable.
- ROE Score: 4, favorable efficiency in profit generation.
- ROA Score: 4, favorable asset utilization.
- Debt To Equity Score: 2, moderate financial risk.
- Overall Score: 4, favorable financial standing.
Which one is the best rated?
EQT holds a higher overall score (4 vs. 3) and better scores in ROE and debt to equity, reflecting stronger financial health. OXY’s low debt score lowers its overall rating despite favorable cash flow and asset utilization scores.
Scores Comparison
Here is a comparison of the Altman Z-Score and Piotroski Score for Occidental Petroleum Corporation and EQT Corporation:
OXY Scores
- Altman Z-Score: 1.39, in the distress zone indicating high bankruptcy risk.
- Piotroski Score: 5, indicating average financial strength.
EQT Scores
- Altman Z-Score: 2.01, in the grey zone indicating moderate bankruptcy risk.
- Piotroski Score: 8, indicating very strong financial health.
Which company has the best scores?
Based on the scores, EQT has a higher Altman Z-Score placing it in a safer grey zone versus OXY’s distress zone. EQT also shows markedly stronger financial health with a very strong Piotroski score compared to OXY’s average rating.
Grades Comparison
Here is the comparison of recent grades and ratings for Occidental Petroleum Corporation and EQT Corporation:
Occidental Petroleum Corporation Grades
The following table summarizes recent grades assigned by major grading companies to Occidental Petroleum Corporation:
| Grading Company | Action | New Grade | Date |
|---|---|---|---|
| UBS | Maintain | Neutral | 2025-12-12 |
| B of A Securities | Maintain | Neutral | 2025-12-11 |
| JP Morgan | Downgrade | Underweight | 2025-12-08 |
| Citigroup | Maintain | Neutral | 2025-11-19 |
| Piper Sandler | Maintain | Neutral | 2025-11-18 |
| Susquehanna | Maintain | Positive | 2025-11-13 |
| Wells Fargo | Maintain | Underweight | 2025-11-12 |
| Mizuho | Maintain | Outperform | 2025-11-11 |
| Piper Sandler | Maintain | Neutral | 2025-10-21 |
| Susquehanna | Maintain | Positive | 2025-10-20 |
Overall, Occidental Petroleum’s grades show a predominance of neutral ratings, with some divergence including underweight and outperform ratings, indicating mixed analyst sentiment.
EQT Corporation Grades
Below is a summary of recent grades assigned by reputable grading companies to EQT Corporation:
| Grading Company | Action | New Grade | Date |
|---|---|---|---|
| Bernstein | Maintain | Outperform | 2026-01-05 |
| Citigroup | Maintain | Buy | 2025-12-19 |
| Mizuho | Maintain | Outperform | 2025-12-12 |
| UBS | Maintain | Buy | 2025-12-12 |
| Scotiabank | Maintain | Sector Perform | 2025-11-21 |
| Piper Sandler | Maintain | Neutral | 2025-11-18 |
| Wells Fargo | Maintain | Overweight | 2025-10-23 |
| UBS | Maintain | Buy | 2025-10-17 |
| Scotiabank | Maintain | Sector Perform | 2025-10-09 |
| Barclays | Maintain | Overweight | 2025-10-07 |
EQT Corporation’s grades consistently trend toward positive ratings such as Buy, Outperform, and Overweight, reflecting stronger analyst confidence compared to Occidental Petroleum.
Which company has the best grades?
EQT Corporation has received notably better grades, with multiple Buy and Outperform ratings, whereas Occidental Petroleum’s grades mostly range from Neutral to Underweight. This contrast may influence investors by signaling higher analyst conviction in EQT’s growth prospects and relative strength.
Strengths and Weaknesses
Below is a comparison of key strengths and weaknesses for Occidental Petroleum Corporation (OXY) and EQT Corporation (EQT) based on recent financial and operational data.
| Criterion | Occidental Petroleum Corporation (OXY) | EQT Corporation (EQT) |
|---|---|---|
| Diversification | Strong diversification with significant revenue from Chemicals (4.92B), Midstream (1.65B), and Oil & Gas (21.7B) segments | Less diversified, primarily focused on Natural Gas and Oil Sales (4.93B oil in 2024) |
| Profitability | Net margin favorable at 11.23%, ROIC neutral at 5.48%, dividend yield 3.21% | Lower profitability with net margin 4.42%, ROIC unfavorable at 1.66%, dividend yield neutral at 1.39% |
| Innovation | Moderate innovation focus, improving ROIC trend (+340%), but overall value creation slightly favorable | Innovation limited, ROIC trend growing (+141%) but currently shedding value, slightly unfavorable moat |
| Global presence | Broad global operations in multiple energy sectors, supporting revenue stability | More regional focus on U.S. natural gas markets, limiting global exposure |
| Market Share | Large market share in chemicals and oil & gas sectors, supported by solid asset turnover | Smaller market share with lower asset turnover ratios, reflecting weaker efficiency |
Key takeaways: Occidental Petroleum shows better diversification, stronger profitability, and a slightly favorable economic moat with growing returns. EQT, while improving profitability trends, currently struggles with lower margins and value destruction, reflecting higher investment risk.
Risk Analysis
Below is a comparative table summarizing the key risk factors for Occidental Petroleum Corporation (OXY) and EQT Corporation (EQT) based on the most recent 2024 data:
| Metric | Occidental Petroleum Corporation (OXY) | EQT Corporation (EQT) |
|---|---|---|
| Market Risk | Low beta (0.38) indicates lower volatility | Moderate beta (0.68) suggests higher sensitivity to market swings |
| Debt level | Moderate debt-to-assets 31.7%, neutral leverage | Lower debt-to-assets 23.5%, favorable leverage ratio |
| Regulatory Risk | Medium, given global operations in US, Middle East, Africa | Medium, focused on US natural gas markets with environmental scrutiny |
| Operational Risk | Moderate, with diversified segments (oil, chemicals, midstream) | Moderate, focused on natural gas production and acreage in Marcellus |
| Environmental Risk | Elevated due to oil & gas exploration and chemical production | Elevated, natural gas extraction faces environmental and social pressures |
| Geopolitical Risk | Higher, operations in politically sensitive regions | Lower, primarily US-based operations reduce geopolitical exposure |
In synthesis, EQT shows stronger financial stability with lower debt and a very strong Piotroski score (8), but its profitability ratios are generally unfavorable, and it operates in a sector facing environmental scrutiny. Occidental has a better net margin and dividend yield but is in the distress zone for bankruptcy risk (Altman Z-score ~1.39) and faces higher geopolitical risks. Investors should weigh Occidental’s geopolitical and financial distress risks against EQT’s operational and profitability challenges when managing portfolio risk.
Which Stock to Choose?
Occidental Petroleum Corporation (OXY) shows a favorable global income statement with strong overall period growth, yet recent declines in revenue and profitability. Its financial ratios present a balanced view with some favorable metrics but also notable weaknesses, while its debt level is moderate and rating is very favorable.
EQT Corporation (EQT) exhibits a neutral income statement overall with moderate growth over time but significant recent setbacks in earnings. Its financial ratios are mostly unfavorable, though debt metrics are favorable, and it holds a very favorable rating supported by strong financial scores.
For investors prioritizing a solid income statement and balanced ratios, OXY might appear more favorable, while those valuing stronger financial scores and lower debt may find EQT appealing. The choice could depend on whether the investor is risk-averse or growth-focused, considering OXY’s improving profitability and EQT’s financial strength.
Disclaimer: Investment carries a risk of loss of initial capital. The past performance is not a reliable indicator of future results. Be sure to understand risks before making an investment decision.
Go Further
I encourage you to read the complete analyses of Occidental Petroleum Corporation and EQT Corporation to enhance your investment decisions: