In the dynamic world of energy, EQT Corporation and Expand Energy Corporation stand out as key players in oil and gas exploration and production. Both companies focus on natural gas assets in major U.S. shale regions, sharing similar industry challenges and innovation strategies. This analysis will help investors navigate their strengths and risks to identify which company offers the most compelling investment opportunity in 2026.
Table of contents
Companies Overview
I will begin the comparison between EQT Corporation and Expand Energy Corporation by providing an overview of these two companies and their main differences.
EQT Corporation Overview
EQT Corporation is a U.S.-based natural gas production company with a long history dating back to 1878. It operates primarily in the Oil & Gas Exploration & Production industry, with a strong focus on natural gas and natural gas liquids including ethane, propane, and butane. EQT holds substantial proved reserves of 25.0T cubic feet across about 2.0M gross acres, mainly in the Marcellus play, positioning itself as a key player in the energy sector.
Expand Energy Corporation Overview
Expand Energy Corporation, formerly Chesapeake Energy until 2024, is an independent oil and natural gas exploration and production company operating in the U.S. It focuses on acquiring and developing unconventional natural gas assets, including interests in approximately 5,000 wells primarily in the Marcellus Shale and Haynesville/Bossier Shales. Founded in 1989 and headquartered in Oklahoma City, Expand Energy holds a portfolio of onshore natural gas resources and emphasizes exploration and development.
Key similarities and differences
Both EQT and Expand Energy operate in the U.S. Oil & Gas Exploration & Production sector with a focus on natural gas and natural gas liquids. EQT is more established with larger proved reserves and acreage, while Expand Energy has a broader well portfolio and a more recent rebranding. EQT’s operations are concentrated mainly in the Marcellus region, whereas Expand Energy covers multiple shale plays. The companies differ in size, history, and specific asset focus, but both emphasize unconventional natural gas production.
Income Statement Comparison
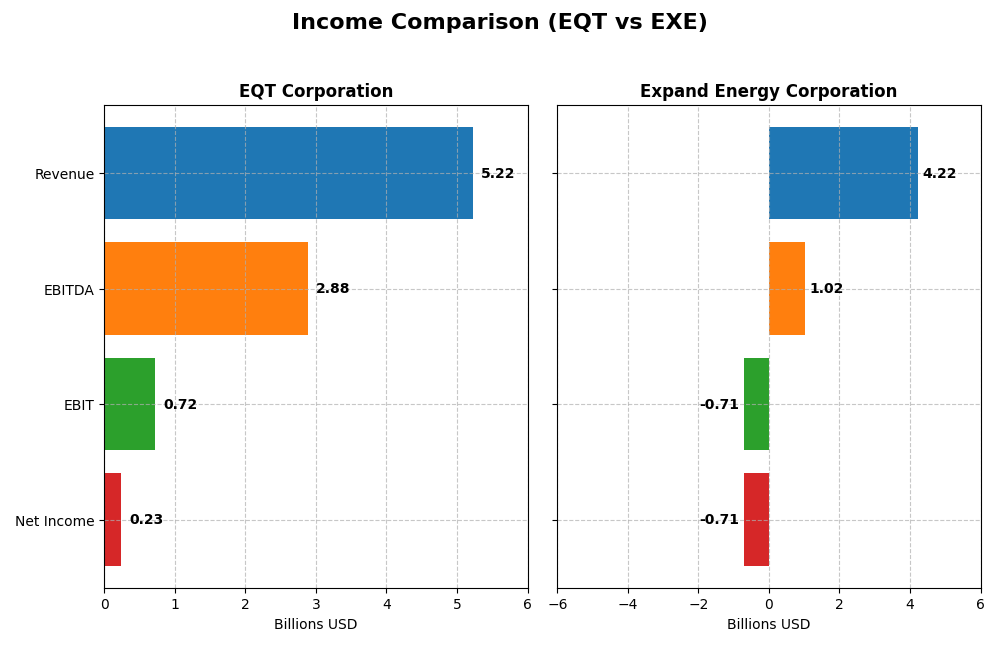
The following table compares the key income statement metrics for EQT Corporation and Expand Energy Corporation for the fiscal year 2024.
| Metric | EQT Corporation | Expand Energy Corporation |
|---|---|---|
| Market Cap | 31.9B | 24.2B |
| Revenue | 5.22B | 4.22B |
| EBITDA | 2.88B | 1.02B |
| EBIT | 719M | -711M |
| Net Income | 231M | -714M |
| EPS | 0.45 | -4.55 |
| Fiscal Year | 2024 | 2024 |
Income Statement Interpretations
EQT Corporation
EQT Corporation’s revenue nearly doubled from 2020 to 2024, showing a favorable long-term growth trend, while net income also rose significantly over the period. Gross margin remained neutral around 14.7%, but EBIT margin was favorable at 13.8%. In 2024, revenue growth slowed to 3%, and key profitability metrics, including gross profit and net margin, declined, indicating margin pressure despite stable top-line expansion.
Expand Energy Corporation
Expand Energy Corporation experienced a revenue decline of nearly 19% over the 2020–2024 period, with a sharp 46% drop in revenue in 2024 alone. Gross margin was favorable at 27%, but EBIT and net margins remained negative, reflecting operational challenges. The most recent fiscal year saw significant earnings deterioration with steep declines in gross profit, EBIT, and net income, highlighting increased losses and margin contraction.
Which one has the stronger fundamentals?
EQT displays stronger fundamentals with consistent revenue and net income growth over five years, supported by a positive EBIT margin and stable interest expenses. In contrast, Expand Energy’s fundamentals appear weaker due to declining revenues, persistent negative EBIT and net margins, and unfavorable recent year performance. EQT’s neutral overall income statement evaluation contrasts with Expand Energy’s unfavorable outlook, indicating relatively better financial health for EQT.
Financial Ratios Comparison
The table below presents a side-by-side comparison of the latest financial ratios for EQT Corporation and Expand Energy Corporation, reflecting their fiscal year 2024 performance.
| Ratios | EQT Corporation (2024) | Expand Energy Corporation (2024) |
|---|---|---|
| ROE | 1.12% | -4.06% |
| ROIC | 1.66% | -2.70% |
| P/E | 101.91 | -21.89 |
| P/B | 1.14 | 0.89 |
| Current Ratio | 0.70 | 0.64 |
| Quick Ratio | 0.70 | 0.64 |
| D/E | 0.45 | 0.33 |
| Debt-to-Assets | 23.51% | 20.88% |
| Interest Coverage | 1.51 | -6.53 |
| Asset Turnover | 0.13 | 0.15 |
| Fixed Asset Turnover | 0.16 | 0.17 |
| Payout ratio | 142% | -54% |
| Dividend yield | 1.39% | 2.48% |
Interpretation of the Ratios
EQT Corporation
EQT shows several unfavorable ratios in 2024, including low net margin at 4.42%, weak ROE of 1.12%, and low asset turnover at 0.13. Its current ratio of 0.7 indicates liquidity concerns, while debt levels remain moderate and favorable. Dividend yield stands at a neutral 1.39%, reflecting steady payouts, but coverage by free cash flow appears strained, suggesting caution over sustainability.
Expand Energy Corporation
Expand Energy’s 2024 ratios reveal challenges with a negative net margin of -16.92% and negative returns on equity and invested capital. Liquidity ratios are weak at 0.64, and interest coverage is notably negative, highlighting financial stress. The company pays dividends with a favorable yield of 2.48%, but its negative earnings raise concerns about long-term payout sustainability and cash flow support.
Which one has the best ratios?
Both companies have predominantly unfavorable financial ratios in 2024, reflecting operational and profitability challenges. EQT displays lower profitability but better coverage of liabilities and dividends, while Expand Energy suffers larger losses and liquidity issues despite a higher dividend yield. Overall, neither presents a clearly superior ratio profile, warranting careful consideration of the risks involved.
Strategic Positioning
This section compares the strategic positioning of EQT and EXE, focusing on Market position, Key segments, and Exposure to technological disruption:
EQT
- Leading natural gas producer in the US with 25T cubic feet of reserves, moderate pressure
- Key segments include natural gas, NGLs (ethane, propane, butane), and oil production
- No explicit mention of technological disruption exposure
EXE
- Independent producer focused on Marcellus and Haynesville Shales with a portfolio of 5,000 wells
- Diverse segments: exploration, production, gathering, transportation, marketing, processing
- No explicit mention of technological disruption exposure
EQT vs EXE Positioning
EQT has a concentrated focus on natural gas and NGLs production with large reserves, while EXE operates a more diversified business including marketing and gathering services. EQT’s scale in reserves contrasts with EXE’s broader operational scope and asset base.
Which has the best competitive advantage?
Both EQT and EXE show slightly unfavorable economic moats, shedding value but with growing profitability trends. Neither company currently demonstrates a strong competitive advantage based on ROIC vs WACC analysis.
Stock Comparison
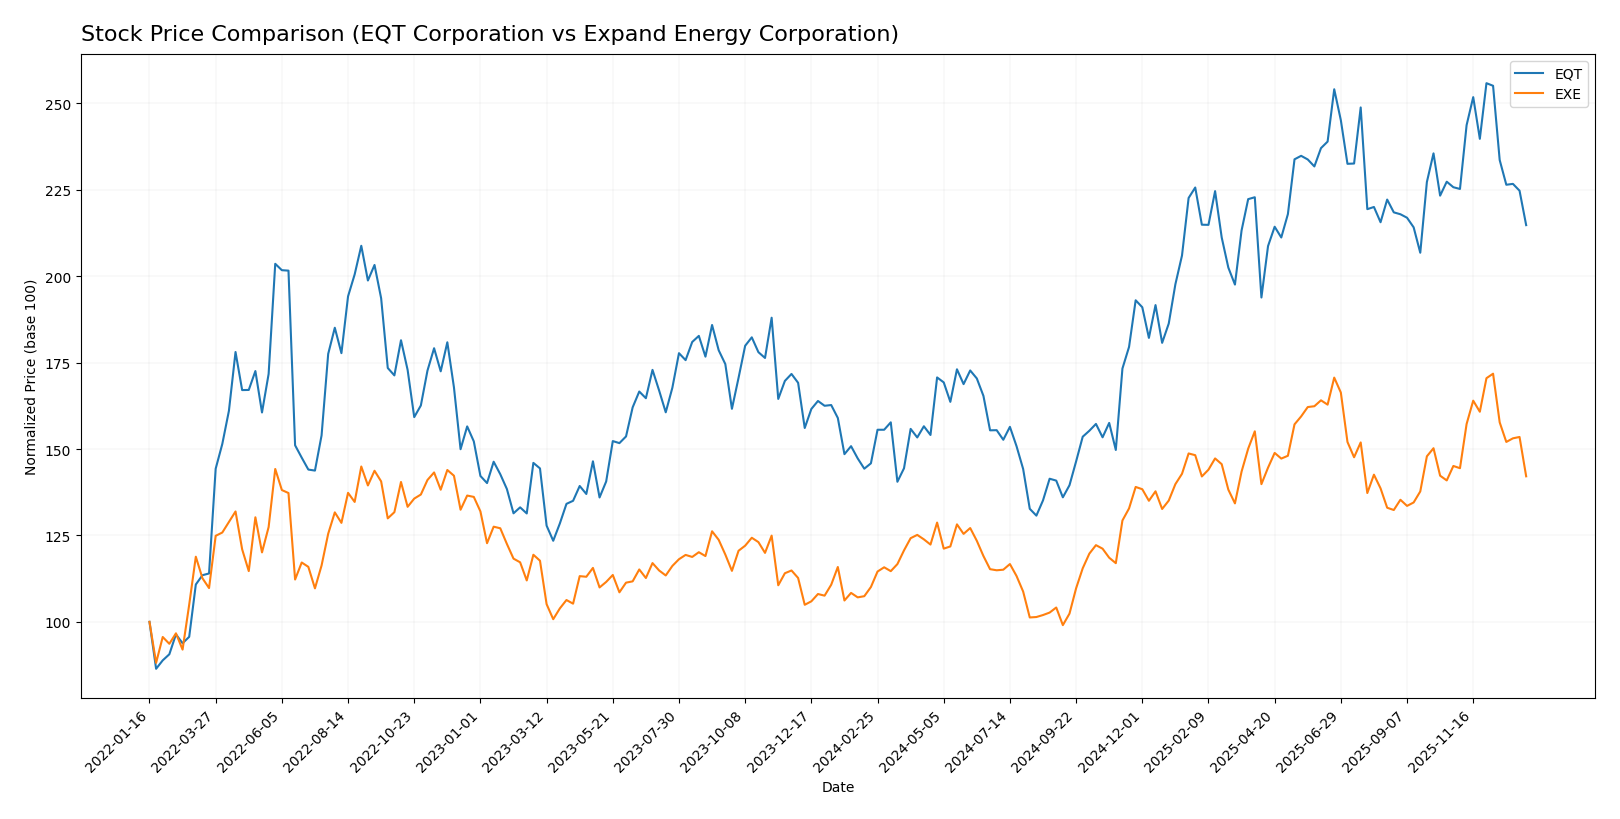
The stock prices of EQT Corporation and Expand Energy Corporation have shown significant bullish momentum over the past 12 months, with both experiencing decelerating gains and distinct trading volume dynamics amid recent mild declines.
Trend Analysis
EQT Corporation’s stock increased by 47.23% over the past year, indicating a bullish trend with deceleration in price gains. The price ranged from a low of 31.1 to a high of 60.86, with recent weeks showing a slight downward trend of -4.86%.
Expand Energy Corporation’s stock rose 29.09% over the same period, also displaying a bullish trend with decelerating momentum. Price volatility was higher, ranging between 70.84 and 122.86, with a minor recent decline of -2.06%.
Comparing the two, EQT Corporation outperformed Expand Energy Corporation with a higher overall price increase of 47.23% versus 29.09%, despite both experiencing recent short-term corrections.
Target Prices
Analysts present a clear consensus on target prices for EQT Corporation and Expand Energy Corporation.
| Company | Target High | Target Low | Consensus |
|---|---|---|---|
| EQT Corporation | 55 | 23 | 41.11 |
| Expand Energy Corporation | 150 | 125 | 140.63 |
The target consensus for EQT at 41.11 is below its current price of 51.09, suggesting a cautious outlook. Conversely, Expand Energy’s consensus target of 140.63 significantly exceeds its current 101.63 price, indicating optimistic analyst expectations.
Analyst Opinions Comparison
This section compares analysts’ ratings and grades for EQT Corporation and Expand Energy Corporation:
Rating Comparison
EQT Rating
- Rating: A- indicating a very favorable overall evaluation.
- Discounted Cash Flow Score: 5, reflecting a very favorable valuation outlook.
- ROE Score: 4, showing favorable profit generation from shareholders’ equity.
- ROA Score: 4, indicating favorable asset utilization to generate earnings.
- Debt To Equity Score: 2, suggesting moderate financial risk.
- Overall Score: 4, considered favorable for overall financial standing.
EXE Rating
- Rating: B indicating a very favorable overall evaluation.
- Discounted Cash Flow Score: 4, reflecting a favorable valuation outlook.
- ROE Score: 3, showing a moderate level of profit generation efficiency.
- ROA Score: 4, indicating favorable asset utilization to generate earnings.
- Debt To Equity Score: 2, suggesting moderate financial risk.
- Overall Score: 3, considered moderate for overall financial standing.
Which one is the best rated?
Based strictly on provided data, EQT holds a better rating (A-) and overall score (4) compared to EXE’s rating (B) and overall score (3). EQT also scores higher on discounted cash flow and return on equity metrics.
Scores Comparison
Here is a comparison of the Altman Z-Score and Piotroski Score for both companies:
EQT Scores
- Altman Z-Score: 2.01, indicating moderate risk in the grey zone.
- Piotroski Score: 8, reflecting very strong financial health.
EXE Scores
- Altman Z-Score: 2.43, indicating moderate risk in the grey zone.
- Piotroski Score: 6, reflecting average financial strength.
Which company has the best scores?
EQT shows a stronger Piotroski Score of 8 compared to EXE’s 6, indicating better financial health. Both companies have Altman Z-Scores in the grey zone, with EXE slightly higher at 2.43 versus EQT’s 2.01.
Grades Comparison
Here is the detailed grades comparison for EQT Corporation and Expand Energy Corporation:
EQT Corporation Grades
The following table summarizes recent grades assigned to EQT Corporation by reputable grading companies.
| Grading Company | Action | New Grade | Date |
|---|---|---|---|
| Bernstein | Maintain | Outperform | 2026-01-05 |
| Citigroup | Maintain | Buy | 2025-12-19 |
| Mizuho | Maintain | Outperform | 2025-12-12 |
| UBS | Maintain | Buy | 2025-12-12 |
| Scotiabank | Maintain | Sector Perform | 2025-11-21 |
| Piper Sandler | Maintain | Neutral | 2025-11-18 |
| Wells Fargo | Maintain | Overweight | 2025-10-23 |
| UBS | Maintain | Buy | 2025-10-17 |
| Scotiabank | Maintain | Sector Perform | 2025-10-09 |
| Barclays | Maintain | Overweight | 2025-10-07 |
EQT Corporation’s grades predominantly indicate a buy or outperform stance, with consistent maintenance of positive outlooks across multiple firms.
Expand Energy Corporation Grades
Below is a summary of recent grades assigned to Expand Energy Corporation by established grading companies.
| Grading Company | Action | New Grade | Date |
|---|---|---|---|
| UBS | Maintain | Buy | 2026-01-08 |
| Jefferies | Maintain | Buy | 2026-01-08 |
| Bernstein | Maintain | Outperform | 2026-01-05 |
| Citigroup | Maintain | Buy | 2025-12-19 |
| Mizuho | Maintain | Outperform | 2025-12-12 |
| UBS | Maintain | Buy | 2025-12-12 |
| Piper Sandler | Maintain | Overweight | 2025-11-18 |
| Morgan Stanley | Maintain | Overweight | 2025-10-30 |
| UBS | Maintain | Buy | 2025-10-30 |
| Morgan Stanley | Maintain | Overweight | 2025-10-14 |
Expand Energy Corporation shows a strong pattern of buy and outperform ratings, consistently maintained by several major grading firms.
Which company has the best grades?
Both EQT Corporation and Expand Energy Corporation have received predominantly positive grades, with strong buy and outperform ratings. EQT has a higher number of buy ratings overall, while Expand Energy shows slightly more overweight and outperform evaluations, suggesting strong confidence from analysts in both cases. This could indicate favorable investor sentiment but requires further risk assessment for portfolio decisions.
Strengths and Weaknesses
Below is a comparison of the key strengths and weaknesses of EQT Corporation and Expand Energy Corporation based on the most recent data available.
| Criterion | EQT Corporation | Expand Energy Corporation |
|---|---|---|
| Diversification | Limited product range, mainly natural gas and oil sales; moderate diversification within energy sector | More diversified within oil and gas segments, including gathering, transportation, and marketing |
| Profitability | Low profitability with ROIC at 1.66%, net margin 4.42%, but improving ROIC trend | Negative profitability with ROIC at -2.7%, net margin -16.92%, yet showing improving ROIC trend |
| Innovation | Moderate innovation; focus on operational efficiency rather than technology leadership | Moderate innovation, leveraging integrated services in energy value chain |
| Global presence | Primarily focused on U.S. market, limited global footprint | Also primarily U.S.-focused, with some regional diversification |
| Market Share | Significant player in natural gas production, but facing value destruction | Growing market presence in oil and gas gathering and processing, but currently shedding value |
Key takeaways: Both EQT and Expand Energy are currently shedding value with unfavorable profitability metrics, despite showing improving ROIC trends. EQT is more concentrated in natural gas, while Expand Energy offers a broader service mix, but both face challenges in diversification and profitability. Caution is advised when considering investment, emphasizing risk management.
Risk Analysis
Below is a comparative risk assessment table for EQT Corporation and Expand Energy Corporation based on the most recent 2024 data:
| Metric | EQT Corporation | Expand Energy Corporation |
|---|---|---|
| Market Risk | Moderate (beta 0.68) | Lower (beta 0.45) |
| Debt Level | Moderate (D/E 0.45) | Moderate (D/E 0.33) |
| Regulatory Risk | High (Energy sector rules) | High (Energy sector rules) |
| Operational Risk | Moderate (low asset turnover) | Moderate (low asset turnover) |
| Environmental Risk | Significant (natural gas production) | Significant (unconventional gas assets) |
| Geopolitical Risk | Moderate (US-focused) | Moderate (US-focused) |
The most likely and impactful risks for both companies stem from regulatory and environmental factors due to their roles in natural gas exploration and production. EQT faces moderate market risk with a higher beta than Expand Energy, while both have manageable debt but show operational efficiency challenges. Investors should watch regulatory shifts and environmental policies closely as these could materially affect profitability.
Which Stock to Choose?
EQT Corporation shows mixed income evolution with recent declines but long-term growth, unfavorable profitability ratios including a low ROE of 1.12%, and moderate debt levels with a favorable debt-to-equity ratio of 0.45. Its rating is very favorable (A-).
Expand Energy Corporation exhibits unfavorable income trends with significant recent declines, negative profitability metrics such as ROE at -4.06%, but maintains lower debt levels and a very favorable rating (B). Its financial ratios remain largely unfavorable.
For investors, EQT’s slightly unfavorable moat but growing profitability and very favorable rating might appeal to those seeking quality and stability, while EXE’s moderate rating and higher risk profile could be of interest to more risk-tolerant or value-focused investors given its lower debt and potential for recovery.
Disclaimer: Investment carries a risk of loss of initial capital. The past performance is not a reliable indicator of future results. Be sure to understand risks before making an investment decision.
Go Further
I encourage you to read the complete analyses of EQT Corporation and Expand Energy Corporation to enhance your investment decisions: