Home > Comparison > Technology > WIT vs EPAM
The strategic rivalry between Wipro Limited and EPAM Systems, Inc. shapes the evolution of the global technology sector. Wipro operates as a capital-intensive IT services conglomerate with a broad portfolio including consulting and government services. EPAM specializes in high-margin digital engineering and software development, emphasizing innovation and automation. This head-to-head reflects a contrast between scale-driven diversification and specialized technological agility. This analysis aims to identify which trajectory delivers superior risk-adjusted returns for a balanced portfolio.
Table of contents
Companies Overview
Wipro Limited and EPAM Systems, Inc. stand as major players in the global IT services sector, shaping industry innovation and client solutions.
Wipro Limited: Global IT Services Powerhouse
Wipro Limited leads as a diversified IT services provider, generating revenue through IT consulting, digital strategy, and business process services. Its portfolio spans IT products and government enterprise services, emphasizing a broad global reach. In 2026, Wipro strategically focuses on expanding cloud, analytics, and digital transformation offerings to serve multiple industries worldwide.
EPAM Systems, Inc.: Digital Engineering Specialist
EPAM Systems specializes in digital platform engineering and software development, driving revenue from custom software solutions, infrastructure management, and automation services. Its strategy in 2026 centers on enhancing integrated engineering practices and AI-driven innovations to bolster client digital transformation across financial services, healthcare, and tech sectors.
Strategic Collision: Similarities & Divergences
Both companies excel in technology services but diverge in approach: Wipro embraces a broad IT ecosystem, while EPAM hones in on specialized digital engineering. Their primary battleground is the digital transformation space, competing for enterprise clients seeking modernization. Investors face distinct profiles—Wipro offers scale and diversification, EPAM delivers focused innovation and higher volatility.
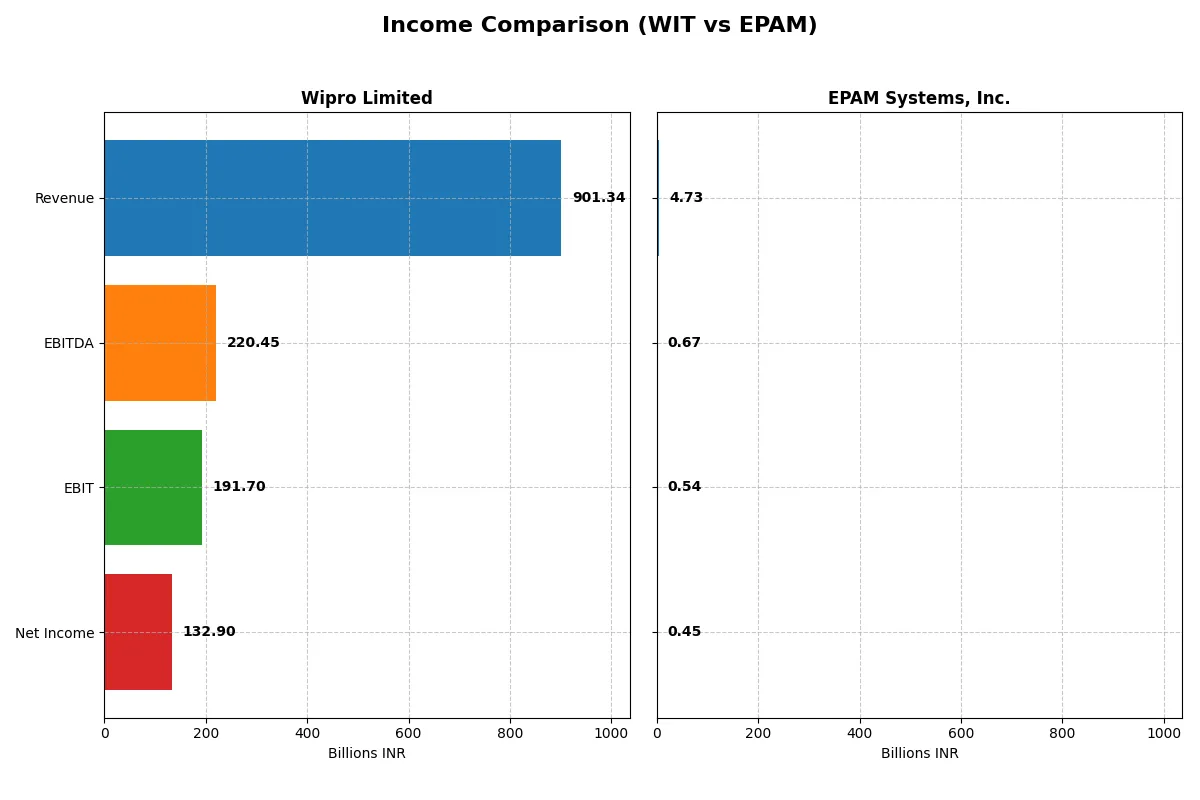
Income Statement Comparison
The following data dissects the core profitability and scalability of both corporate engines to reveal who dominates the bottom line:
| Metric | Wipro Limited (WIT) | EPAM Systems, Inc. (EPAM) |
|---|---|---|
| Revenue | 901.3B INR | 4.73B USD |
| Cost of Revenue | 625.1B INR | 3.28B USD |
| Operating Expenses | 122.7B INR | 906M USD |
| Gross Profit | 276.3B INR | 1.45B USD |
| EBITDA | 220.5B INR | 672M USD |
| EBIT | 191.7B INR | 545M USD |
| Interest Expense | 14.9B INR | 0 |
| Net Income | 132.9B INR | 455M USD |
| EPS | 12.56 INR | 7.93 USD |
| Fiscal Year | 2025 | 2024 |
Income Statement Analysis: The Bottom-Line Duel
This comparison exposes each company’s operational efficiency and profitability, revealing which business model drives superior financial performance.
Wipro Limited Analysis
Wipro’s revenue slightly dipped by 0.24% to 901B INR in 2025, yet net income surged 19.6% to 133B INR, reflecting improved cost control. Its gross margin holds steady at 30.65%, while the net margin expanded to 14.74%, signaling enhanced bottom-line efficiency and robust earnings momentum despite flat top-line growth.
EPAM Systems, Inc. Analysis
EPAM posted modest revenue growth of 0.8% to 4.73B USD in 2024, with net income rising 8.9% to 455M USD. The gross margin remains stable at 30.68%, but the net margin lags at 9.61%, indicating greater expense pressure. Earnings per share improved 11%, showing steady profitability gains amid slower top-line expansion.
Margin Strength vs. Earnings Leverage
Wipro delivers stronger net margins and faster bottom-line growth despite marginal revenue decline, outperforming EPAM’s leaner profit conversion. Wipro’s efficiency advantage makes it the fundamental winner in this comparison. Investors seeking margin resilience and earnings leverage find Wipro’s profile more compelling.
Financial Ratios Comparison
These vital ratios act as a diagnostic tool to expose the underlying fiscal health, valuation premiums, and capital efficiency of the companies analyzed:
| Ratios | Wipro Limited (WIT) | EPAM Systems, Inc. (EPAM) |
|---|---|---|
| ROE | 16.0% | 12.5% |
| ROIC | 10.5% | 10.7% |
| P/E | 20.6x | 29.5x |
| P/B | 3.30x | 3.69x |
| Current Ratio | 2.72 | 2.96 |
| Quick Ratio | 2.71 | 2.96 |
| D/E | 0.23 | 0.04 |
| Debt-to-Assets | 15.0% | 3.4% |
| Interest Coverage | 10.3x | N/A |
| Asset Turnover | 0.70 | 1.00 |
| Fixed Asset Turnover | 8.48 | 14.07 |
| Payout ratio | 47.2% | 0% |
| Dividend yield | 2.29% | 0% |
| Fiscal Year | 2025 | 2024 |
Efficiency & Valuation Duel: The Vital Signs
Financial ratios act as the company’s DNA, revealing hidden risks and operational excellence critical for investment decisions.
Wipro Limited
Wipro delivers solid profitability with a 16.04% ROE and a favorable 14.74% net margin. Its P/E ratio at 20.6 signals a fairly valued stock, while a 3.3 P/B ratio appears stretched. Wipro supports shareholders with a 2.29% dividend yield, reflecting healthy cash returns amid disciplined capital allocation.
EPAM Systems, Inc.
EPAM posts a modest 12.52% ROE and a neutral 9.61% net margin, indicating moderate profitability. The stock trades expensive at a 29.47 P/E and a 3.69 P/B, signaling valuation risk. EPAM pays no dividend, reinvesting heavily in growth and R&D, which pressures near-term shareholder returns.
Premium Valuation vs. Operational Safety
Wipro offers a balanced profile with strong profitability and shareholder dividends despite a slightly stretched book value. EPAM’s premium valuation contrasts with weaker returns and no cash payouts. Investors seeking operational safety and income may prefer Wipro, while growth-focused profiles might tolerate EPAM’s higher risk.
Which one offers the Superior Shareholder Reward?
I see Wipro Limited (WIT) pays a modest 2.3% dividend yield with a 47% payout ratio, backed by strong free cash flow coverage (2.18x). It also executes steady buybacks, supporting shareholder returns. EPAM Systems (EPAM) pays no dividends but allocates robust free cash flow to aggressive buybacks, fueling growth. Historically, WIT’s balanced dividends plus buybacks offer income and capital stability. EPAM’s reinvestment-heavy model suits growth investors but carries valuation premium risks. For 2026, I favor Wipro’s sustainable income-plus-growth approach, delivering a more attractive total return profile amid market uncertainty.
Comparative Score Analysis: The Strategic Profile
The radar chart reveals the fundamental DNA and trade-offs of Wipro Limited and EPAM Systems, highlighting their financial strengths and valuation nuances:
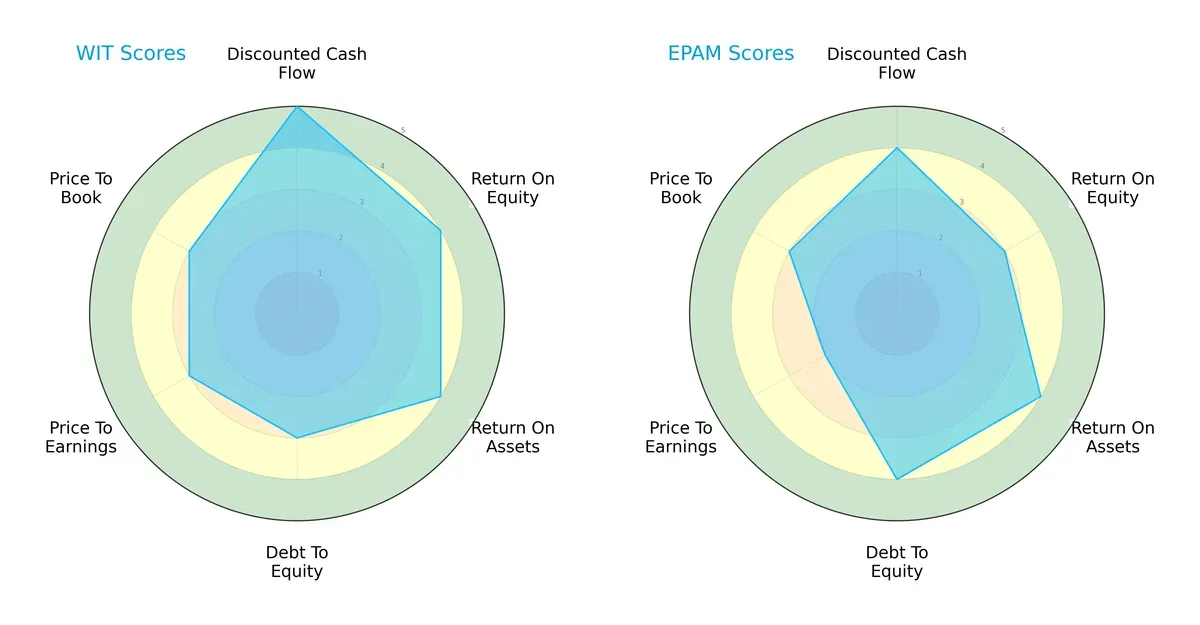
Wipro shows strength in discounted cash flow (5) and profitability metrics with ROE and ROA scores of 4 each, but its moderate debt and valuation scores (3) suggest some leverage and pricing caution. EPAM offers a more balanced risk profile with stronger debt management (score 4) but lags in ROE (3) and valuation (P/E at 2), indicating reliance on asset efficiency rather than equity returns. Overall, Wipro leans on cash flow and profitability, while EPAM emphasizes financial stability and asset use.
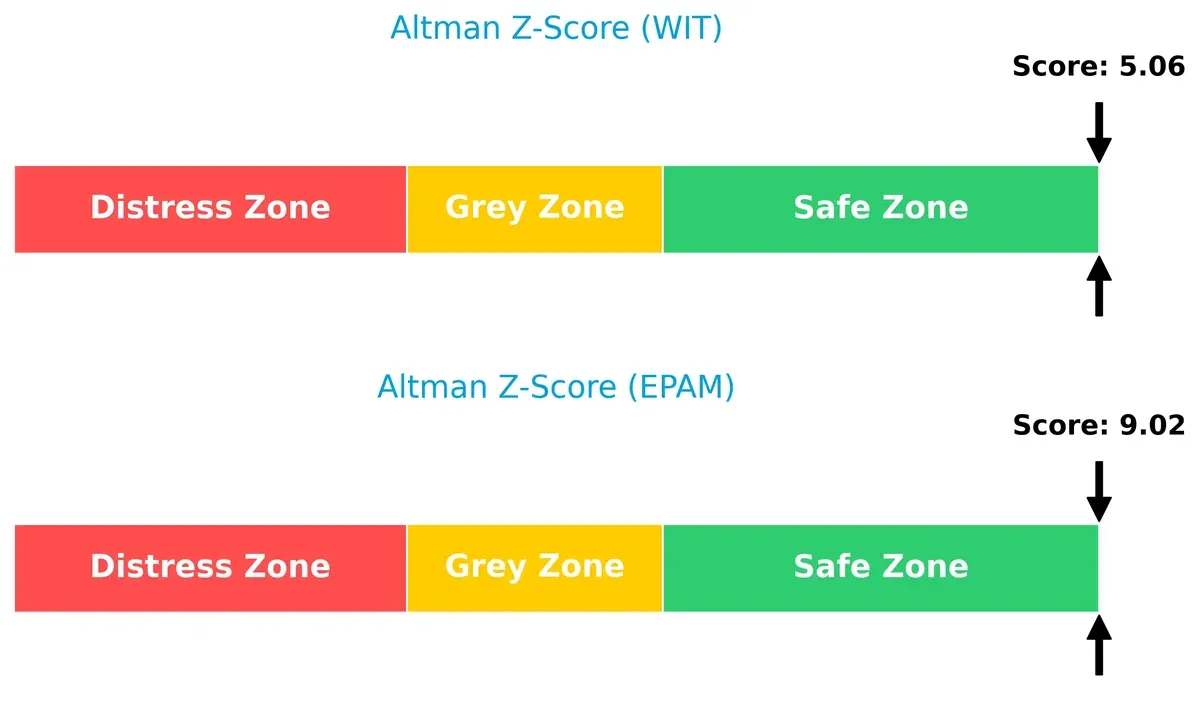
Bankruptcy Risk: Solvency Showdown
Wipro’s Altman Z-Score of 5.06 versus EPAM’s 9.02 indicates both firms reside well within the safe zone, but EPAM’s higher score signals superior long-term solvency and lower bankruptcy risk in this cycle:
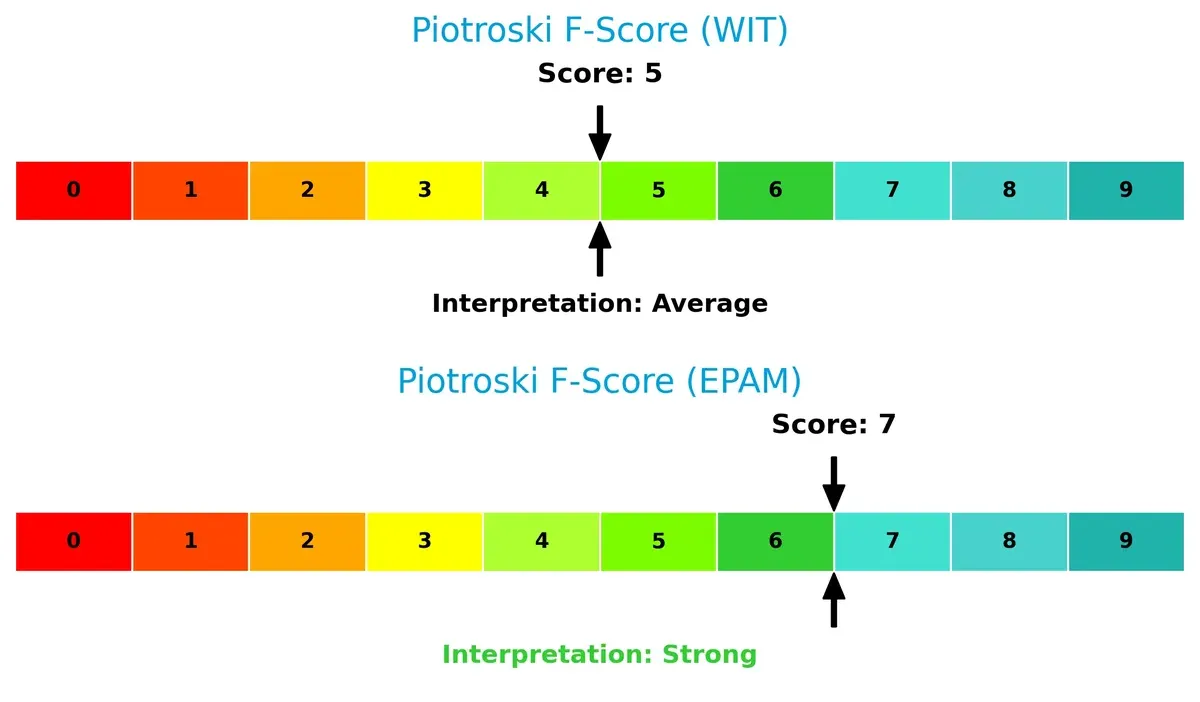
Financial Health: Quality of Operations
EPAM’s Piotroski F-Score of 7 outclasses Wipro’s 5, highlighting EPAM’s stronger internal financial health and operational quality. Wipro’s average score suggests some red flags in profitability or efficiency metrics compared to EPAM’s robust standing:
How are the two companies positioned?
This section dissects Wipro and EPAM’s operational DNA by comparing revenue distribution and internal dynamics. The goal is to confront their economic moats and identify which model offers the most resilient competitive advantage today.
Revenue Segmentation: The Strategic Mix
This visual comparison dissects how both firms diversify their income streams and where their primary sector bets lie:
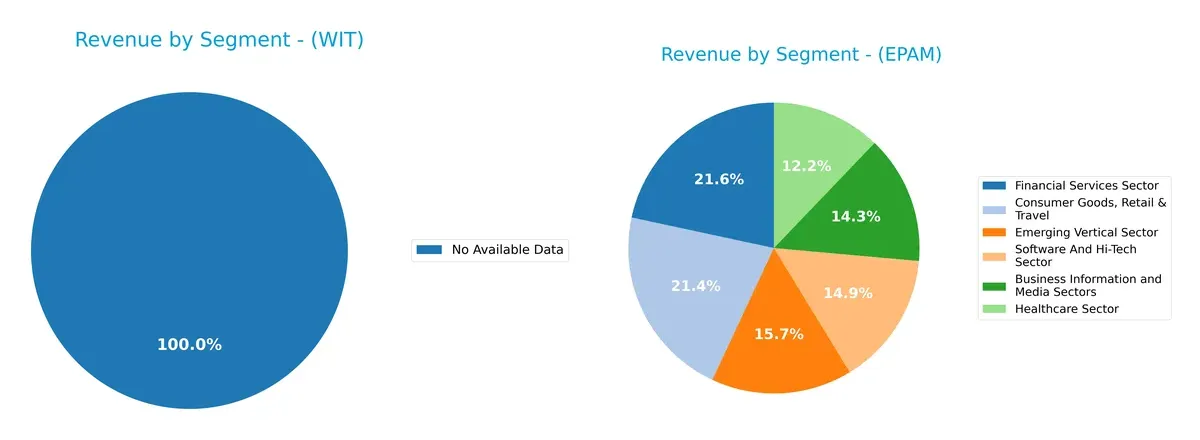
Wipro Limited lacks available segmentation data, so I cannot analyze its revenue mix. EPAM Systems exhibits a well-diversified portfolio, with no single segment dominating. Consumer Goods, Retail & Travel leads at $1.01B, closely followed by Financial Services at $1.02B and Software & Hi-Tech at $702M. This balanced approach reduces concentration risk and highlights EPAM’s strategic pivot to multiple growth verticals, strengthening its ecosystem lock-in and resilience against sector downturns.
Strengths and Weaknesses Comparison
This table compares the Strengths and Weaknesses of Wipro Limited and EPAM Systems, Inc.:
Wipro Limited Strengths
- Strong profitability with a 14.74% net margin and 16.04% ROE
- Favorable capital efficiency, ROIC 10.49% above WACC 6.38%
- Solid liquidity, current and quick ratios above 2.7
- Low leverage with debt-to-assets at 14.93% and strong interest coverage
- Robust fixed asset turnover of 8.48
- Consistent dividend yield of 2.29%
EPAM Systems, Inc. Strengths
- Diversified revenue streams across six business sectors, including Financial Services and Software
- Strong global presence with significant sales in the US, UK, and Europe
- Favorable liquidity with current and quick ratios near 3.0
- Very low leverage, debt-to-assets at 3.44%, and infinite interest coverage
- High fixed asset turnover at 14.07
- Neutral asset turnover at 1.0
Wipro Limited Weaknesses
- Price-to-book ratio at 3.3 is unfavorable, indicating possible overvaluation
- Price-to-earnings ratio neutral at 20.6, limiting growth expectations
- Asset turnover at 0.7 is neutral, suggesting moderate efficiency
- No explicit revenue diversification data available
EPAM Systems, Inc. Weaknesses
- ROIC of 10.67% is below WACC of 11.82%, signaling capital inefficiency
- Higher valuation metrics, P/E 29.47 and P/B 3.69, both unfavorable
- No dividend yield, missing income for shareholders
- Net margin and ROE only neutral at 9.61% and 12.52%
- Revenue concentration in a few sectors and geographic regions
Overall, Wipro demonstrates strong profitability and financial stability, supporting a conservative capital allocation strategy. EPAM shows broad sector and geographic diversification but faces challenges in capital efficiency and valuation. These factors highlight differing strategic focuses in growth and risk management.
The Moat Duel: Analyzing Competitive Defensibility
A structural moat is the only true shield protecting long-term profits from competition’s relentless erosion. Let’s dissect how these two firms defend their turf:
Wipro Limited: Cost Advantage with Scale and Diversification
Wipro’s moat springs from its vast scale and diversified service portfolio. I see this in its stable 21% EBIT margin and positive ROIC spread over WACC by 4.1%. However, its declining ROIC trend signals margin pressure ahead in 2026 amid rising competition.
EPAM Systems, Inc.: Innovation-Driven Network Effects
EPAM’s moat centers on its digital engineering expertise and client integration, unlike Wipro’s cost focus. Despite a solid 31% revenue growth over five years, EPAM’s ROIC falls below WACC, indicating value destruction. Its innovation pipeline holds promise but faces margin headwinds in 2026.
Verdict: Scale-Driven Cost Efficiency vs. Innovation’s Profitability Challenge
Wipro commands a wider moat through cost advantage and value creation, while EPAM’s innovation moat is narrower and financially strained. I believe Wipro is better positioned to defend market share amid intensifying industry competition.
Which stock offers better returns?
Over the past 12 months, both stocks showed significant price declines, with contrasting recent trading dynamics highlighting diverging momentum.
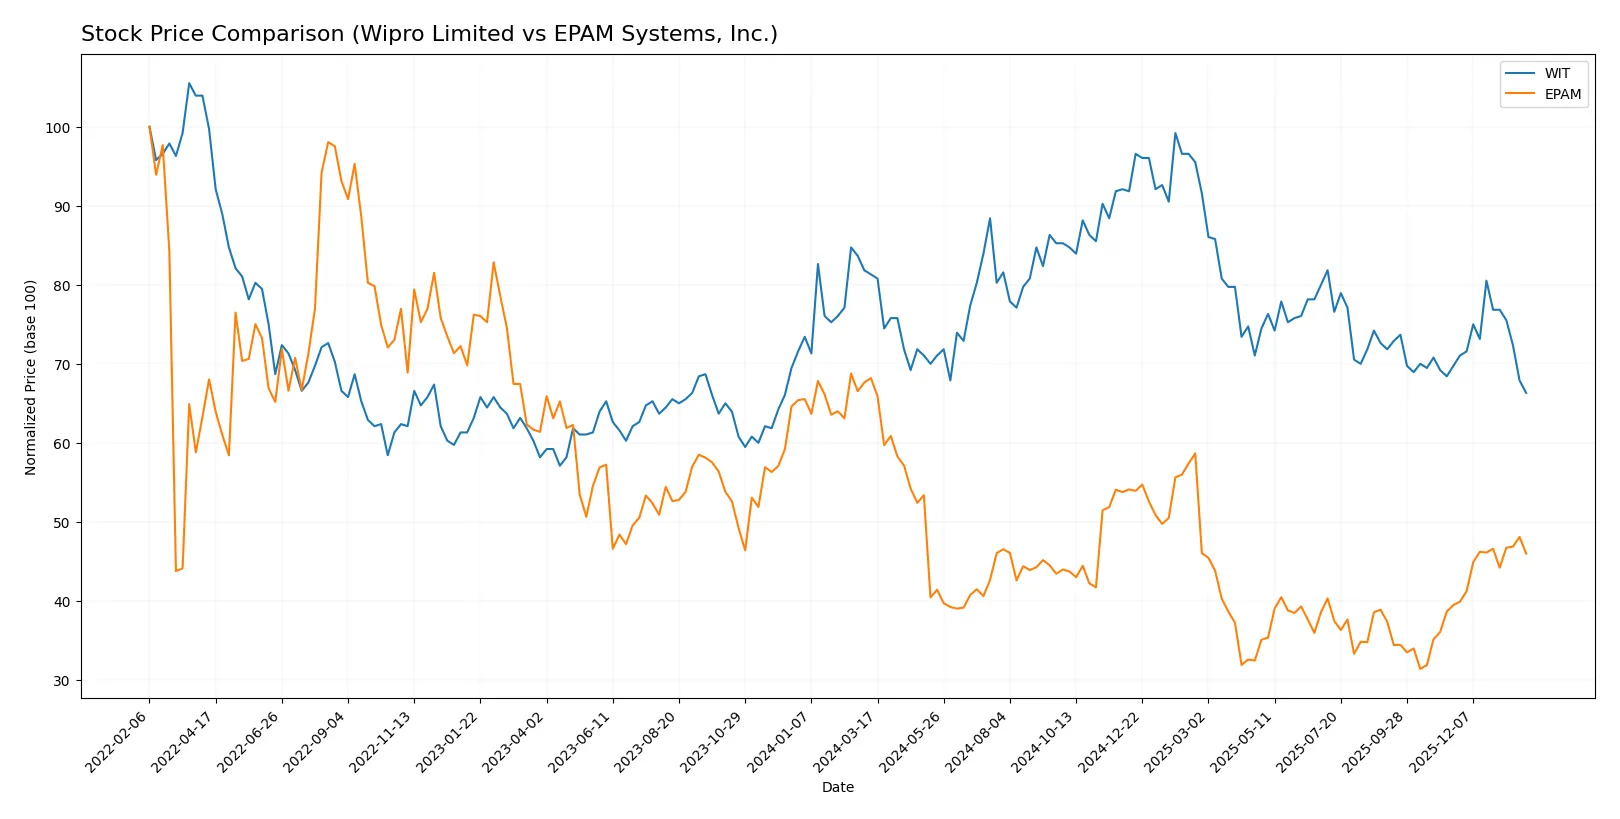
Trend Comparison
Wipro Limited’s stock declined 18.45% over the past year, signaling a bearish trend with decelerating losses and a moderate volatility of 0.31. Its recent trend remains negative, dropping 4.91%.
EPAM Systems, Inc. fell 32.58% over the year, confirming a bearish trend with accelerating declines and high volatility of 36.08. Recently, it gained 16.52%, showing strong bullish momentum.
EPAM’s recent rebound outperforms Wipro’s sustained decline, delivering the highest market performance in the latest period despite a worse annual loss.
Target Prices
Analysts show a bullish consensus for both Wipro Limited and EPAM Systems, reflecting confidence in their growth prospects.
| Company | Target Low | Target High | Consensus |
|---|---|---|---|
| Wipro Limited | 7.0 | 7.7 | 7.35 |
| EPAM Systems, Inc. | 175 | 247 | 214 |
Wipro’s target consensus at 7.35 vastly exceeds its current price of 2.52, suggesting significant upside potential. EPAM’s consensus target of 214 is modestly above its current 208.6 price, indicating steady growth expectations.

Don’t Let Luck Decide Your Entry Point
Optimize your entry points with our advanced ProRealTime indicators. You’ll get efficient buy signals with precise price targets for maximum performance. Start outperforming now!
How do institutions grade them?
Wipro Limited Grades
Here are the recent institutional grades for Wipro Limited:
| Grading Company | Action | New Grade | Date |
|---|---|---|---|
| UBS | Upgrade | Neutral | 2025-01-02 |
| Wedbush | Maintain | Underperform | 2024-01-16 |
| JP Morgan | Maintain | Underweight | 2023-05-24 |
| Bernstein | Downgrade | Underperform | 2023-03-22 |
| Bernstein | Downgrade | Underperform | 2023-03-21 |
| Goldman Sachs | Upgrade | Buy | 2022-09-13 |
| Goldman Sachs | Upgrade | Buy | 2022-09-12 |
| Morgan Stanley | Downgrade | Underweight | 2022-07-14 |
| Morgan Stanley | Downgrade | Underweight | 2022-07-13 |
| Macquarie | Upgrade | Outperform | 2022-06-02 |
EPAM Systems, Inc. Grades
Here are the recent institutional grades for EPAM Systems, Inc.:
| Grading Company | Action | New Grade | Date |
|---|---|---|---|
| Citigroup | Maintain | Neutral | 2026-01-29 |
| Wells Fargo | Maintain | Overweight | 2026-01-14 |
| TD Cowen | Maintain | Buy | 2026-01-09 |
| Mizuho | Maintain | Outperform | 2025-11-11 |
| JP Morgan | Maintain | Overweight | 2025-11-07 |
| Morgan Stanley | Maintain | Equal Weight | 2025-09-09 |
| JP Morgan | Maintain | Overweight | 2025-08-20 |
| Barclays | Maintain | Overweight | 2025-05-12 |
| Needham | Maintain | Buy | 2025-05-09 |
| Piper Sandler | Maintain | Neutral | 2025-05-09 |
Which company has the best grades?
EPAM Systems consistently receives positive grades like Buy, Overweight, and Outperform. Wipro’s ratings are mixed, with recent Neutral and Underperform grades. EPAM’s stronger grades may indicate better market confidence, potentially influencing investor sentiment favorably.
Risks specific to each company
In 2026, both Wipro Limited and EPAM Systems face critical pressure points and systemic threats across seven key risk categories:
1. Market & Competition
Wipro Limited
- Faces intense competition in India’s IT services sector with strong local and global players.
EPAM Systems, Inc.
- Competes globally in digital engineering with higher exposure to tech innovation and changing client demands.
2. Capital Structure & Debt
Wipro Limited
- Maintains conservative debt levels (D/E 0.23) with strong interest coverage (12.83).
EPAM Systems, Inc.
- Very low debt (D/E 0.04) and infinite interest coverage, signaling low financial risk.
3. Stock Volatility
Wipro Limited
- Low beta (0.555) suggests stable price movements relative to market.
EPAM Systems, Inc.
- High beta (1.727) implies elevated volatility and sensitivity to market swings.
4. Regulatory & Legal
Wipro Limited
- Exposed to India’s evolving IT regulations and government contracting risks.
EPAM Systems, Inc.
- Faces complex US and international compliance, especially data privacy and export controls.
5. Supply Chain & Operations
Wipro Limited
- Relies heavily on India-based talent and infrastructure, vulnerable to local disruptions.
EPAM Systems, Inc.
- Operates globally with diversified delivery centers, reducing operational risk.
6. ESG & Climate Transition
Wipro Limited
- Increasing pressure to improve ESG rating amid domestic sustainability reforms.
EPAM Systems, Inc.
- Strong focus on sustainability in tech solutions but faces scrutiny over global footprint.
7. Geopolitical Exposure
Wipro Limited
- Primarily exposed to India’s geopolitical stability and regional tensions.
EPAM Systems, Inc.
- Sensitive to US-China tensions and global trade policy shifts affecting tech exports.
Which company shows a better risk-adjusted profile?
Wipro’s most impactful risk lies in intense domestic competition and regulatory shifts in India. EPAM’s greatest risk is its high stock volatility amid global geopolitical uncertainties. Despite higher market risk, EPAM’s low debt and strong financial health offer resilience. Overall, Wipro provides a steadier risk-adjusted profile, backed by very favorable financial ratios and stable stock behavior. EPAM’s elevated volatility warrants caution despite its robust operational diversification. This contrast highlights Wipro’s defensive strength in a turbulent IT landscape versus EPAM’s growth-driven but riskier positioning.
Final Verdict: Which stock to choose?
Wipro Limited’s superpower lies in its robust capital efficiency and consistent value creation, demonstrated by an ROIC comfortably above its WACC. Its strong liquidity and moderate leverage support stability. A point of vigilance is its slightly declining profitability trend, which could pressure margins. This stock fits well in portfolios focused on steady, value-driven growth with moderate risk tolerance.
EPAM Systems commands a strategic moat through its agile service model and strong balance sheet, featuring minimal debt and solid liquidity. However, it currently struggles to convert capital into superior returns, as indicated by its ROIC falling below WACC. Relative to Wipro, EPAM offers a safer balance sheet but less capital efficiency. It suits investors seeking GARP—growth tempered with financial prudence.
If you prioritize capital efficiency and proven value creation, Wipro outshines due to its favorable ROIC versus WACC and consistent profitability. However, if you seek balance sheet strength with growth potential and can tolerate slower capital returns, EPAM offers better stability and a cleaner financial structure. Each presents a distinct analytical scenario depending on your risk appetite and investment horizon.
Disclaimer: Investment carries a risk of loss of initial capital. The past performance is not a reliable indicator of future results. Be sure to understand risks before making an investment decision.
Go Further
I encourage you to read the complete analyses of Wipro Limited and EPAM Systems, Inc. to enhance your investment decisions: