In the rapidly evolving technology sector, EPAM Systems, Inc. and UiPath Inc. stand out as key innovators driving digital transformation. EPAM excels in digital platform engineering and software development services, while UiPath leads in robotic process automation software. Both target industries demanding efficiency and innovation, making their comparison essential. This article will help investors identify which company aligns best with their portfolio goals in 2026.
Table of contents
Companies Overview
I will begin the comparison between EPAM Systems, Inc. and UiPath Inc. by providing an overview of these two companies and their main differences.
EPAM Overview
EPAM Systems, Inc. is a global provider of digital platform engineering and software development services. Founded in 1993 and headquartered in Newtown, Pennsylvania, EPAM offers a broad range of engineering, infrastructure management, and consulting services. It serves diverse industries including financial services, healthcare, and media, positioning itself as a comprehensive technology partner with 61,200 employees and a market cap of 11.1B USD.
UiPath Overview
UiPath Inc. specializes in robotic process automation (RPA) with an end-to-end platform combining AI, automation, and low-code development tools. Established in 2005 and based in New York City, UiPath primarily serves banking, healthcare, financial services, and government sectors. The company employs 3,868 people and has a market capitalization of 8.5B USD, focusing on software infrastructure to streamline enterprise automation.
Key similarities and differences
Both EPAM and UiPath operate within the technology sector, focusing on software solutions that enhance business operations through automation and digital services. EPAM offers wide-ranging engineering and consulting services across multiple industries, while UiPath concentrates specifically on RPA platforms integrating AI and low-code tools. EPAM is significantly larger in workforce and market cap, reflecting its broader scope compared to UiPath’s specialized software infrastructure focus.
Income Statement Comparison
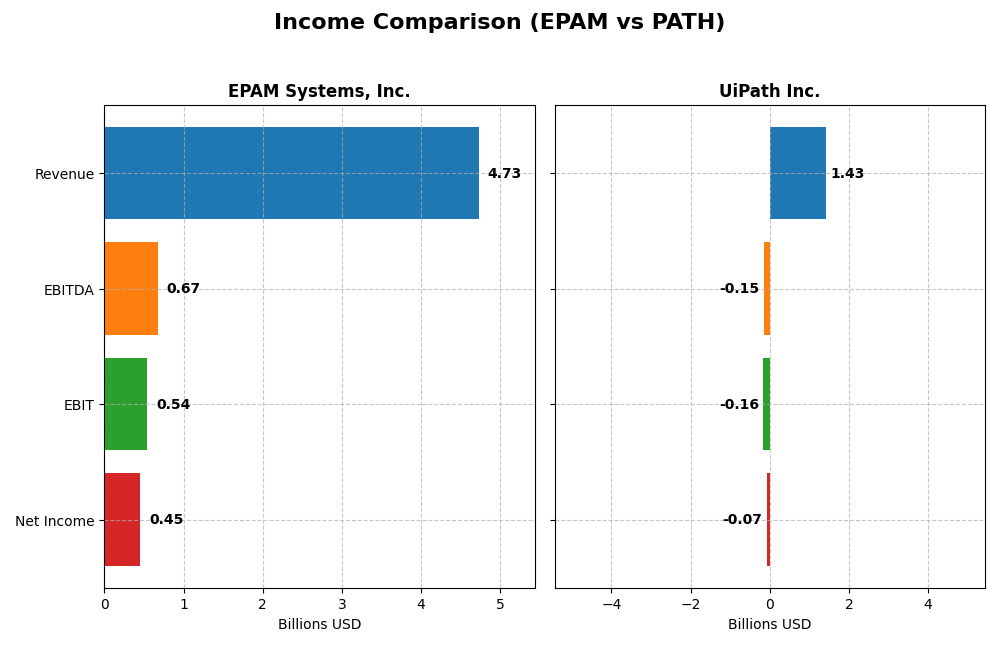
The table below compares key income statement metrics for EPAM Systems, Inc. and UiPath Inc. based on their most recent fiscal year results.
| Metric | EPAM Systems, Inc. | UiPath Inc. |
|---|---|---|
| Market Cap | 11.1B | 8.5B |
| Revenue | 4.73B | 1.43B |
| EBITDA | 672M | -145M |
| EBIT | 545M | -163M |
| Net Income | 455M | -74M |
| EPS | 7.93 | -0.13 |
| Fiscal Year | 2024 | 2025 |
Income Statement Interpretations
EPAM Systems, Inc.
EPAM’s revenue saw a strong overall growth of 78% from 2020 to 2024, while net income rose by nearly 39%. Margins remained stable with a gross margin of 30.7% and net margin of 9.6% in 2024. The latest year showed slowed revenue growth at 0.8% but improved net margin and EPS growth, reflecting operational efficiency gains.
UiPath Inc.
UiPath experienced robust revenue growth of 135% over 2021-2025 and a 20% increase in net income. Despite a high gross margin of 82.7%, the company reported negative EBIT and net margins in 2025, though both improved year-over-year. The latest year also showed favorable increases in revenue, gross profit, net margin, and EPS, indicating progress toward profitability.
Which one has the stronger fundamentals?
Both companies demonstrate favorable long-term revenue and net income growth with mostly positive margin trends. EPAM’s stable positive margins and consistent profitability contrast with UiPath’s high gross margin but ongoing operating losses. UiPath’s more rapid growth and improving margins suggest potential, while EPAM offers steadier income statement fundamentals.
Financial Ratios Comparison
The following table presents a side-by-side comparison of key financial ratios for EPAM Systems, Inc. and UiPath Inc., based on their most recent fiscal year data.
| Ratios | EPAM Systems, Inc. (2024) | UiPath Inc. (2025) |
|---|---|---|
| ROE | 12.5% | -4.0% |
| ROIC | 10.7% | -7.4% |
| P/E | 29.5 | -108.0 |
| P/B | 3.69 | 4.31 |
| Current Ratio | 2.96 | 2.93 |
| Quick Ratio | 2.96 | 2.93 |
| D/E | 0.045 | 0.042 |
| Debt-to-Assets | 3.4% | 2.7% |
| Interest Coverage | 0 | 0 |
| Asset Turnover | 1.00 | 0.50 |
| Fixed Asset Turnover | 14.1 | 14.4 |
| Payout Ratio | 0% | 0% |
| Dividend Yield | 0% | 0% |
Interpretation of the Ratios
EPAM Systems, Inc.
EPAM shows a balanced financial profile with favorable liquidity ratios (current and quick ratio around 2.96) and low leverage (debt-to-equity 0.04), indicating solid short-term and solvency positions. However, valuation multiples such as PE (29.47) and PB (3.69) are unfavorable, and returns on invested capital (10.67%) lag behind the WACC (11.89%), raising concerns about capital efficiency. EPAM does not pay dividends, reflecting a focus on reinvestment and growth rather than shareholder distributions.
UiPath Inc.
UiPath’s ratios depict challenges with negative profitability metrics: net margin at -5.15%, ROE at -3.99%, and ROIC at -7.41%, all unfavorable, signaling ongoing losses and operational inefficiencies. Liquidity (current and quick ratio near 2.93) and low debt levels are favorable, but interest coverage is zero, indicating difficulty in covering interest expenses. UiPath also does not pay dividends, consistent with its high-growth strategy and reinvestment priorities amid negative earnings.
Which one has the best ratios?
Comparing both companies, EPAM’s ratios are slightly more favorable, supported by positive returns and strong liquidity, despite some valuation and capital efficiency concerns. UiPath faces more unfavorable profitability and coverage metrics, reflecting higher operational risks. Overall, EPAM presents a moderately stronger financial ratio profile than UiPath based on the latest evaluations.
Strategic Positioning
This section compares the strategic positioning of EPAM Systems, Inc. and UiPath Inc., focusing on market position, key segments, and exposure to technological disruption:
EPAM
- Established IT services provider facing high competitive pressure in digital engineering.
- Diversified revenue across financial services, consumer goods, healthcare, software, and emerging sectors.
- Exposure through digital platform engineering and smart automation with AI, robotics, and virtual reality.
PATH
- Software infrastructure firm with notable competition in robotic process automation.
- Concentrated revenue mainly from license, subscription, and professional services in automation.
- Exposure via AI-driven automation platform combining AI with low-code and process mining tools.
EPAM vs PATH Positioning
EPAM pursues a diversified strategy with multiple industry verticals, offering broad engineering services. PATH focuses on a concentrated niche in automation software, emphasizing AI and RPA platform innovation. EPAM’s breadth contrasts with PATH’s specialization, each presenting distinct strategic advantages and risks.
Which has the best competitive advantage?
Both companies are currently shedding value compared to their cost of capital. EPAM faces declining profitability, while PATH shows improving ROIC trends despite negative spread. PATH’s growing ROIC suggests a slightly more favorable position to strengthen its competitive advantage over time.
Stock Comparison
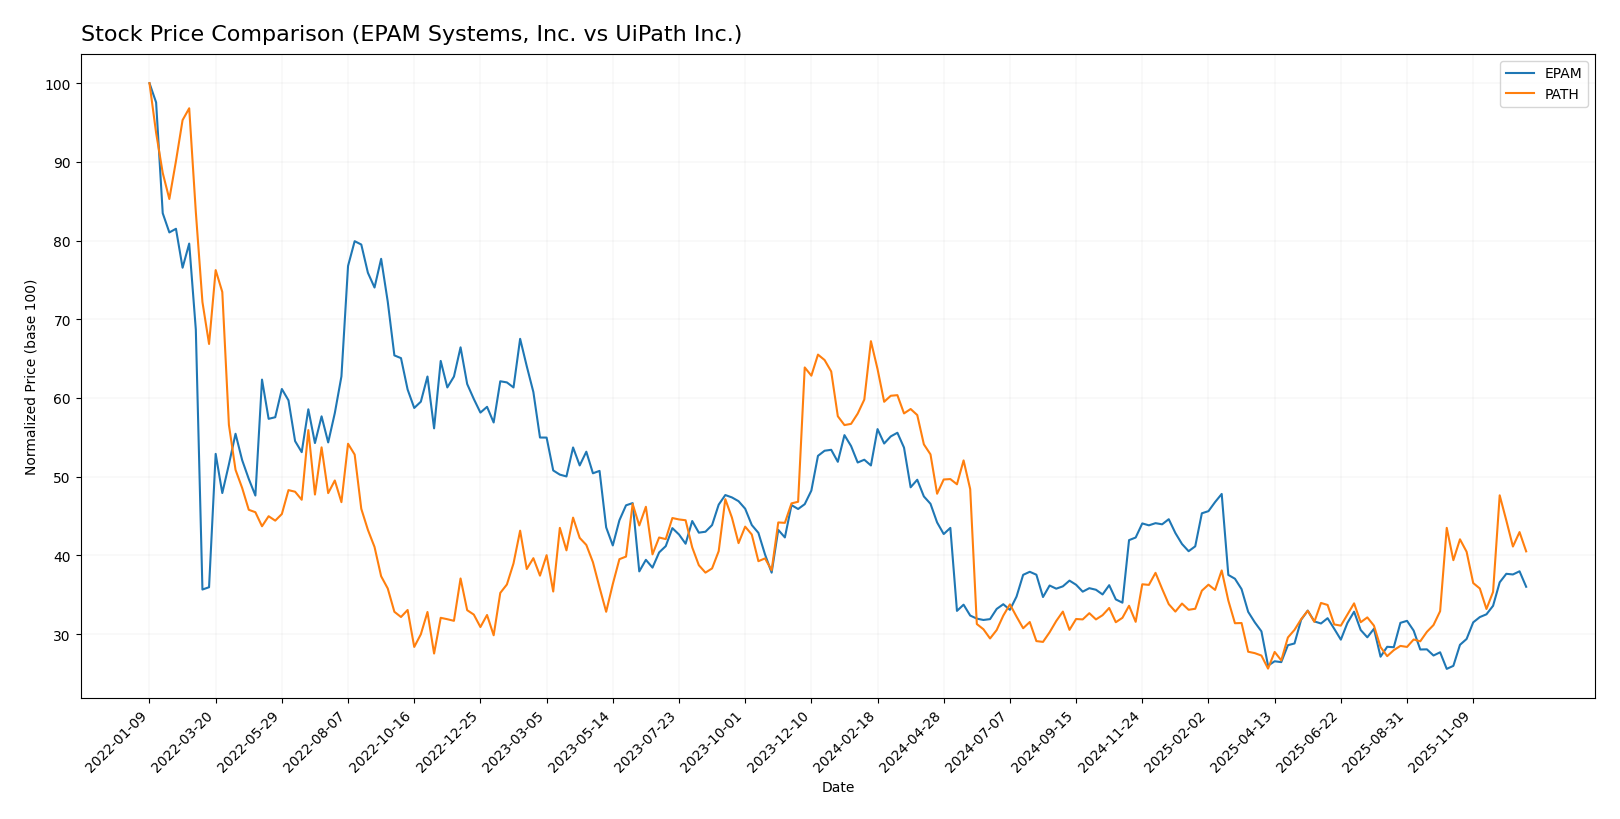
The stock price movements of EPAM Systems, Inc. and UiPath Inc. over the past year reveal significant bearish trends with notable volatility and recent short-term recoveries displaying differing momentum strengths.
Trend Analysis
EPAM Systems, Inc. experienced a 29.98% price decline over the past 12 months, indicating a bearish trend with accelerating downward momentum. The stock showed high volatility, with prices ranging from 142.38 to 311.98 and a recent recovery of 38.71% since October 2025.
UiPath Inc. saw a steeper 39.73% price drop in the same period, also bearish with acceleration. The stock’s volatility was lower, fluctuating between 10.04 and 26.35. A modest recent gain of 2.85% was recorded from October 2025 to January 2026.
Comparatively, EPAM Systems delivered the highest market performance recently with a stronger short-term rebound, despite both stocks showing overall bearish trends over the past year.
Target Prices
Analysts present a clear target price consensus for both EPAM Systems, Inc. and UiPath Inc.
| Company | Target High | Target Low | Consensus |
|---|---|---|---|
| EPAM Systems, Inc. | 185 | 175 | 180 |
| UiPath Inc. | 19 | 14 | 16.6 |
The target consensus for EPAM is $180, below its current price of $200.46, indicating potential downside. UiPath’s consensus at $16.6 is slightly above its current price of $15.88, suggesting modest upside expectations.
Analyst Opinions Comparison
This section compares analysts’ ratings and grades for EPAM Systems, Inc. and UiPath Inc.:
Rating Comparison
EPAM Rating
- Rating: A- indicating a very favorable assessment of EPAM’s financial standing.
- Discounted Cash Flow Score: 4, favorable, showing good valuation based on cash flow.
- ROE Score: 3, moderate efficiency in generating profit from equity.
- ROA Score: 4, favorable, effective asset utilization for earnings.
- Debt To Equity Score: 4, favorable, indicating strong balance sheet stability.
- Overall Score: 4, favorable overall financial health.
PATH Rating
- Rating: B+ reflecting a very favorable but lower rating compared to EPAM.
- Discounted Cash Flow Score: 3, moderate, suggesting less strong valuation.
- ROE Score: 4, favorable, indicating better profit generation efficiency.
- ROA Score: 4, favorable, similarly effective asset use as EPAM.
- Debt To Equity Score: 4, favorable, showing similar financial stability.
- Overall Score: 3, moderate overall financial health.
Which one is the best rated?
Based strictly on the provided data, EPAM holds a higher overall rating (A- vs. B+) and superior scores in discounted cash flow and overall financial health. PATH scores better on ROE but has a lower overall score, making EPAM the better rated company.
Scores Comparison
The comparison of scores for EPAM and PATH is as follows:
EPAM Scores
- Altman Z-Score: 7.96, indicating a safe zone status.
- Piotroski Score: 7, reflecting strong financial health.
PATH Scores
- Altman Z-Score: 6.53, indicating a safe zone status.
- Piotroski Score: 7, reflecting strong financial health.
Which company has the best scores?
Both EPAM and PATH have Altman Z-Scores placing them in the safe zone and identical Piotroski Scores of 7, indicating similarly strong financial health based on the provided data.
Grades Comparison
Here is a comparison of recent grades assigned to EPAM Systems, Inc. and UiPath Inc. by established grading firms:
EPAM Systems, Inc. Grades
The table below shows recent grades and actions from reputable financial institutions for EPAM Systems, Inc.:
| Grading Company | Action | New Grade | Date |
|---|---|---|---|
| Mizuho | maintain | Outperform | 2025-11-11 |
| JP Morgan | maintain | Overweight | 2025-11-07 |
| Morgan Stanley | maintain | Equal Weight | 2025-09-09 |
| JP Morgan | maintain | Overweight | 2025-08-20 |
| Barclays | maintain | Overweight | 2025-05-12 |
| Needham | maintain | Buy | 2025-05-09 |
| Guggenheim | maintain | Buy | 2025-05-09 |
| Morgan Stanley | maintain | Equal Weight | 2025-05-09 |
| Piper Sandler | maintain | Neutral | 2025-05-09 |
| Stifel | maintain | Buy | 2025-05-02 |
Overall, EPAM’s grades predominantly cluster around “Buy,” “Outperform,” and “Overweight,” indicating a generally positive analyst outlook with consistent maintenance of such ratings.
UiPath Inc. Grades
Below are recent grades and actions from verified grading companies for UiPath Inc.:
| Grading Company | Action | New Grade | Date |
|---|---|---|---|
| RBC Capital | maintain | Sector Perform | 2025-12-10 |
| Morgan Stanley | maintain | Equal Weight | 2025-12-09 |
| DA Davidson | maintain | Neutral | 2025-12-05 |
| BMO Capital | maintain | Market Perform | 2025-12-04 |
| RBC Capital | maintain | Sector Perform | 2025-12-04 |
| Mizuho | maintain | Neutral | 2025-12-04 |
| Canaccord Genuity | maintain | Buy | 2025-12-04 |
| Wells Fargo | maintain | Equal Weight | 2025-12-04 |
| Evercore ISI Group | maintain | In Line | 2025-12-04 |
| Barclays | maintain | Equal Weight | 2025-12-04 |
UiPath’s grades mostly range from “Neutral” and “Equal Weight” to “Sector Perform,” with fewer instances of “Buy,” suggesting a more cautious analyst sentiment compared to EPAM.
Which company has the best grades?
EPAM Systems, Inc. has received stronger and more consistently positive grades such as “Buy,” “Outperform,” and “Overweight,” whereas UiPath Inc. mostly holds “Neutral” and “Sector Perform” ratings. This difference may reflect varying analyst confidence levels, potentially influencing investor perception of growth and risk profiles.
Strengths and Weaknesses
Below is a comparison of key strengths and weaknesses for EPAM Systems, Inc. and UiPath Inc. based on the latest financial and operational data.
| Criterion | EPAM Systems, Inc. | UiPath Inc. |
|---|---|---|
| Diversification | Highly diversified across sectors: Financial Services (1.02B), Consumer Goods (1.01B), Software & Hi-Tech (702M), Healthcare (575M) | Revenue mainly from Licensing (587M) and Subscription Services (802M), less sector diversification |
| Profitability | Moderate profitability with net margin ~9.6%, ROE ~12.5%, but ROIC below WACC indicating value destruction | Negative profitability: net margin -5.15%, ROE -3.99%, ROIC well below WACC, shedding value |
| Innovation | Steady software development revenues, but ROIC trend declining, signaling challenges in sustaining innovation efficiency | Growing ROIC trend (+65%), indicating improvement in operational efficiency and innovation impact |
| Global presence | Strong global footprint across multiple verticals and regions, with large and diverse client base | Global presence focused on automation software market but less diversified geographically |
| Market Share | Solid position in IT services with broad client sectors, but facing profitability pressure | Strong player in robotic process automation, rapidly growing market share despite current losses |
Key takeaways: EPAM offers greater sector diversification and stable profitability metrics, though its declining ROIC is a warning sign. UiPath shows promising innovation growth and market share gains but struggles with profitability and value creation. Investors should weigh EPAM’s stability against UiPath’s growth potential and risk profile.
Risk Analysis
Below is a comparative table of key risks for EPAM Systems, Inc. and UiPath Inc. based on the most recent data from 2025-2026:
| Metric | EPAM Systems, Inc. | UiPath Inc. |
|---|---|---|
| Market Risk | High beta at 1.75 indicates volatility; tech sector exposure | Moderate beta at 1.1; software infrastructure sector |
| Debt level | Very low debt-to-equity 0.04; strong interest coverage | Low debt-to-equity 0.04 but interest coverage at zero |
| Regulatory Risk | Moderate, operates globally with potential data/privacy laws | Moderate, RPA software subject to compliance risks |
| Operational Risk | Large employee base (61.2K), complexity in integration services | Smaller workforce (3.9K) but complex automation platform |
| Environmental Risk | Low direct impact; mainly digital services | Low direct impact; focus on software automation |
| Geopolitical Risk | Exposure to multiple regions, including Eastern Europe | Presence in US, Romania, Japan, sensitive to geopolitical tensions |
In synthesis, EPAM’s higher market volatility and broad international operations pose significant market and geopolitical risks, while maintaining strong financial health. UiPath faces operational and interest coverage challenges, with moderate market risk. Both companies carry moderate regulatory risks due to their technology domains.
Which Stock to Choose?
EPAM Systems, Inc. shows a stable income evolution with modest revenue growth of 0.8% in 2024 and a favorable net margin of 9.61%. Financial ratios are slightly favorable overall, driven by a strong current ratio of 2.96 and low debt at 0.04 DE ratio. Profitability is moderate with a 12.52% ROE, though ROIC is unfavorable. The company’s debt remains low and interest coverage is infinite. EPAM holds a very favorable A- rating, supported by strong Altman Z-Score and Piotroski scores, despite a declining ROIC trend indicating value destruction.
UiPath Inc. exhibits a more volatile income profile, with higher revenue growth of 9.3% in 2025 but a negative net margin of -5.15%. Financial ratios are slightly unfavorable overall, reflecting challenges in asset turnover and negative profitability metrics. Debt levels remain low with a 0.04 DE ratio, but interest coverage is weak. UiPath holds a very favorable B+ rating with solid Altman Z-Score and Piotroski scores, although its ROIC remains below WACC, signaling value erosion despite an improving profitability trend.
Investors focused on income stability and moderate profitability may find EPAM’s slightly favorable financial ratios and strong rating appealing, while those willing to tolerate higher volatility and seek growth potential might view UiPath’s improving profitability and favorable rating as promising. The contrasting ROIC trends suggest a choice depending on tolerance for risk and preference for value creation versus growth potential.
Disclaimer: Investment carries a risk of loss of initial capital. The past performance is not a reliable indicator of future results. Be sure to understand risks before making an investment decision.
Go Further
I encourage you to read the complete analyses of EPAM Systems, Inc. and UiPath Inc. to enhance your investment decisions: