In the fast-evolving technology sector, EPAM Systems, Inc. and PagerDuty, Inc. stand out as key players driving digital innovation. EPAM excels in comprehensive software engineering and digital platform services, while PagerDuty specializes in digital operations management with a machine learning edge. Their overlapping focus on technology solutions and market presence makes this comparison timely. Join me as we explore which company offers the most compelling investment opportunity for your portfolio.
Table of contents
Companies Overview
I will begin the comparison between EPAM Systems and PagerDuty by providing an overview of these two companies and their main differences.
EPAM Overview
EPAM Systems, Inc. delivers digital platform engineering and software development services globally. Its offerings include engineering, infrastructure management, maintenance, support, and consulting services across multiple industries such as financial services, healthcare, and media. Founded in 1993 and headquartered in Newtown, Pennsylvania, EPAM employs over 61K people and operates within the Information Technology Services sector.
PagerDuty Overview
PagerDuty, Inc. operates a digital operations management platform that uses machine learning to analyze data from software-enabled systems. It supports industries like telecommunications, retail, and financial services, aiming to predict opportunities and issues. Founded in 2009 and based in San Francisco, California, PagerDuty has about 1.2K employees and is classified under the Software – Application industry.
Key similarities and differences
Both companies operate in the technology sector and serve diverse industries including financial services. EPAM focuses broadly on digital engineering and consulting services, while PagerDuty specializes in digital operations management with a machine learning approach. EPAM is significantly larger in workforce and market capitalization compared to PagerDuty, reflecting differences in scale and business scope.
Income Statement Comparison
This table presents a side-by-side comparison of key income statement metrics for EPAM Systems, Inc. and PagerDuty, Inc. for their most recent fiscal years.
| Metric | EPAM Systems, Inc. | PagerDuty, Inc. |
|---|---|---|
| Market Cap | 11.1B | 1.14B |
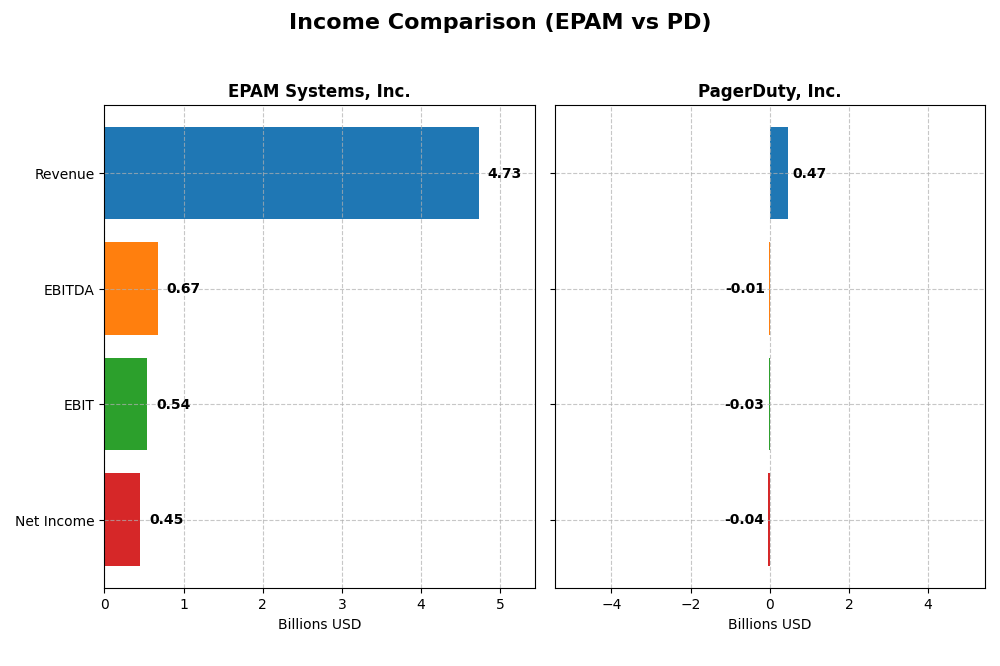
| Revenue | 4.73B | 468M |
| EBITDA | 672M | -12M |
| EBIT | 545M | -32M |
| Net Income | 455M | -43M |
| EPS | 7.93 | -0.59 |
| Fiscal Year | 2024 | 2025 |
Income Statement Interpretations
EPAM Systems, Inc.
EPAM’s revenue steadily grew by 77.78% from 2020 to 2024, with net income increasing 38.93% over the same period. Margins remain relatively stable, with a gross margin of 30.68% and a net margin of 9.61% in 2024. The latest year showed slowed revenue growth at 0.8%, but net margin and EPS improved favorably, indicating efficiency gains.
PagerDuty, Inc.
PagerDuty experienced strong revenue growth of 118.91% from 2021 to 2025, with net income improving by 37.98%. Despite a high gross margin of 82.96%, the company posted negative EBIT and net margins, though these margins improved significantly in 2025. The recent year saw favorable growth in revenue, gross profit, EBIT, and net margins, reflecting operational progress.
Which one has the stronger fundamentals?
Both companies exhibit favorable income statement trends, but EPAM shows consistently positive net income and margins, supporting stable profitability. PagerDuty demonstrates rapid growth and margin improvement but remains in negative net income territory. EPAM’s stable earnings contrast with PagerDuty’s ongoing losses, highlighting differing fundamental profiles based on profitability and growth dynamics.
Financial Ratios Comparison
Below is a comparison of key financial ratios for EPAM Systems, Inc. and PagerDuty, Inc. based on their most recent fiscal year data.
| Ratios | EPAM Systems, Inc. (2024) | PagerDuty, Inc. (2025) |
|---|---|---|
| ROE | 12.5% | -32.9% |
| ROIC | 10.7% | -9.7% |
| P/E | 29.5 | -39.9 |
| P/B | 3.69 | 13.12 |
| Current Ratio | 2.96 | 1.87 |
| Quick Ratio | 2.96 | 1.87 |
| D/E (Debt-to-Equity) | 0.045 | 3.57 |
| Debt-to-Assets | 3.4% | 50.0% |
| Interest Coverage | 0 | -6.46 |
| Asset Turnover | 1.00 | 0.50 |
| Fixed Asset Turnover | 14.1 | 16.6 |
| Payout Ratio | 0 | 0 |
| Dividend Yield | 0 | 0 |
Interpretation of the Ratios
EPAM Systems, Inc.
EPAM shows a mix of financial ratios with slightly favorable overall results. The company’s current and quick ratios at 2.96 indicate solid liquidity, while low debt-to-equity (0.04) and debt-to-assets (3.44%) ratios reflect conservative leverage. However, a return on invested capital of 10.67% and a PE ratio of 29.47 suggest some valuation concerns. EPAM does not pay dividends, focusing on reinvestment and growth instead.
PagerDuty, Inc.
PagerDuty’s ratios reveal several weaknesses, including negative net margin (-9.14%) and return on equity (-32.92%), signaling profitability challenges. The company carries high debt levels, with a debt-to-assets ratio of 50% and unfavorable interest coverage. Despite favorable quick and current ratios around 1.87, PagerDuty does not pay dividends, likely due to ongoing investments in R&D and growth initiatives. Its price-to-book ratio at 13.12 suggests a high valuation premium.
Which one has the best ratios?
EPAM Systems presents a more balanced and slightly favorable financial profile, supported by strong liquidity and controlled leverage, despite some valuation and return concerns. PagerDuty faces more pronounced unfavorable ratios, particularly in profitability and leverage, reflecting greater financial risk. Based on the ratio evaluations, EPAM’s metrics are comparatively stronger than PagerDuty’s.
Strategic Positioning
This section compares the strategic positioning of EPAM Systems, Inc. and PagerDuty, Inc., focusing on Market position, Key segments, and Exposure to technological disruption:
EPAM Systems, Inc.
- Large market cap of 11B USD in IT services, facing competitive pressure from global IT firms.
- Diversified revenue streams across financial, retail, healthcare, software, and emerging sectors.
- Provides extensive engineering, infrastructure, and consulting services; exposed to evolving software and platform technologies.
PagerDuty, Inc.
- Smaller 1.1B USD market cap in software applications with moderate competitive pressure.
- Focused on digital operations management platform serving tech, telecom, retail, and financial sectors.
- Relies on machine learning-driven digital operations, exposed to rapid innovation in AI and predictive analytics.
EPAM vs PagerDuty Positioning
EPAM exhibits a diversified business model across multiple verticals, enhancing revenue stability but increasing complexity. PagerDuty maintains a more concentrated focus on digital operations management, offering specialized solutions but with narrower market exposure.
Which has the best competitive advantage?
Both companies are currently shedding value relative to their cost of capital; EPAM shows declining profitability, while PagerDuty’s profitability is improving slightly, indicating a marginally better competitive positioning in terms of economic moat.
Stock Comparison
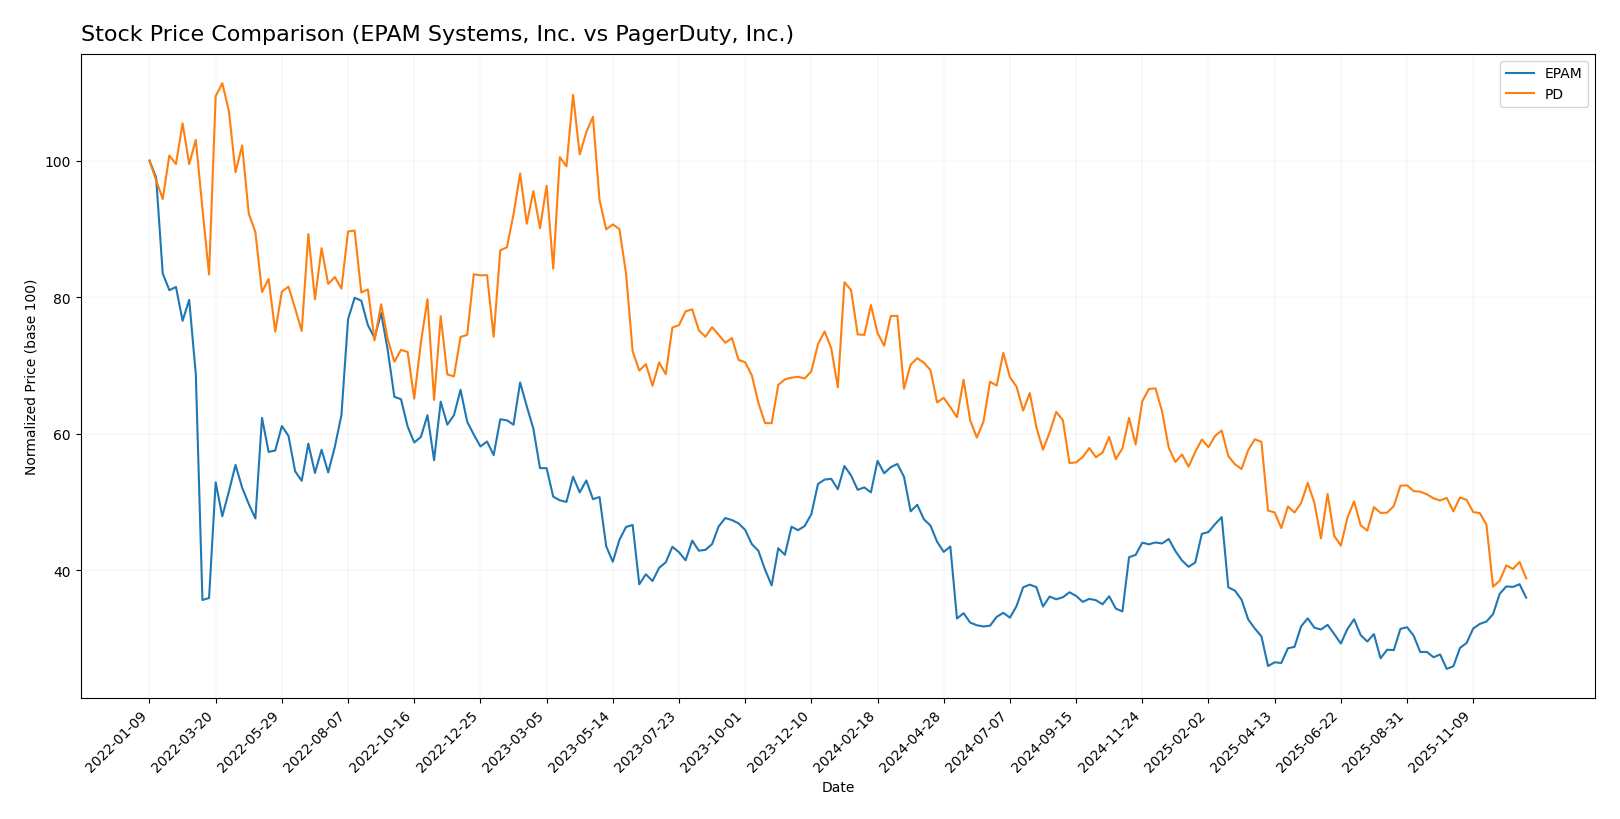
The stock prices of EPAM Systems, Inc. and PagerDuty, Inc. over the past year show significant bearish trends with notable divergences in recent quarterly performance and trading volume dynamics.
Trend Analysis
EPAM Systems, Inc. exhibited a bearish trend over the past 12 months, with a price decline of 29.98%. The trend shows acceleration, with a high volatility level marked by a 41.31 standard deviation and a recent strong positive rebound of 38.71% in the last quarter.
PagerDuty, Inc. experienced a more pronounced bearish trend with a 50.76% price decline over the past year. Its decelerating trend is accompanied by low volatility (2.93 std deviation) and a continued recent decline of 20.17%, confirming persistent downward momentum.
Comparing both, EPAM Systems delivered the highest market performance, benefiting from a recent strong recovery phase, whereas PagerDuty faced deeper losses and weaker recent price action.
Target Prices
Analysts present a clear target price consensus for EPAM Systems, Inc. and PagerDuty, Inc.
| Company | Target High | Target Low | Consensus |
|---|---|---|---|
| EPAM Systems, Inc. | 185 | 175 | 180 |
| PagerDuty, Inc. | 19 | 15 | 16.75 |
The consensus target for EPAM at $180 is below its current price of $200.46, indicating potential downside risk. PagerDuty’s consensus target of $16.75 is above the current price of $12.39, suggesting possible upside potential.
Analyst Opinions Comparison
This section compares analysts’ ratings and grades for EPAM Systems, Inc. and PagerDuty, Inc.:
Rating Comparison
EPAM Rating
- Rating: A- (Very Favorable)
- Discounted Cash Flow Score: 4, Favorable, indicating fairly valued cash flows
- ROE Score: 3, Moderate, showing average efficiency in generating shareholder profit
- ROA Score: 4, Favorable, reflecting effective asset utilization
- Debt To Equity Score: 4, Favorable, suggesting low financial risk
- Overall Score: 4, Favorable
PD Rating
- Rating: A- (Very Favorable)
- Discounted Cash Flow Score: 4, Favorable, indicating fairly valued cash flows
- ROE Score: 5, Very Favorable, indicating strong profit generation from equity
- ROA Score: 5, Very Favorable, reflecting very effective asset utilization
- Debt To Equity Score: 1, Very Unfavorable, indicating high financial risk
- Overall Score: 4, Favorable
Which one is the best rated?
Both EPAM and PD share the same overall rating of A- and an overall score of 4, reflecting favorable assessments. PD excels in profitability metrics but faces higher financial risk with a poor debt-to-equity score, whereas EPAM shows more balanced financial stability.
Scores Comparison
Here is a comparison of the Altman Z-Score and Piotroski Score for EPAM and PD:
EPAM Scores
- Altman Z-Score: 7.96, indicating a safe zone with low bankruptcy risk.
- Piotroski Score: 7, indicating strong financial health.
PD Scores
- Altman Z-Score: 1.37, indicating distress zone and higher bankruptcy risk.
- Piotroski Score: 7, indicating strong financial health.
Which company has the best scores?
EPAM has a significantly higher Altman Z-Score, placing it in the safe zone, while PD is in the distress zone. Both companies share the same Piotroski Score of 7, indicating similar financial strength.
Grades Comparison
The following presents a detailed comparison of the recent grades assigned to EPAM Systems, Inc. and PagerDuty, Inc.:
EPAM Systems, Inc. Grades
This table summarizes the latest grades assigned by reputable financial institutions for EPAM Systems, Inc.:
| Grading Company | Action | New Grade | Date |
|---|---|---|---|
| Mizuho | Maintain | Outperform | 2025-11-11 |
| JP Morgan | Maintain | Overweight | 2025-11-07 |
| Morgan Stanley | Maintain | Equal Weight | 2025-09-09 |
| JP Morgan | Maintain | Overweight | 2025-08-20 |
| Barclays | Maintain | Overweight | 2025-05-12 |
| Needham | Maintain | Buy | 2025-05-09 |
| Guggenheim | Maintain | Buy | 2025-05-09 |
| Morgan Stanley | Maintain | Equal Weight | 2025-05-09 |
| Piper Sandler | Maintain | Neutral | 2025-05-09 |
| Stifel | Maintain | Buy | 2025-05-02 |
Overall, EPAM’s grades consistently indicate a positive outlook, with multiple “Buy,” “Overweight,” and “Outperform” ratings maintained through 2025.
PagerDuty, Inc. Grades
This table outlines the recent grades from recognized grading firms for PagerDuty, Inc.:
| Grading Company | Action | New Grade | Date |
|---|---|---|---|
| RBC Capital | Maintain | Outperform | 2025-11-26 |
| Craig-Hallum | Downgrade | Hold | 2025-11-26 |
| Morgan Stanley | Maintain | Equal Weight | 2025-11-26 |
| TD Cowen | Maintain | Buy | 2025-11-26 |
| Truist Securities | Maintain | Buy | 2025-11-19 |
| Baird | Maintain | Neutral | 2025-09-04 |
| Canaccord Genuity | Maintain | Buy | 2025-09-04 |
| RBC Capital | Maintain | Outperform | 2025-09-04 |
| Canaccord Genuity | Maintain | Buy | 2025-06-02 |
| Truist Securities | Maintain | Buy | 2025-05-30 |
PagerDuty’s ratings show a generally positive trend, with multiple “Buy” and “Outperform” grades, though a recent downgrade to “Hold” introduces some caution.
Which company has the best grades?
EPAM Systems, Inc. exhibits a stronger consensus of favorable grades, with multiple “Buy,” “Overweight,” and “Outperform” ratings consistently maintained, suggesting more positive analyst sentiment compared to PagerDuty, Inc., which shows mixed signals including a recent downgrade. This disparity may influence investor sentiment towards greater confidence in EPAM’s stock performance.
Strengths and Weaknesses
Below is a comparison of key strengths and weaknesses for EPAM Systems, Inc. and PagerDuty, Inc. based on the most recent financial and strategic data.
| Criterion | EPAM Systems, Inc. | PagerDuty, Inc. |
|---|---|---|
| Diversification | Highly diversified across multiple sectors: Financial Services (~1.02B), Consumer Goods (~1.01B), Software & Hi-Tech (~702M), Healthcare (~575M), and Emerging Verticals (~741M) | Less diversified; primarily focused on digital operations management and incident response software |
| Profitability | Moderate profitability with net margin at 9.61%, ROE at 12.52%, but ROIC (10.67%) slightly below WACC (11.89%) indicating value destruction | Negative profitability with net margin at -9.14%, ROE at -32.92%, and ROIC at -9.66%, clearly shedding value |
| Innovation | Strong innovation in software development and IT services, supported by high fixed asset turnover (14.07) | Innovation-driven but high R&D costs contribute to negative margins; fixed asset turnover is strong (16.61) |
| Global presence | Established global footprint with exposure to multiple international sectors and client bases | Global but more niche market presence focused on cloud-based incident response |
| Market Share | Solid presence in IT services with steady revenue streams across sectors | Smaller market share in a competitive SaaS niche, with growth potential but currently unprofitable |
Key takeaways: EPAM offers diversified revenue streams and moderate profitability but currently destroys value due to ROIC below WACC. PagerDuty, while innovative with a growing ROIC trend, faces profitability challenges and higher financial risk. Investors should weigh EPAM’s sector diversification against PagerDuty’s growth potential and risk profile.
Risk Analysis
Below is a comparative table of key risk factors for EPAM Systems, Inc. and PagerDuty, Inc. based on the most recent financial and operational data from 2025-2026:
| Metric | EPAM Systems, Inc. | PagerDuty, Inc. |
|---|---|---|
| Market Risk | High beta (1.75) indicates elevated sensitivity to market swings | Moderate beta (0.69) suggests lower market volatility exposure |
| Debt level | Very low debt-to-equity (0.04) and debt-to-assets (3.44%) | High debt-to-equity (3.57) and debt-to-assets (50%) raise leverage concerns |
| Regulatory Risk | Moderate, typical for global IT services | Moderate, with international operations and data privacy rules |
| Operational Risk | Large employee base (61,200) may introduce complexity but diversified services | Smaller workforce (1,242), but dependency on platform reliability is critical |
| Environmental Risk | Low direct impact; IT services have limited environmental footprint | Similar low environmental footprint, but increasing scrutiny on data centers’ energy use |
| Geopolitical Risk | Exposure to global markets, including sensitive regions | International presence includes Japan and US with geopolitical tensions |
The most impactful risks currently stem from PagerDuty’s high leverage and distressed financial status (Altman Z-score in distress zone), which increases bankruptcy risk despite strong operational scores. EPAM’s higher market risk due to beta and its moderate profitability metrics pose caution but benefit from strong liquidity and low debt, reducing financial distress likelihood. Investors should weigh PagerDuty’s growth potential against its financial vulnerabilities, while EPAM offers a more stable risk profile with moderate growth prospects.
Which Stock to Choose?
EPAM Systems, Inc. shows favorable income statement metrics with steady net margin around 9.6% and improving EPS growth of 11.05% over one year. Financial ratios are slightly favorable overall, supported by low debt levels (debt-to-equity 0.04) and strong liquidity ratios, though valuation multiples appear stretched. The company’s rating is very favorable (A-), with solid Altman Z-score (7.96, safe zone) and Piotroski score of 7, but its economic moat is very unfavorable due to declining ROIC below WACC indicating value destruction.
PagerDuty, Inc. exhibits a favorable income growth trend, including revenue and net margin improvements, but continues to report negative profitability with net margin at -9.14%. Financial ratios are mostly unfavorable, especially high debt-to-equity at 3.57 and weak interest coverage, although liquidity ratios remain acceptable. Its rating is also very favorable (A-), but Altman Z-score is low (1.37, distress zone) despite a strong Piotroski score of 7. The company’s moat is slightly unfavorable with improving but still negative ROIC versus WACC.
Investors with a tolerance for higher risk and focus on growth might view PagerDuty’s improving income trends and growth potential more favorably, despite current profitability challenges and financial risks. Conversely, those prioritizing financial stability and lower leverage may find EPAM’s stronger liquidity and more stable earnings quality more aligned with their profile, even as its declining ROIC signals caution. Both companies hold very favorable ratings, but their contrasting financial health and profitability patterns suggest different risk-return trade-offs.
Disclaimer: Investment carries a risk of loss of initial capital. The past performance is not a reliable indicator of future results. Be sure to understand risks before making an investment decision.
Go Further
I encourage you to read the complete analyses of EPAM Systems, Inc. and PagerDuty, Inc. to enhance your investment decisions: