In the fast-evolving technology sector, EPAM Systems, Inc. and monday.com Ltd. stand out for their innovative approaches to digital solutions and software development. EPAM focuses on comprehensive digital platform engineering, while monday.com offers a versatile cloud-based work operating system. Both companies address overlapping markets with distinct innovation strategies, making their comparison essential for investors seeking growth and stability. Let’s explore which firm presents the most compelling opportunity for your portfolio in 2026.
Table of contents
Companies Overview
I will begin the comparison between EPAM Systems, Inc. and monday.com Ltd. by providing an overview of these two companies and their main differences.
EPAM Overview
EPAM Systems, Inc. is a global provider of digital platform engineering and software development services. Founded in 1993 and headquartered in Newtown, Pennsylvania, EPAM focuses on engineering, infrastructure management, and consulting services across various industries, including financial services, healthcare, and technology. With a workforce of 61,200 employees, EPAM aims to enhance clients’ software testing, quality assurance, and digital transformation efforts worldwide.
monday.com Overview
monday.com Ltd. develops cloud-based software applications centered on its Work OS, a visual work operating system that enables creation of customizable work management tools. Established in 2012 and based in Tel Aviv, Israel, monday.com serves diverse sectors such as marketing, CRM, and project management. The company employs approximately 2,508 people and supports organizations, educational institutions, and government units globally with modular software solutions and customer success services.
Key similarities and differences
Both EPAM and monday.com operate in the technology sector, focusing on software and digital solutions for business efficiency. EPAM emphasizes engineering services and infrastructure management, addressing a broad range of industries with extensive consulting offerings. In contrast, monday.com specializes in cloud-based application development with a modular platform tailored for work management and collaboration. Their employee base and market capitalization also differ significantly, reflecting distinct scales and business models within the tech industry.
Income Statement Comparison
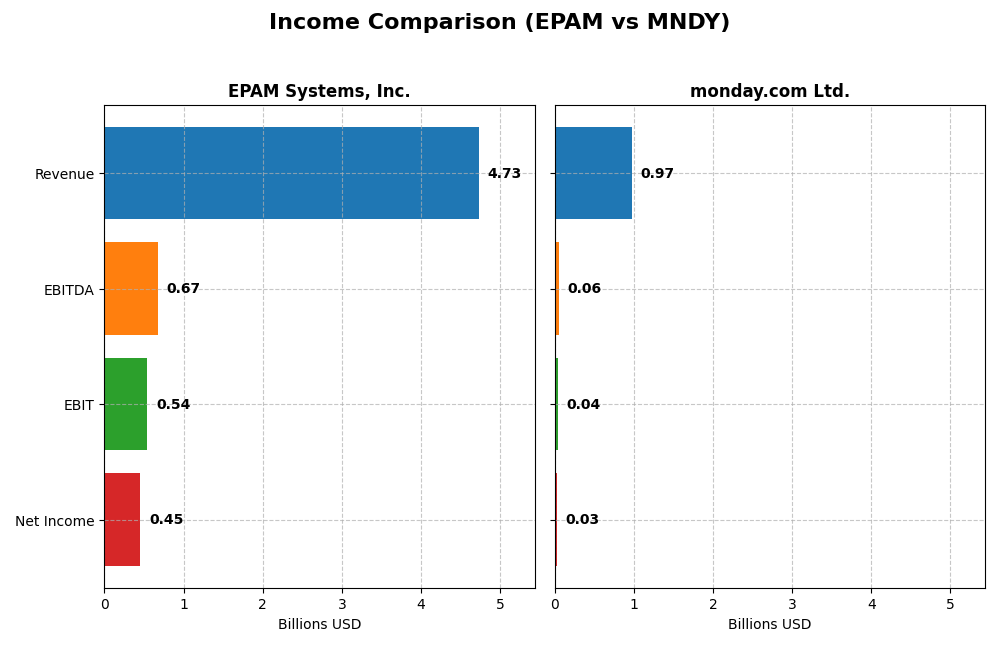
Below is a side-by-side comparison of key income statement metrics for EPAM Systems, Inc. and monday.com Ltd. for the fiscal year 2024.
| Metric | EPAM Systems, Inc. | monday.com Ltd. |
|---|---|---|
| Market Cap | 11.1B | 7.3B |
| Revenue | 4.73B | 972M |
| EBITDA | 672M | 58M |
| EBIT | 545M | 40M |
| Net Income | 455M | 32M |
| EPS | 7.93 | 0.65 |
| Fiscal Year | 2024 | 2024 |
Income Statement Interpretations
EPAM Systems, Inc.
EPAM’s revenue grew steadily from $2.7B in 2020 to $4.7B in 2024, with net income rising from $327M to $455M. Margins showed strength, maintaining a gross margin near 31% and net margin around 9.6%. The latest year showed slower revenue growth of 0.8%, but net margin improved by 8.1%, reflecting disciplined expense management.
monday.com Ltd.
monday.com demonstrated rapid revenue growth from $161M in 2020 to $972M in 2024, with net income turning positive at $32M after earlier losses. Gross margin remained high at 89%, while EBIT and net margins improved gradually but stayed moderate. The most recent year featured strong revenue growth of 33.2% and significant margin improvements, signaling operational scalability.
Which one has the stronger fundamentals?
EPAM exhibits stable, favorable profitability metrics and solid income growth over time, with margins consistent despite slower recent revenue expansion. monday.com shows exceptional top-line growth and margin recovery from losses, though profitability levels remain modest. EPAM’s mature financial stability contrasts with monday.com’s high-growth, improving fundamentals.
Financial Ratios Comparison
This table summarizes the key financial ratios for EPAM Systems, Inc. and monday.com Ltd. for the fiscal year ended 2024, providing a direct comparison of their recent performance metrics.
| Ratios | EPAM Systems, Inc. | monday.com Ltd. |
|---|---|---|
| ROE | 12.5% | 3.1% |
| ROIC | 10.7% | -1.7% |
| P/E | 29.5 | 363.0 |
| P/B | 3.69 | 11.41 |
| Current Ratio | 2.96 | 2.66 |
| Quick Ratio | 2.96 | 2.66 |
| D/E (Debt-to-Equity) | 0.045 | 0.103 |
| Debt-to-Assets | 3.4% | 6.3% |
| Interest Coverage | 0 | 0 |
| Asset Turnover | 1.00 | 0.58 |
| Fixed Asset Turnover | 14.07 | 7.13 |
| Payout Ratio | 0% | 0% |
| Dividend Yield | 0% | 0% |
Interpretation of the Ratios
EPAM Systems, Inc.
EPAM displays a mix of favorable and unfavorable ratios. It has strong liquidity with a current ratio of 2.96 and low debt levels (debt-to-equity 0.04), supporting financial stability. However, valuation metrics like PE at 29.47 and PB at 3.69 are less attractive, and the ROIC at 10.67% is below the WACC of 11.89%, raising concerns. EPAM does not pay dividends, likely due to reinvestment strategies and growth priorities.
monday.com Ltd.
monday.com exhibits weaker profitability ratios, with a low net margin of 3.33% and ROE at 3.14%, both unfavorable. Its valuation is stretched, with a PE of 362.98 and PB of 11.41, while liquidity remains adequate at a 2.66 current ratio. Negative ROIC and modest asset turnover suggest operational challenges. The company also pays no dividends, likely reinvesting to support growth and R&D efforts.
Which one has the best ratios?
EPAM’s ratios are slightly more favorable overall, with better liquidity, lower leverage, and more balanced profitability metrics despite some valuation concerns. monday.com faces more significant challenges in profitability and valuation, reflected in its neutral global ratio opinion. Hence, EPAM shows a marginally stronger financial profile based on the 2024 ratio analysis.
Strategic Positioning
This section compares the strategic positioning of EPAM and monday.com, including market position, key segments, and exposure to technological disruption:
EPAM
- Positioned in IT services with strong presence in multiple industries, facing high competition.
- Diversified across financial services, consumer goods, healthcare, software, and media sectors.
- Exposure to disruption through digital platform engineering and emerging technologies like AI.
monday.com
- Operates in software applications, focusing on cloud-based work management tools amid competition.
- Concentrated on cloud-based Work OS and modular software for marketing, CRM, and project management.
- Faces disruption risks inherent in cloud software innovation and evolving work management trends.
EPAM vs monday.com Positioning
EPAM pursues a diversified approach across many industry verticals, providing broad engineering and consulting services. monday.com concentrates on cloud-based work management software. EPAM’s diversification offers broad market exposure, while monday.com’s focus targets niche product innovation.
Which has the best competitive advantage?
Both companies are currently shedding value as ROIC is below WACC. EPAM shows declining profitability, while monday.com’s ROIC is improving, indicating slightly better potential despite value destruction.
Stock Comparison
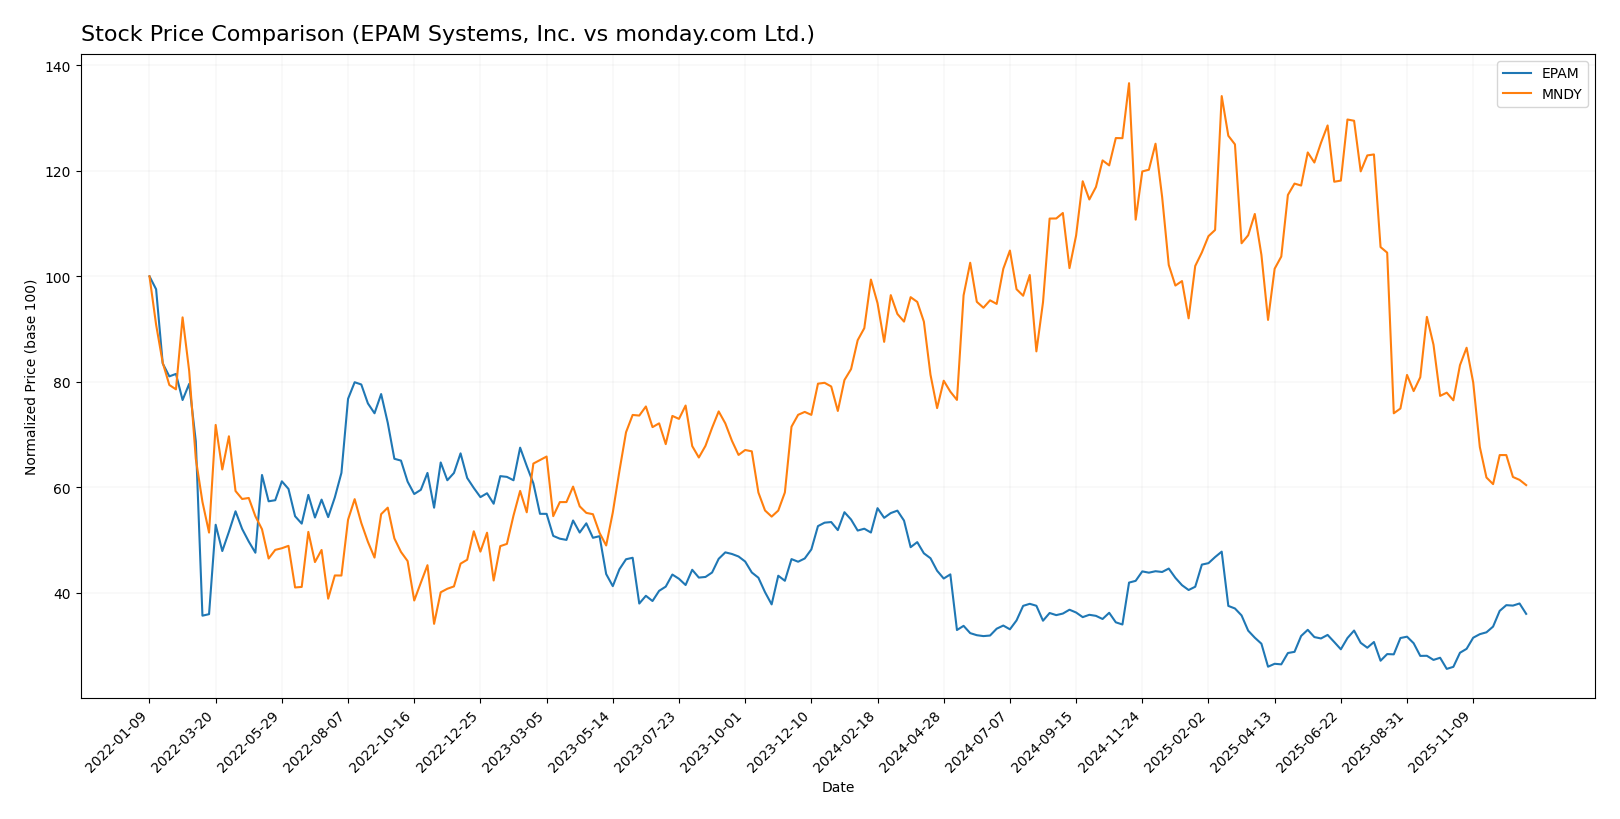
The stock prices of EPAM Systems, Inc. and monday.com Ltd. have experienced significant fluctuations over the past 12 months, with EPAM showing signs of recent recovery while monday.com continues to face downward pressure.
Trend Analysis
EPAM Systems, Inc. shows a bearish trend over the past year with a -29.98% price change and accelerating decline. Recently, however, it posted a strong bullish rebound of +38.71% from October 2025 to January 2026.
monday.com Ltd. exhibits a bearish trend with a -39.21% price change over the last 12 months and decelerating decline. Its recent trend remains negative, dropping -21.02% in the same period.
Comparing both stocks, EPAM has delivered the highest market performance recently due to its significant positive rebound, contrasting with monday.com’s continued downward trend.
Target Prices
Analysts present a clear target price consensus for EPAM Systems, Inc. and monday.com Ltd.
| Company | Target High | Target Low | Consensus |
|---|---|---|---|
| EPAM Systems, Inc. | 185 | 175 | 180 |
| monday.com Ltd. | 330 | 202 | 277.18 |
Overall, analysts expect EPAM’s price to be slightly below its current level of $200.46, while monday.com’s consensus target of $277.18 is significantly above its current price of $143.42, indicating more upside potential for monday.com.
Analyst Opinions Comparison
This section compares analysts’ ratings and financial scores for EPAM Systems, Inc. and monday.com Ltd.:
Rating Comparison
EPAM Rating
- Rating: A-, indicating a very favorable overall evaluation.
- Discounted Cash Flow Score: 4, showing favorable valuation based on cash flows.
- ROE Score: 3, moderate efficiency in generating profit from equity.
- ROA Score: 4, favorable asset utilization efficiency.
- Debt To Equity Score: 4, favorable financial risk with lower reliance on debt.
- Overall Score: 4, favorable comprehensive financial standing.
MNDY Rating
- Rating: B-, also marked very favorable overall but lower than EPAM’s rating.
- Discounted Cash Flow Score: 4, similarly favorable valuation on cash flows.
- ROE Score: 2, moderate but lower efficiency compared to EPAM.
- ROA Score: 3, moderate asset utilization efficiency.
- Debt To Equity Score: 3, moderate financial risk, higher debt relative to EPAM.
- Overall Score: 2, moderate overall financial standing.
Which one is the best rated?
Based strictly on the provided data, EPAM holds a higher overall rating (A-) and scores better across ROE, ROA, debt-to-equity, and overall financial metrics compared to monday.com’s B- rating and generally lower scores.
Scores Comparison
Here is a comparison of the Altman Z-Score and Piotroski Score for EPAM and monday.com Ltd.:
EPAM Scores
- Altman Z-Score: 7.96, indicating a safe zone, low bankruptcy risk.
- Piotroski Score: 7, classified as strong financial health.
MNDY Scores
- Altman Z-Score: 7.39, indicating a safe zone, low bankruptcy risk.
- Piotroski Score: 5, classified as average financial health.
Which company has the best scores?
EPAM has higher scores, with a stronger Piotroski Score (7 vs. 5) and a slightly higher Altman Z-Score (7.96 vs. 7.39). Both are in the safe zone, but EPAM demonstrates stronger financial health overall.
Grades Comparison
Here is the recent grading comparison for EPAM Systems, Inc. and monday.com Ltd.:
EPAM Systems, Inc. Grades
The table below summarizes recent grades from major financial institutions for EPAM Systems, Inc.:
| Grading Company | Action | New Grade | Date |
|---|---|---|---|
| Mizuho | Maintain | Outperform | 2025-11-11 |
| JP Morgan | Maintain | Overweight | 2025-11-07 |
| Morgan Stanley | Maintain | Equal Weight | 2025-09-09 |
| JP Morgan | Maintain | Overweight | 2025-08-20 |
| Barclays | Maintain | Overweight | 2025-05-12 |
| Needham | Maintain | Buy | 2025-05-09 |
| Guggenheim | Maintain | Buy | 2025-05-09 |
| Morgan Stanley | Maintain | Equal Weight | 2025-05-09 |
| Piper Sandler | Maintain | Neutral | 2025-05-09 |
| Stifel | Maintain | Buy | 2025-05-02 |
Overall, EPAM’s grades show a generally positive sentiment, with multiple buy and outperform ratings, though some neutral and equal weight opinions indicate moderate caution.
monday.com Ltd. Grades
The table below presents recent grading updates for monday.com Ltd. from reputable agencies:
| Grading Company | Action | New Grade | Date |
|---|---|---|---|
| Citigroup | Maintain | Buy | 2025-12-23 |
| Tigress Financial | Maintain | Buy | 2025-12-11 |
| Morgan Stanley | Maintain | Overweight | 2025-11-11 |
| Piper Sandler | Maintain | Overweight | 2025-11-11 |
| B of A Securities | Maintain | Neutral | 2025-11-11 |
| JP Morgan | Maintain | Overweight | 2025-11-11 |
| Canaccord Genuity | Maintain | Buy | 2025-11-11 |
| Jefferies | Maintain | Buy | 2025-11-11 |
| Wells Fargo | Maintain | Overweight | 2025-11-11 |
| Baird | Maintain | Outperform | 2025-11-11 |
monday.com’s grades indicate a strong buy and overweight consensus, reflecting solid confidence from multiple top-tier firms.
Which company has the best grades?
monday.com Ltd. has received slightly stronger overall grades compared to EPAM Systems, Inc., with a higher concentration of buy and overweight ratings, potentially signaling greater investor confidence and a more favorable outlook. This may impact investor decisions by highlighting monday.com as perceived with comparatively higher growth expectations or stability.
Strengths and Weaknesses
Below is a comparative overview of key strengths and weaknesses of EPAM Systems, Inc. and monday.com Ltd. based on the latest financial and operational data from 2024.
| Criterion | EPAM Systems, Inc. | monday.com Ltd. |
|---|---|---|
| Diversification | Well diversified across multiple sectors: Financial Services (1.02B), Consumer Goods (1.01B), Software & Hi-Tech (702M), Healthcare (575M), and Emerging Verticals (741M) | Less diversified; primarily focused on workflow software solutions with limited sector spread |
| Profitability | Moderate net margin (9.61%), neutral ROE (12.52%), but ROIC below WACC indicating value destruction | Low net margin (3.33%), low ROE (3.14%), negative ROIC; company is shedding value despite growing ROIC trend |
| Innovation | Strong technology infrastructure and software development capabilities supporting multiple industries | Growing innovation seen in improving ROIC trend, but overall profitability remains weak |
| Global presence | Strong global footprint serving varied industry verticals worldwide | Global presence expanding but still less established compared to EPAM |
| Market Share | Significant presence in IT services with high fixed asset turnover (14.07), indicating efficient asset use | Smaller market share reflected by lower asset turnover (7.13) and higher valuation multiples |
Key takeaways: EPAM exhibits strong diversification and solid operational efficiency but faces challenges in maintaining profitability above capital costs. monday.com shows promising growth in profitability trends but remains unprofitable overall with high valuation risks. Investors should weigh EPAM’s stability against monday.com’s growth potential carefully.
Risk Analysis
Below is a comparative table highlighting key risks for EPAM Systems, Inc. and monday.com Ltd. as of the most recent fiscal year, 2024:
| Metric | EPAM Systems, Inc. | monday.com Ltd. |
|---|---|---|
| Market Risk | High beta at 1.75 indicating higher volatility | Moderate beta at 1.26, somewhat less volatile |
| Debt level | Very low debt-to-equity at 0.04, low financial risk | Low debt-to-equity at 0.10, moderate risk |
| Regulatory Risk | Moderate, US-based but global operations | Moderate, Israeli base with global exposure |
| Operational Risk | Large workforce (61,200) may increase complexity | Smaller workforce (2,508), less complexity |
| Environmental Risk | Generally low, IT services sector | Generally low, software sector |
| Geopolitical Risk | Exposed to global markets including sensitive regions | Exposure to geopolitical tensions in Middle East and Europe |
In synthesis, EPAM shows higher market risk due to its elevated beta but benefits from very low debt and strong operational scale. Monday.com faces moderate market and geopolitical risks with a higher debt ratio relative to EPAM, and weaker profitability metrics. The most impactful risk for both remains market volatility and geopolitical exposure, which could affect valuation and operational stability. Investors should weigh these risks carefully against growth prospects.
Which Stock to Choose?
EPAM Systems, Inc. shows a stable income evolution with 0.8% revenue growth in 2024 and a favorable overall income statement evaluation. Its profitability is moderate, with a 9.61% net margin and a 12.52% ROE. The company maintains low debt levels and a strong liquidity position, reflected in a current ratio of 2.96 and very favorable debt-related ratios. The overall rating stands at A- with a very favorable assessment.
monday.com Ltd. exhibits strong recent income growth, with 33.21% revenue increase and an 85.71% favorable income statement evaluation. Profitability remains low, with a 3.33% net margin and 3.14% ROE. Debt is moderate but manageable, supported by favorable liquidity ratios. The company holds a B- rating, also considered very favorable, despite some valuation concerns reflected in high P/E and P/B ratios.
For investors, EPAM may appear more suitable for those valuing stable profitability and financial strength, given its slightly favorable ratios and very favorable rating. Conversely, monday.com could be seen as appealing for growth-oriented investors willing to accept lower current profitability and higher valuation metrics, supported by its rapid income growth and improving profitability trend.
Disclaimer: Investment carries a risk of loss of initial capital. The past performance is not a reliable indicator of future results. Be sure to understand risks before making an investment decision.
Go Further
I encourage you to read the complete analyses of EPAM Systems, Inc. and monday.com Ltd. to enhance your investment decisions: