In the dynamic world of information technology services, Leidos Holdings, Inc. (LDOS) and EPAM Systems, Inc. (EPAM) stand out as influential players. Both companies operate in overlapping markets, delivering innovative solutions across defense, health, and digital platform engineering sectors. Their distinct approaches to technology and market expansion make this comparison insightful. Join me as we explore which company offers the most compelling investment opportunity in 2026.

Table of contents
Companies Overview
I will begin the comparison between Leidos Holdings, Inc. and EPAM Systems, Inc. by providing an overview of these two companies and their main differences.
Leidos Holdings, Inc. Overview
Leidos Holdings, Inc. provides services and solutions primarily in defense, intelligence, civil, and health markets both in the US and internationally. Its business spans three segments: Defense Solutions, Civil, and Health, delivering technology, systems, and cybersecurity solutions to government agencies, military services, and commercial customers. Founded in 1969, Leidos is headquartered in Reston, Virginia, with a market capitalization of approximately 24.4B USD.
EPAM Systems, Inc. Overview
EPAM Systems, Inc. specializes in digital platform engineering and software development worldwide. The company offers services such as software customization, infrastructure management, operation solutions, and consulting, catering to diverse industries including financial services, healthcare, and technology. Founded in 1993 and based in Newtown, Pennsylvania, EPAM has a market cap near 12.2B USD and employs over 61K staff members.
Key similarities and differences
Both companies operate in the information technology services sector, serving global markets with technology solutions. Leidos focuses on government and defense-related services with a strong emphasis on national security, while EPAM concentrates on digital engineering and software development across multiple industries. Leidos has a larger market cap and a lower beta, indicating less volatility compared to EPAM, which exhibits higher beta reflecting more market sensitivity.
Income Statement Comparison
Below is a comparison of the key income statement metrics for Leidos Holdings, Inc. and EPAM Systems, Inc. for their most recent fiscal year.

| Metric | Leidos Holdings, Inc. | EPAM Systems, Inc. |
|---|---|---|
| Market Cap | 24.4B | 12.2B |
| Revenue | 16.7B | 4.7B |
| EBITDA | 2.12B | 672M |
| EBIT | 1.83B | 545M |
| Net Income | 1.25B | 455M |
| EPS | 9.36 | 7.93 |
| Fiscal Year | 2024 | 2024 |
Income Statement Interpretations
Leidos Holdings, Inc.
Leidos Holdings, Inc. demonstrated steady revenue growth from $12.3B in 2020 to $16.7B in 2024, nearly doubling net income to $1.25B. Margins showed improvement, with a favorable EBIT margin at 11% and net margin at 7.53%. The 2024 fiscal year notably saw a 7.9% revenue increase and strong margin expansion, reflecting solid operational efficiency.
EPAM Systems, Inc.
EPAM Systems, Inc. posted revenue growth from $2.7B in 2020 to $4.7B in 2024, with net income rising to $455M. Gross margin remains strong at 30.68%, and net margin at 9.61%. However, 2024 revenue growth slowed to 0.8%, though earnings per share improved by 11%, indicating stable profitability despite slower top-line expansion.
Which one has the stronger fundamentals?
Leidos shows more consistent and robust growth in revenue and net income, alongside improving margins and a significant uptick in earnings per share, supported by favorable expense management. EPAM, while maintaining higher gross margins and profitability ratios, faces slower recent revenue growth and declining net margin over the period, tempering its overall income statement strength.
Financial Ratios Comparison
The following table compares the most recent key financial ratios for Leidos Holdings, Inc. and EPAM Systems, Inc. based on their fiscal year 2024 data.
| Ratios | Leidos Holdings, Inc. (LDOS) | EPAM Systems, Inc. (EPAM) |
|---|---|---|
| ROE | 28.4% | 12.5% |
| ROIC | 13.9% | 10.7% |
| P/E | 15.7 | 29.5 |
| P/B | 4.47 | 3.69 |
| Current Ratio | 1.21 | 2.96 |
| Quick Ratio | 1.13 | 2.96 |
| D/E | 1.20 | 0.045 |
| Debt-to-Assets | 40.4% | 3.4% |
| Interest Coverage | 9.47 | 0 |
| Asset Turnover | 1.27 | 1.00 |
| Fixed Asset Turnover | 10.74 | 14.07 |
| Payout Ratio | 16.6% | 0% |
| Dividend Yield | 1.05% | 0% |
Interpretation of the Ratios
Leidos Holdings, Inc.
Leidos shows a balanced ratio profile with 50% favorable metrics, including strong return on equity (28.42%) and return on invested capital (13.85%). However, its price-to-book ratio (4.47) and debt-to-equity ratio (1.2) are less favorable, signaling caution around valuation and leverage. The dividend yield of 1.05% is covered adequately, indicating moderate shareholder returns with some risk from leverage.
EPAM Systems, Inc.
EPAM’s ratios are mixed, with 42.86% favorable but higher unfavorable ratios (35.71%), including a high price-to-earnings ratio (29.47) and weighted average cost of capital (11.76%). Its low leverage (debt-to-equity 0.04) and strong liquidity ratios are positives. EPAM does not pay dividends, reflecting a reinvestment strategy focused on growth and innovation rather than shareholder payouts.
Which one has the best ratios?
Both companies are rated slightly favorable overall. Leidos benefits from stronger profitability and returns but faces valuation and debt concerns. EPAM offers excellent liquidity and low leverage but weaker returns and high valuation multiples. Neither decisively outperforms; the choice depends on investor priorities regarding growth, risk, and income.
Strategic Positioning
This section compares the strategic positioning of Leidos Holdings, Inc. and EPAM Systems, Inc. across market position, key segments, and exposure to technological disruption:
Leidos Holdings, Inc.
- Strong position in defense, intelligence, civil, and health sectors facing moderate competition.
- Focused on Defense Solutions, Civil, and Health segments driven by national security and IT services.
- Exposure to disruption through technology, large-scale systems, cybersecurity, and digital transformation.
EPAM Systems, Inc.
- Provides digital platform engineering and software development services in varied industry sectors.
- Key segments include Financial Services, Consumer Goods, Healthcare, Software & Hi-Tech, and Media.
- Faces disruption risks via digital platforms, AI, robotics, virtual reality, and automation services.
Leidos Holdings, Inc. vs EPAM Systems, Inc. Positioning
Leidos has a concentrated focus on national security, civil, and health markets with large-scale system integration, providing stable government contracts. EPAM adopts a diversified approach with broad digital engineering services across multiple commercial sectors, exposing it to varied market dynamics and innovation demands.
Which has the best competitive advantage?
Leidos demonstrates a very favorable moat with growing ROIC and value creation, indicating durable competitive advantage. EPAM shows a very unfavorable moat with declining ROIC, reflecting challenges in maintaining profitability and competitive strength.
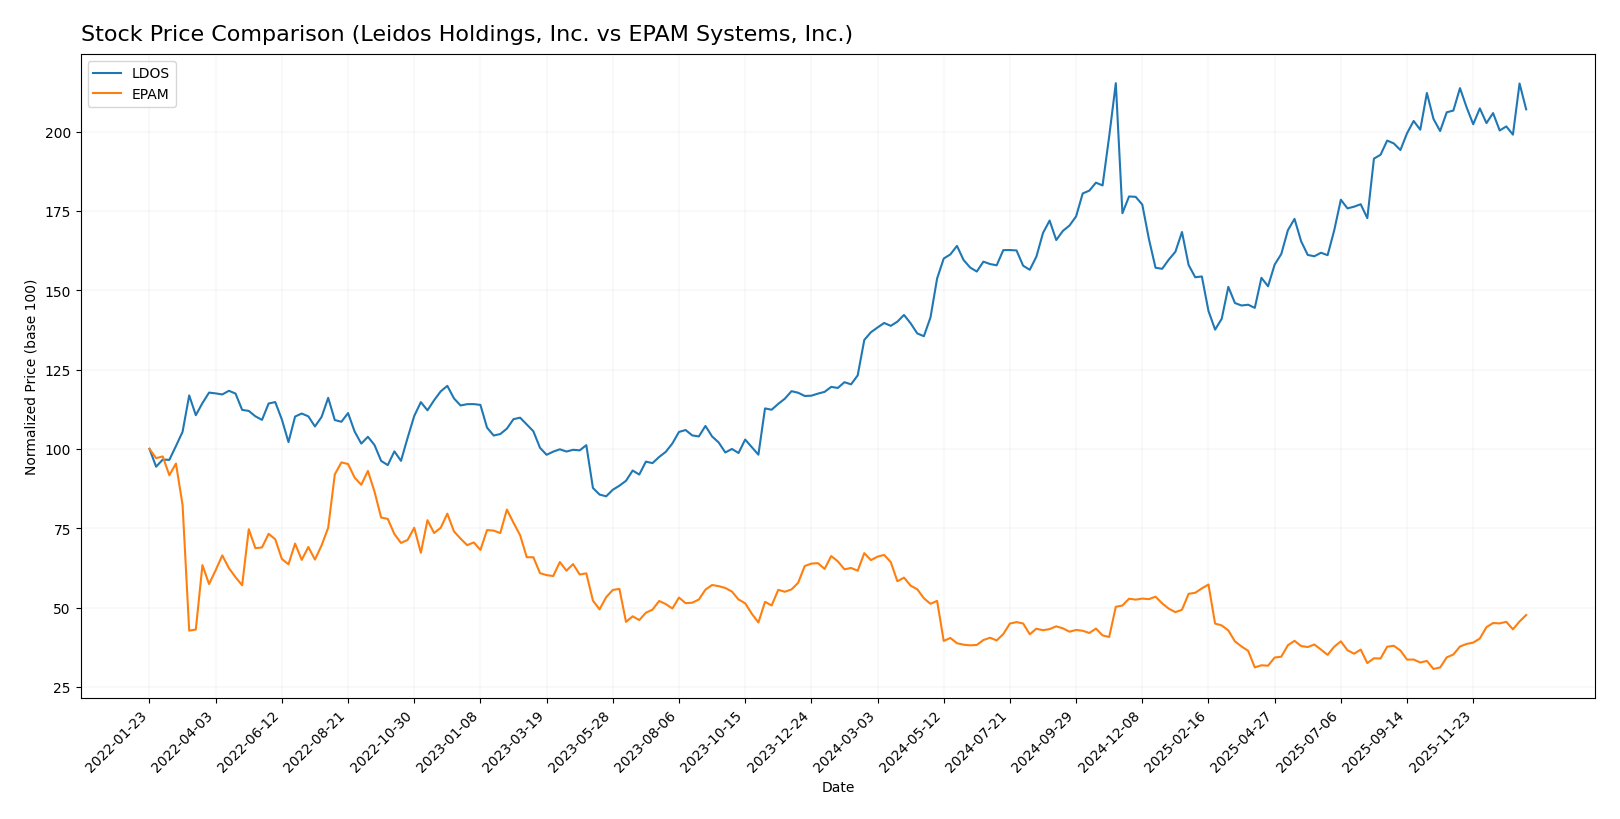
Stock Comparison
Over the past 12 months, Leidos Holdings, Inc. showed a significant bullish trend with a 51.37% price increase despite decelerating momentum, while EPAM Systems, Inc. experienced a bearish trend declining by 26.64%, though recently reversing with strong price gains.
Trend Analysis
Leidos Holdings, Inc. displayed a bullish trend over the past year with a 51.37% price increase and decelerating momentum, reaching a high of 198.42 and a low of 124.91, supported by moderate volatility (std dev 20.61).
EPAM Systems, Inc. showed a bearish trend overall with a -26.64% price change but with accelerating decline and higher volatility (std dev 38.96); however, recent weeks saw a strong upward reversal with a 35.38% gain and rising momentum.
Comparing both stocks, Leidos Holdings delivered the highest market performance over the full year with a 51.37% gain versus EPAM’s 26.64% loss, despite EPAM’s recent strong recovery.
Target Prices
Analysts show a generally optimistic outlook with solid target price consensus for both Leidos Holdings, Inc. and EPAM Systems, Inc.
| Company | Target High | Target Low | Consensus |
|---|---|---|---|
| Leidos Holdings, Inc. | 230 | 216 | 222.2 |
| EPAM Systems, Inc. | 247 | 175 | 214 |
For Leidos Holdings, the consensus target price of 222.2 suggests a potential upside from the current price of 190.82 USD. EPAM Systems’ consensus of 214 is close to its current price of 221.4 USD, indicating a balanced valuation with some upside potential.
Analyst Opinions Comparison
This section compares analysts’ ratings and grades for Leidos Holdings, Inc. (LDOS) and EPAM Systems, Inc. (EPAM):
Rating Comparison
LDOS Rating
- Rating: A-, classified as Very Favorable.
- Discounted Cash Flow Score: 5, indicating a very favorable valuation outlook.
- ROE Score: 5, showing very efficient profit generation from equity.
- ROA Score: 4, demonstrating favorable asset utilization.
- Debt To Equity Score: 1, indicating very unfavorable financial leverage risk.
- Overall Score: 4, a favorable overall financial standing.
EPAM Rating
- Rating: A-, classified as Very Favorable.
- Discounted Cash Flow Score: 4, indicating a favorable valuation outlook.
- ROE Score: 3, reflecting moderate efficiency in generating equity returns.
- ROA Score: 4, demonstrating favorable asset utilization.
- Debt To Equity Score: 4, indicating favorable financial leverage management.
- Overall Score: 4, a favorable overall financial standing.
Which one is the best rated?
Both companies share the same overall rating of A- and overall score of 4, indicating favorable financial standing. LDOS excels in cash flow and equity returns, while EPAM shows better debt management. Their strengths differ but ratings are equal based on provided data.
Scores Comparison
Here is a comparison of the financial health scores for Leidos Holdings, Inc. and EPAM Systems, Inc.:
Leidos Holdings, Inc. Scores
- Altman Z-Score: 4.15, indicating a safe zone with low bankruptcy risk.
- Piotroski Score: 8, classified as very strong financial health.
EPAM Systems, Inc. Scores
- Altman Z-Score: 8.83, indicating a safe zone with very low bankruptcy risk.
- Piotroski Score: 7, classified as strong financial health.
Which company has the best scores?
EPAM Systems has a notably higher Altman Z-Score, suggesting a lower bankruptcy risk compared to Leidos. However, Leidos has a slightly stronger Piotroski Score, indicating marginally better financial strength. Overall, both companies score well but excel in different aspects.
Grades Comparison
Here is a comparison of the recent grades assigned to Leidos Holdings, Inc. and EPAM Systems, Inc.:
Leidos Holdings, Inc. Grades
The table below shows recent grades from reputable grading companies for Leidos Holdings, Inc.
| Grading Company | Action | New Grade | Date |
|---|---|---|---|
| Citigroup | Maintain | Buy | 2026-01-13 |
| Stifel | Downgrade | Hold | 2026-01-08 |
| B of A Securities | Maintain | Buy | 2025-11-07 |
| Truist Securities | Maintain | Buy | 2025-11-05 |
| UBS | Maintain | Neutral | 2025-11-05 |
| Cantor Fitzgerald | Maintain | Overweight | 2025-10-31 |
| Argus Research | Maintain | Buy | 2025-09-24 |
| B of A Securities | Maintain | Buy | 2025-09-04 |
| RBC Capital | Upgrade | Outperform | 2025-09-04 |
| UBS | Maintain | Neutral | 2025-08-07 |
Leidos Holdings shows a strong prevalence of Buy and Outperform ratings, with only a few Neutral and one Hold, indicating generally positive sentiment with minor caution.
EPAM Systems, Inc. Grades
The table below lists recent grades from verified grading companies for EPAM Systems, Inc.
| Grading Company | Action | New Grade | Date |
|---|---|---|---|
| TD Cowen | Maintain | Buy | 2026-01-09 |
| Mizuho | Maintain | Outperform | 2025-11-11 |
| JP Morgan | Maintain | Overweight | 2025-11-07 |
| Morgan Stanley | Maintain | Equal Weight | 2025-09-09 |
| JP Morgan | Maintain | Overweight | 2025-08-20 |
| Barclays | Maintain | Overweight | 2025-05-12 |
| Guggenheim | Maintain | Buy | 2025-05-09 |
| Morgan Stanley | Maintain | Equal Weight | 2025-05-09 |
| Needham | Maintain | Buy | 2025-05-09 |
| Piper Sandler | Maintain | Neutral | 2025-05-09 |
EPAM Systems’ grades are predominantly Buy, Outperform, and Overweight, with some Equal Weight and a single Neutral, reflecting a mostly positive outlook with moderate caution.
Which company has the best grades?
Both Leidos Holdings and EPAM Systems share a consensus Buy rating with a predominance of Buy and Outperform grades. EPAM has a slightly broader base of Overweight and Outperform ratings, while Leidos has more Hold and Neutral grades. Investors might interpret EPAM’s grades as signaling marginally stronger analyst confidence.
Strengths and Weaknesses
Below is a comparative table summarizing key strengths and weaknesses of Leidos Holdings, Inc. (LDOS) and EPAM Systems, Inc. (EPAM) based on their latest financial and operational data.
| Criterion | Leidos Holdings, Inc. (LDOS) | EPAM Systems, Inc. (EPAM) |
|---|---|---|
| Diversification | High: Strong presence in National Security, Defense, and Civil sectors with multi-billion revenues across segments | Moderate: Diverse client base across multiple industry verticals but less concentrated revenue streams |
| Profitability | Favorable: ROIC 13.85%, ROE 28.42%, net margin 7.53%, creating value above WACC | Neutral to unfavorable: ROIC 10.67% below WACC 11.76%, net margin 9.61%, shedding value |
| Innovation | Moderate: Strong in defense tech and cybersecurity, but less emphasis on rapid innovation | High: Focus on software, hi-tech sectors and emerging verticals suggest strong innovation potential |
| Global presence | Strong: National and international contracts in defense and civil markets worldwide | Strong: Global delivery model with clients in multiple regions and sectors |
| Market Share | Large in defense and security sectors, with steady growth in civil markets | Growing in IT services and digital engineering but facing margin pressure and competitive challenges |
In summary, Leidos Holdings demonstrates a durable competitive advantage with strong profitability and diversification in defense and civil sectors. EPAM Systems, while innovative and well-diversified across industries, currently faces challenges in profitability and value creation, warranting cautious consideration.
Risk Analysis
Below is a comparative table highlighting key risk metrics for Leidos Holdings, Inc. (LDOS) and EPAM Systems, Inc. (EPAM) based on their latest financials and market conditions in 2026.
| Metric | Leidos Holdings, Inc. (LDOS) | EPAM Systems, Inc. (EPAM) |
|---|---|---|
| Market Risk | Beta 0.59 (lower volatility) | Beta 1.73 (higher volatility) |
| Debt level | Debt-to-Equity 1.2 (high) | Debt-to-Equity 0.04 (very low) |
| Regulatory Risk | Moderate (defense & government contracts) | Moderate (global IT services) |
| Operational Risk | Medium (complex defense projects) | Medium (software delivery and integration) |
| Environmental Risk | Moderate (infrastructure & health sectors) | Low (primarily software focused) |
| Geopolitical Risk | High (US defense exposure, allied operations) | Medium (global client base, geopolitical tensions) |
Leidos faces elevated geopolitical and debt risks due to its heavy involvement in defense and government contracts and significant leverage. EPAM carries higher market volatility but benefits from low debt and less environmental exposure. Investors should weigh Leidos’ stable cash flow against its leverage and geopolitical sensitivities, while EPAM’s growth potential comes with greater price fluctuation and regulatory complexity.
Which Stock to Choose?
Leidos Holdings, Inc. (LDOS) shows a favorable income evolution with strong growth in net margin and EPS over 2020–2024. Its financial ratios are slightly favorable, highlighting good profitability (ROE 28.42%) but some debt concerns (D/E 1.2). The firm’s very favorable rating and very strong scores support a solid financial standing and a durable competitive advantage.
EPAM Systems, Inc. (EPAM) presents a favorable income statement overall, though with slower recent revenue growth and a declining net margin trend. Its financial ratios are slightly favorable but include unfavorable metrics such as higher WACC and valuation ratios. EPAM’s very favorable rating and strong financial scores contrast with a very unfavorable moat evaluation, signaling declining profitability and value destruction.
For investors prioritizing stable profitability and durable competitive advantage, LDOS might appear more favorable, while those with tolerance for value fluctuation and a focus on growth potential could find EPAM’s profile more aligned with their strategy. Each stock’s evaluation suggests different risk–return trade-offs depending on investor preferences.
Disclaimer: Investment carries a risk of loss of initial capital. The past performance is not a reliable indicator of future results. Be sure to understand risks before making an investment decision.
Go Further
I encourage you to read the complete analyses of Leidos Holdings, Inc. and EPAM Systems, Inc. to enhance your investment decisions: