Home > Comparison > Technology > IBM vs EPAM
The strategic rivalry between International Business Machines Corporation and EPAM Systems, Inc. shapes the Information Technology Services sector. IBM operates as a diversified technology conglomerate with strong software, consulting, and infrastructure segments. EPAM delivers specialized digital engineering and software development services, emphasizing innovation and agility. This analysis pits IBM’s scale and stability against EPAM’s growth and adaptability to identify which offers a superior risk-adjusted return for a diversified portfolio.
Table of contents
Companies Overview
Two giants shape the Information Technology Services landscape: International Business Machines Corporation and EPAM Systems, Inc.
International Business Machines Corporation: Integrated Solutions Powerhouse
IBM dominates as a global leader in integrated solutions and services. Its revenue streams come from software, consulting, infrastructure, and financing segments. In 2026, IBM focuses strategically on hybrid cloud platforms and enterprise AI, leveraging Red Hat’s open-source software to enhance business automation and security.
EPAM Systems, Inc.: Digital Engineering Specialist
EPAM leads in digital platform engineering and software development worldwide. It earns through engineering, infrastructure management, and consulting services. In 2026, EPAM sharpens its edge in smart automation and digital service design, targeting industries like financial services and healthcare with innovation in AI and virtual reality.
Strategic Collision: Similarities & Divergences
IBM adopts a hybrid cloud and open-source model, while EPAM emphasizes digital engineering and automation. They compete primarily in enterprise IT transformation. IBM offers a broader, integrated portfolio, whereas EPAM delivers specialized, agile digital development services, defining distinct risk and growth profiles for investors.
Income Statement Comparison
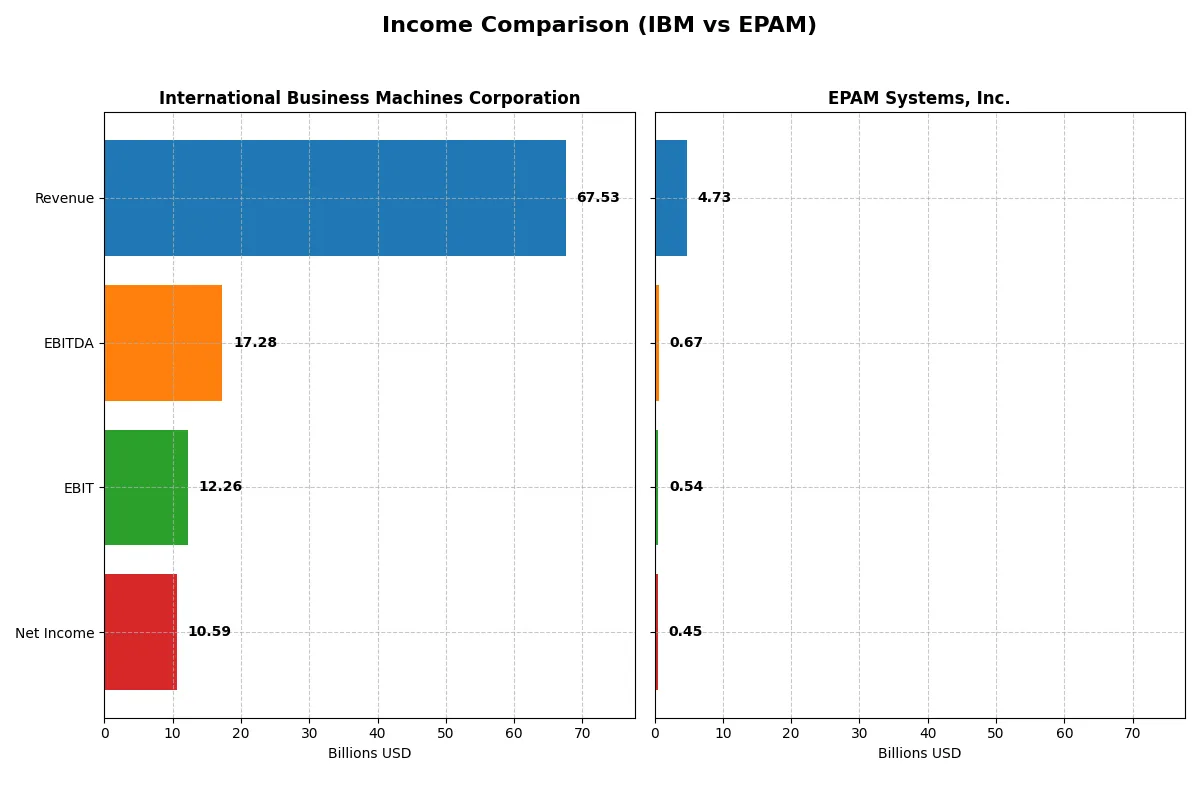
This data dissects the core profitability and scalability of both corporate engines to reveal who dominates the bottom line:
| Metric | International Business Machines Corporation (IBM) | EPAM Systems, Inc. (EPAM) |
|---|---|---|
| Revenue | 67.5B | 4.73B |
| Cost of Revenue | 27.4B | 3.28B |
| Operating Expenses | 29.9B | 906M |
| Gross Profit | 40.2B | 1.45B |
| EBITDA | 17.3B | 672M |
| EBIT | 12.3B | 545M |
| Interest Expense | 1.94B | 0 |
| Net Income | 10.6B | 455M |
| EPS | 11.36 | 7.93 |
| Fiscal Year | 2025 | 2024 |
Income Statement Analysis: The Bottom-Line Duel
The income statement comparison reveals which company drives superior operational efficiency and bottom-line growth through evolving revenue and margin dynamics.
International Business Machines Corporation (IBM) Analysis
IBM’s revenue climbed steadily from $57.4B in 2021 to $67.5B in 2025, showing a 7.6% rise in the latest year. Net income surged sharply, doubling from $5.7B in 2021 to $10.6B in 2025. The company maintains strong gross (59.5%) and net margins (15.7%), reflecting robust cost controls. In 2025, IBM’s EBIT margin expanded to 18.2%, signaling improved operational leverage and solid momentum.
EPAM Systems, Inc. (EPAM) Analysis
EPAM’s revenue grew impressively by 77.8% over 2020-2024 but slowed to 0.8% in the latest year, reaching $4.7B. Net income rose moderately to $455M in 2024, supported by a 9.6% net margin, which remains healthy though lower than IBM’s. EPAM’s gross margin stands at 30.7%, indicating a leaner cost structure but less pricing power. The EBIT margin of 11.5% in 2024 signals steady efficiency gains despite revenue growth deceleration.
Steady Scale vs. High Growth Momentum
IBM dominates in absolute scale and margin strength, delivering consistent revenue and profit expansion with improving operational efficiency. EPAM excels in rapid revenue growth over several years but faces margin pressure and recent stagnation. IBM’s profile suits investors prioritizing profitability and margin resilience, while EPAM appeals to those focused on growth potential amid margin variability.
Financial Ratios Comparison
These vital ratios act as a diagnostic tool to expose the underlying fiscal health, valuation premiums, and capital efficiency of the companies compared below:
| Ratios | International Business Machines Corporation (IBM) | EPAM Systems, Inc. (EPAM) |
|---|---|---|
| ROE | 22.06% (2024) | 12.52% (2024) |
| ROIC | 9.17% (2024) | 10.67% (2024) |
| P/E | 34.21 (2024) | 29.47 (2024) |
| P/B | 7.54 (2024) | 3.69 (2024) |
| Current Ratio | 1.04 (2024) | 2.96 (2024) |
| Quick Ratio | 1.00 (2024) | 2.96 (2024) |
| D/E | 2.14 (2024) | 0.04 (2024) |
| Debt-to-Assets | 42.57% (2024) | 3.44% (2024) |
| Interest Coverage | 5.88 (2024) | 0 (no debt) |
| Asset Turnover | 0.46 (2024) | 1.00 (2024) |
| Fixed Asset Turnover | 7.03 (2024) | 14.07 (2024) |
| Payout ratio | 102.06% (2024) | 0% (no dividends) |
| Dividend yield | 2.98% (2024) | 0% (no dividends) |
| Fiscal Year | 2024 | 2024 |
Efficiency & Valuation Duel: The Vital Signs
Ratios serve as the company’s DNA, exposing hidden risks and operational strengths vital for investment decisions.
International Business Machines Corporation
IBM posts a favorable net margin of 15.69% but reports zero ROE and ROIC, signaling weak profitability efficiency. The P/E of 26.07 appears stretched versus sector norms. IBM rewards shareholders with a 2.27% dividend yield, indicating a preference for income over aggressive reinvestment or growth.
EPAM Systems, Inc.
EPAM reports a modest net margin of 9.61% and a neutral 12.52% ROE, reflecting balanced profitability. A higher P/E of 29.47 suggests the stock is expensive relative to earnings. EPAM offers no dividends, instead directing capital to growth and operational efficiency, supported by strong liquidity ratios and low leverage.
Premium Valuation vs. Operational Safety
IBM’s dividend yield offers steady income but lacks profitability depth, while EPAM’s growth focus comes with a premium valuation. EPAM provides a better liquidity and leverage profile, suiting investors prioritizing operational safety. IBM fits those seeking income with moderate risk tolerance.
Which one offers the Superior Shareholder Reward?
I see IBM delivers steady dividends with a 2.27% yield and a sustainable 59% payout ratio, supported by strong free cash flow coverage above 2x. Share buybacks are moderate, enhancing total returns. EPAM pays no dividends, reinvesting heavily in growth and acquisitions, with free cash flow reinvestment near 94%. Its buyback activity is minimal but financial leverage is low, preserving balance sheet strength. For 2026, IBM’s balanced dividend and buyback policy offer more reliable shareholder rewards, while EPAM’s high-growth reinvestment suits risk-tolerant investors. I favor IBM for superior total return and sustainability in current market conditions.
Comparative Score Analysis: The Strategic Profile
The radar chart reveals the fundamental DNA and trade-offs of International Business Machines Corporation and EPAM Systems, Inc., highlighting their distinctive financial strengths and weaknesses:
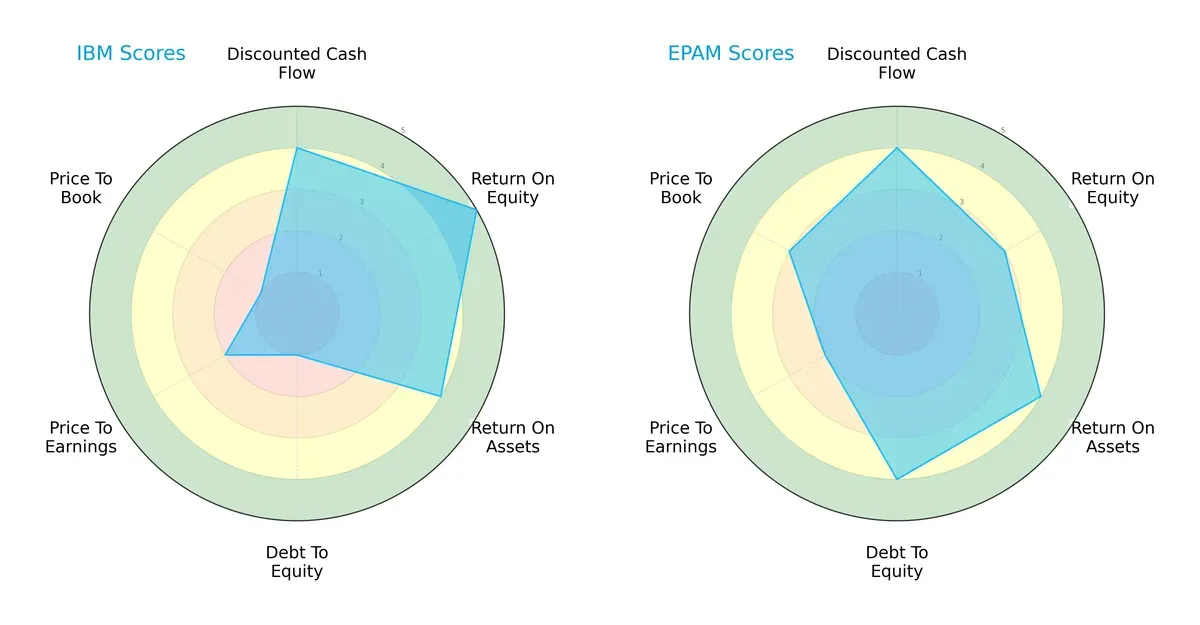
IBM boasts a very favorable ROE score of 5, outperforming EPAM’s moderate 3, signaling superior shareholder profitability. EPAM counters with a stronger debt-to-equity score of 4 versus IBM’s very unfavorable 1, indicating robust balance sheet discipline. Both share favorable DCF scores of 4, but IBM’s valuation metrics lag with very unfavorable P/B and moderate P/E scores, while EPAM presents moderate valuations. EPAM demonstrates a more balanced profile, leveraging financial stability, whereas IBM relies heavily on operational efficiency but carries higher financial risk.
Bankruptcy Risk: Solvency Showdown
The Altman Z-Score comparison shows EPAM’s commanding 9.0 score well above IBM’s 3.5, placing both in the safe zone but with a significant solvency gap:
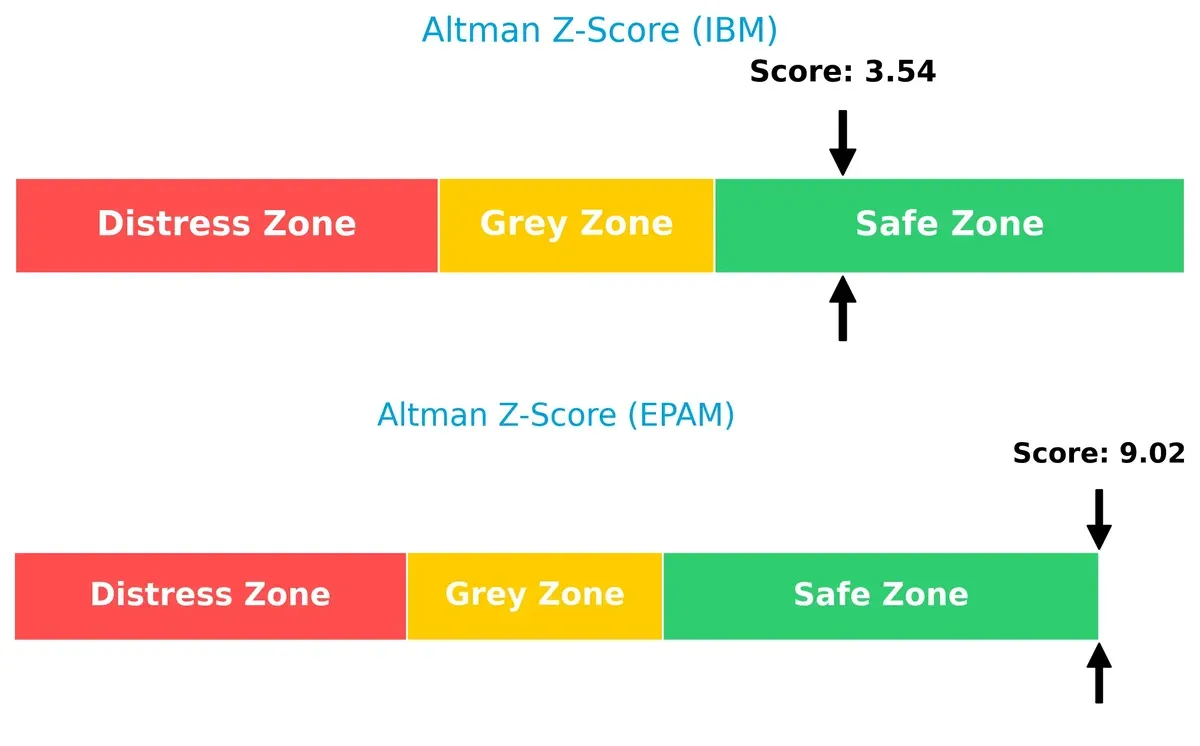
EPAM’s elevated Z-Score signals exceptional resilience and a very low bankruptcy risk, reflecting strong profitability and liquidity in this cycle. IBM remains safe but closer to the threshold, suggesting investors should monitor its financial leverage carefully.
Financial Health: Quality of Operations
EPAM’s Piotroski F-Score of 7 surpasses IBM’s average 5, indicating stronger internal financial health and operational quality:
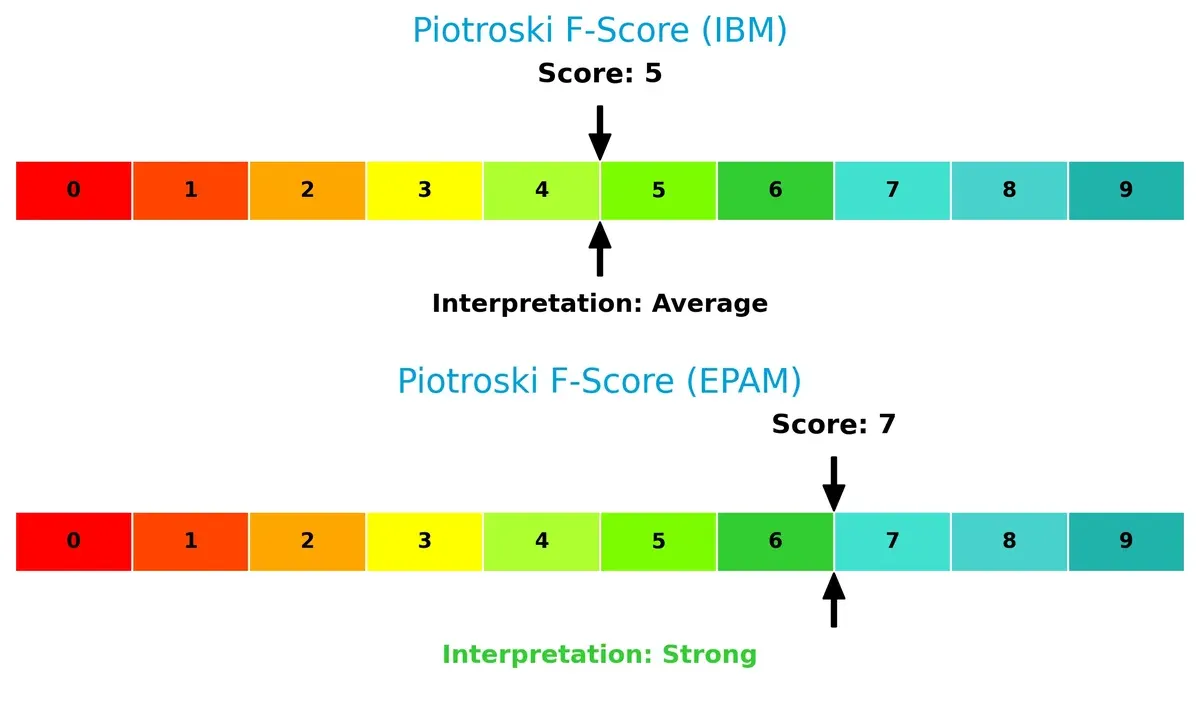
EPAM exhibits fewer red flags, with better profitability, liquidity, and efficiency metrics. IBM’s average score flags potential internal weaknesses, warranting cautious scrutiny from investors seeking durable financial strength.
How are the two companies positioned?
This section dissects IBM and EPAM’s operational DNA by comparing their revenue distribution and internal dynamics. The goal is to confront their economic moats to reveal which model delivers the most resilient competitive advantage today.
Revenue Segmentation: The Strategic Mix
This comparison dissects how International Business Machines Corporation and EPAM Systems diversify their income streams and where their primary sector bets lie:
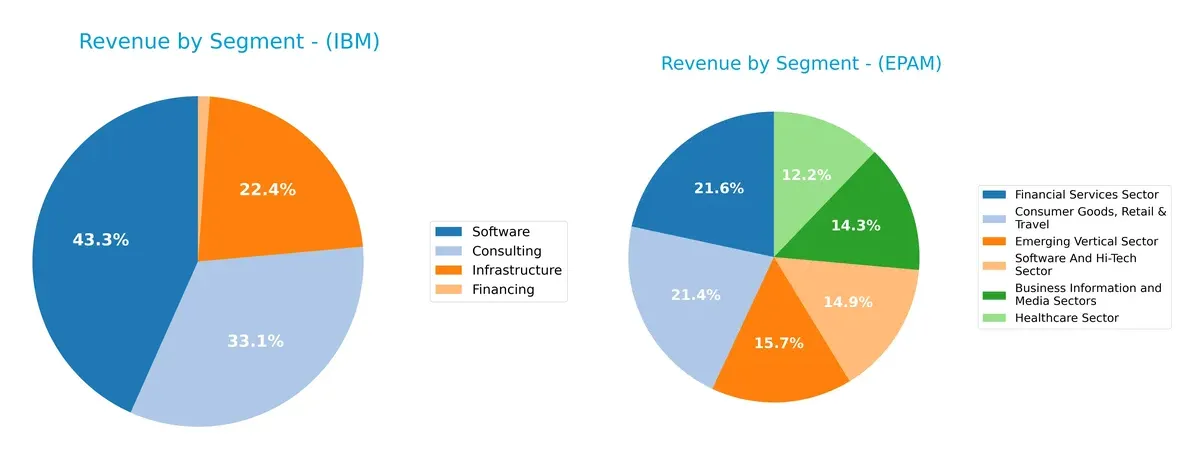
IBM anchors its revenue in Software at $27B and Consulting at $20.7B, complemented by Infrastructure at $14B. EPAM displays a more balanced spread, with Consumer Goods, Retail & Travel at $1B and Financial Services at $1B, plus several sectors near $700M. IBM’s concentration in high-margin software and consulting reveals ecosystem lock-in. EPAM’s diverse verticals reduce concentration risk but may dilute scale advantages.
Strengths and Weaknesses Comparison
This table compares the Strengths and Weaknesses of IBM and EPAM Systems:
IBM Strengths
- Diversified revenue streams across Software, Consulting, Infrastructure, and Financing
- Strong global presence in Americas, EMEA, Asia Pacific
- Favorable net margin at 15.7%
- Low debt-to-assets ratio and solid interest coverage
- Dividend yield of 2.27% supports shareholder returns
EPAM Strengths
- Diversified client sectors including Financial, Healthcare, Retail, and Hi-Tech
- Favorable liquidity ratios with current and quick ratios at 2.96
- Low debt-to-assets ratio and infinite interest coverage
- High fixed asset turnover at 14.07 indicating efficient asset use
- Growing presence in US, UK, Germany, Switzerland, and other countries
IBM Weaknesses
- Unfavorable ROE and ROIC at 0%, indicating poor capital returns
- Unavailable WACC limits cost of capital analysis
- Unfavorable liquidity ratios with current and quick ratios at 0
- Unfavorable asset turnover metrics suggest lower operational efficiency
- Elevated P/E ratio of 26.07 may imply overvaluation
EPAM Weaknesses
- ROIC at 10.67% below WACC of 11.82%, indicating value destruction
- Unfavorable P/E of 29.47 and PB of 3.69 reflect high valuation
- Net margin and ROE neutral, showing moderate profitability
- No dividend yield, limiting income appeal
- Neutral asset turnover at 1.0 indicates average asset use
IBM demonstrates strong global diversification and profitability but faces capital efficiency and liquidity challenges. EPAM shows healthy liquidity and asset efficiency but contends with valuation concerns and a need to improve returns relative to capital cost. Both firms must balance growth with financial discipline in their strategies.
The Moat Duel: Analyzing Competitive Defensibility
A structural moat alone safeguards long-term profits from relentless competitive erosion by creating durable barriers to entry and value destruction:
International Business Machines Corporation: Intangible Assets and Hybrid Cloud Expertise
IBM leverages its vast intangible assets and hybrid cloud platform to sustain high gross margins (59.5%) and stable EBIT margins (18.16%). Its consulting and software integration deepen client stickiness. Yet, declining ROIC signals caution as market shifts in 2026 may threaten legacy segments.
EPAM Systems, Inc.: Agile Digital Engineering and Client-Centric Innovation
EPAM’s moat stems from specialized digital engineering services and agile delivery, differentiating it from IBM’s scale-based moat. However, a negative ROIC-WACC spread and shrinking profitability reflect difficulty sustaining excess returns. EPAM’s growth hinges on expanding AI and automation services amid fierce competition.
Moat Battle: Intangible Legacy vs. Agile Digital Engineering
IBM’s intangible asset moat is broader and financially stronger than EPAM’s fragile, narrowing moat. Despite IBM’s ROIC decline, its scale and margin stability better defend market share. EPAM faces steeper risks and must innovate aggressively to maintain relevance.
Which stock offers better returns?
Over the past 12 months, IBM’s stock surged 56.5% but with decelerating momentum, while EPAM declined 32.6% despite recent accelerated gains.
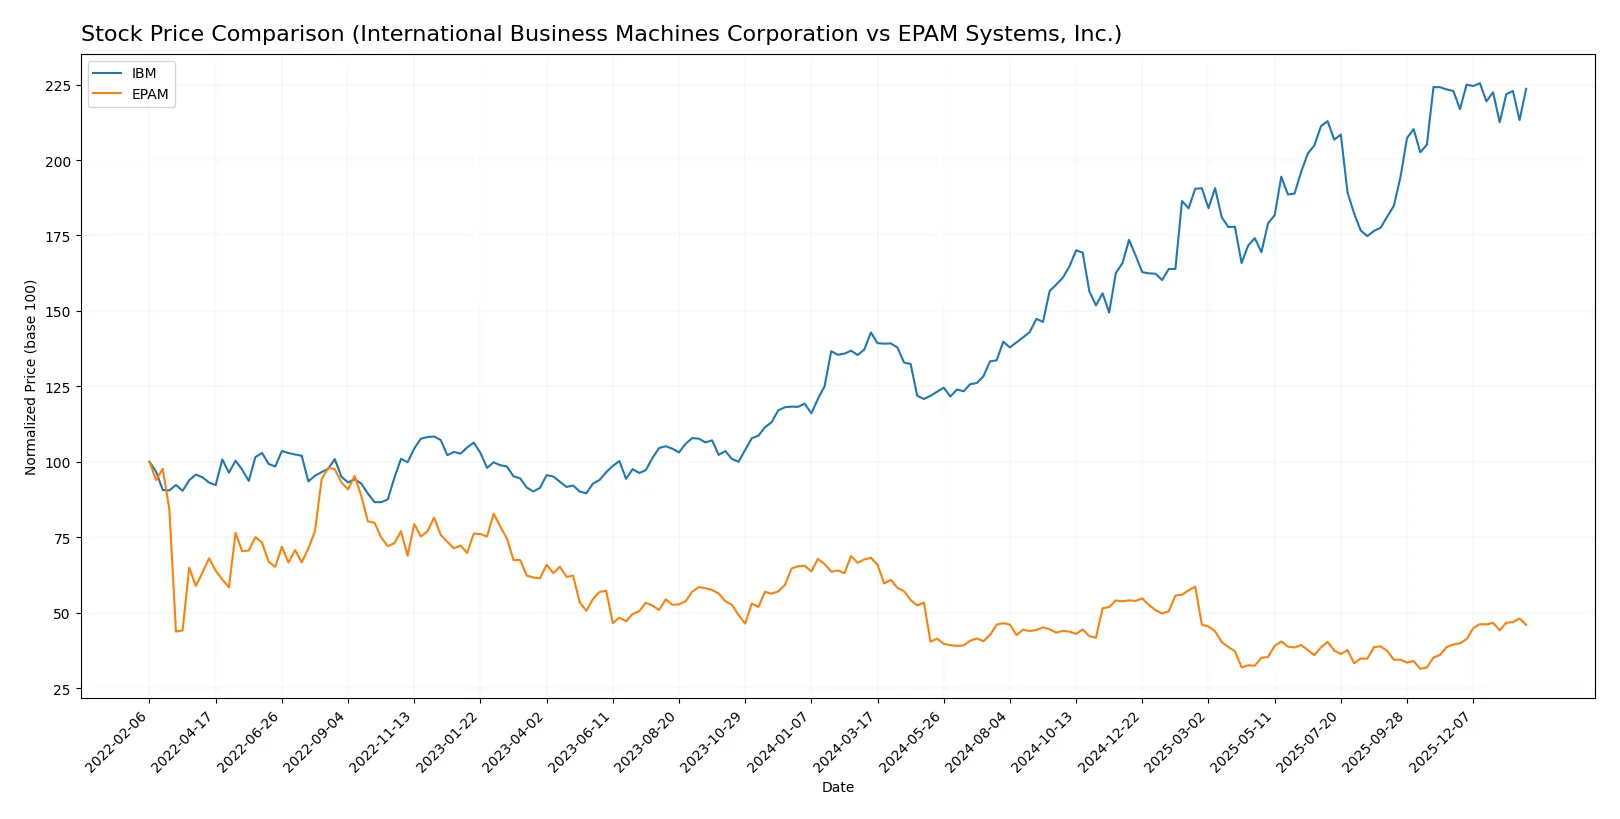
Trend Comparison
IBM’s stock shows a bullish trend over the last year with a 56.5% gain, but recent months reveal a neutral 0.33% change and slight deceleration. Volatility remains high at a 43.36 standard deviation.
EPAM’s stock displays a bearish annual trend, down 32.6%, though recent weeks show a strong 16.5% rebound with accelerating momentum and moderate volatility at 36.08 standard deviation.
IBM outperforms EPAM in total returns over the year. EPAM’s recent rally narrows the gap but has not surpassed IBM’s overall market performance.
Target Prices
Analysts present a bullish consensus for IBM and a moderately optimistic outlook for EPAM Systems.
| Company | Target Low | Target High | Consensus |
|---|---|---|---|
| International Business Machines Corporation | 304 | 380 | 349.5 |
| EPAM Systems, Inc. | 175 | 247 | 214 |
IBM’s target consensus sits approximately 14% above its current price of $307, indicating upside potential. EPAM’s consensus target is near 3% above its current price of $209, reflecting more moderate expectations.

Don’t Let Luck Decide Your Entry Point
Optimize your entry points with our advanced ProRealTime indicators. You’ll get efficient buy signals with precise price targets for maximum performance. Start outperforming now!
How do institutions grade them?
Here are the latest institutional grades for International Business Machines Corporation and EPAM Systems, Inc.:
International Business Machines Corporation Grades
The table below shows recent grades from respected financial institutions for IBM:
| Grading Company | Action | New Grade | Date |
|---|---|---|---|
| JP Morgan | Maintain | Neutral | 2026-01-29 |
| Evercore ISI Group | Maintain | Outperform | 2026-01-29 |
| RBC Capital | Maintain | Outperform | 2026-01-29 |
| Jefferies | Maintain | Buy | 2026-01-29 |
| UBS | Maintain | Sell | 2026-01-29 |
| Stifel | Maintain | Buy | 2026-01-29 |
| Wedbush | Maintain | Outperform | 2026-01-29 |
| JP Morgan | Maintain | Neutral | 2026-01-21 |
| Evercore ISI Group | Maintain | Outperform | 2026-01-20 |
| B of A Securities | Maintain | Buy | 2026-01-13 |
EPAM Systems, Inc. Grades
Below are recent grades from established firms for EPAM Systems, Inc.:
| Grading Company | Action | New Grade | Date |
|---|---|---|---|
| Citigroup | Maintain | Neutral | 2026-01-29 |
| Wells Fargo | Maintain | Overweight | 2026-01-14 |
| TD Cowen | Maintain | Buy | 2026-01-09 |
| Mizuho | Maintain | Outperform | 2025-11-11 |
| JP Morgan | Maintain | Overweight | 2025-11-07 |
| Morgan Stanley | Maintain | Equal Weight | 2025-09-09 |
| JP Morgan | Maintain | Overweight | 2025-08-20 |
| Barclays | Maintain | Overweight | 2025-05-12 |
| Needham | Maintain | Buy | 2025-05-09 |
| Piper Sandler | Maintain | Neutral | 2025-05-09 |
Which company has the best grades?
EPAM holds relatively stronger grades, with multiple “Buy” and “Overweight” ratings. IBM shows a mix of “Outperform” and “Buy,” but also some “Neutral” and a “Sell.” EPAM’s more consistent positive outlook suggests higher analyst confidence, potentially influencing investor sentiment favorably.
Risks specific to each company
The following categories identify the critical pressure points and systemic threats facing both firms in the 2026 market environment:
1. Market & Competition
International Business Machines Corporation
- Faces intense competition from cloud and AI providers; legacy business segments pressure margins.
EPAM Systems, Inc.
- Operates in a highly competitive digital engineering space with rising demands for innovation and client retention.
2. Capital Structure & Debt
International Business Machines Corporation
- Strong interest coverage at 6.34 times but shows unfavorable debt-to-equity and liquidity ratios.
EPAM Systems, Inc.
- Maintains low debt levels with strong current and quick ratios, indicating solid financial flexibility.
3. Stock Volatility
International Business Machines Corporation
- Beta of 0.7 suggests lower volatility than the market, offering defensive characteristics.
EPAM Systems, Inc.
- High beta of 1.73 signals elevated stock volatility, increasing market risk for investors.
4. Regulatory & Legal
International Business Machines Corporation
- Faces regulatory scrutiny in multiple jurisdictions due to size and global operations.
EPAM Systems, Inc.
- Potential exposure to data privacy and cybersecurity regulations given digital services focus.
5. Supply Chain & Operations
International Business Machines Corporation
- Complex infrastructure segment exposed to supply chain disruptions and hardware demand cycles.
EPAM Systems, Inc.
- Relies on skilled labor and offshore delivery, vulnerable to talent shortages and geopolitical shifts.
6. ESG & Climate Transition
International Business Machines Corporation
- Large carbon footprint from data centers and manufacturing; ongoing transition to sustainable practices.
EPAM Systems, Inc.
- Lower direct emissions but faces pressure to demonstrate ESG compliance across global operations.
7. Geopolitical Exposure
International Business Machines Corporation
- Significant global footprint exposes it to trade tensions, regulatory changes, and currency risks.
EPAM Systems, Inc.
- Concentrated Eastern European presence raises geopolitical uncertainty amid regional conflicts.
Which company shows a better risk-adjusted profile?
IBM’s largest risk lies in its capital structure and legacy operational complexity, with liquidity and debt concerns posing threats. EPAM’s biggest risk is its stock volatility and geopolitical exposure, despite strong financial metrics. Overall, EPAM displays a better risk-adjusted profile, supported by its higher Altman Z-score of 9.02 and strong Piotroski score of 7, reflecting financial robustness and operational efficiency amid market turbulence.
Final Verdict: Which stock to choose?
International Business Machines Corporation (IBM) excels as a resilient cash generator with a strong income quality and improving profitability. Its main point of vigilance remains the mixed signals from its balance sheet, especially in liquidity ratios. IBM suits investors aiming for steady income and value with moderate growth aspirations.
EPAM Systems, Inc. stands out with a strategic moat built on operational efficiency and a solid balance sheet marked by high liquidity and low leverage. While its ROIC trend signals caution, EPAM offers a more growth-oriented profile with better financial stability than IBM. It fits well in a GARP (Growth at a Reasonable Price) portfolio seeking exposure to tech-driven expansion.
If you prioritize stable cash flow and dividend income, IBM is the compelling choice due to its consistent profitability and market resilience. However, if you seek growth with a strong financial cushion and operational agility, EPAM offers better stability and upside potential despite its recent valuation pressures. Each company appeals distinctly to different investor profiles, underscoring the importance of aligning stock selection with your risk tolerance and investment horizon.
Disclaimer: Investment carries a risk of loss of initial capital. The past performance is not a reliable indicator of future results. Be sure to understand risks before making an investment decision.
Go Further
I encourage you to read the complete analyses of International Business Machines Corporation and EPAM Systems, Inc. to enhance your investment decisions: