In the competitive world of information technology services, EPAM Systems, Inc. and Globant S.A. stand out as innovative leaders driving digital transformation. Both companies offer cutting-edge software development and consulting services, targeting overlapping markets with strong emphasis on technology and customer experience. This comparative analysis will help investors understand which company presents the most compelling opportunity for their portfolio in 2026. Let’s explore their strengths and potential together.

Table of contents
Companies Overview
I will begin the comparison between EPAM Systems, Inc. and Globant S.A. by providing an overview of these two companies and their main differences.
EPAM Overview
EPAM Systems, Inc. is a US-based technology company specializing in digital platform engineering and software development services globally. Its offerings include engineering services, infrastructure management, maintenance, support, and consulting across industries like financial services, healthcare, and software. Founded in 1993 and headquartered in Newtown, Pennsylvania, EPAM employs over 61K people and focuses on enhancing software testing, automation, and digital design solutions.
Globant Overview
Globant S.A. is a Luxembourg-based technology services firm providing a broad range of digital solutions worldwide. Its services cover e-commerce, cloud transformation, data strategies, AI, cybersecurity, and industry-specific offerings such as healthcare and media. Founded in 2003, Globant operates with around 31K employees and emphasizes innovation through platforms like PagoChat and ShopChat, aiming to support digital experience and agile delivery.
Key similarities and differences
Both EPAM and Globant operate in the technology services sector, delivering digital transformation and consulting worldwide. Each company serves multiple industries, leveraging software development, cloud, and automation technologies. However, EPAM is larger with nearly double the workforce and a longer market presence, focusing strongly on engineering and infrastructure, while Globant emphasizes platform innovation, agile methodologies, and specialized digital experiences. Their geographic bases also differ, with EPAM in the US and Globant in Luxembourg.
Income Statement Comparison
Below is a comparison of key income statement metrics for EPAM Systems, Inc. and Globant S.A. based on their most recent fiscal year data.
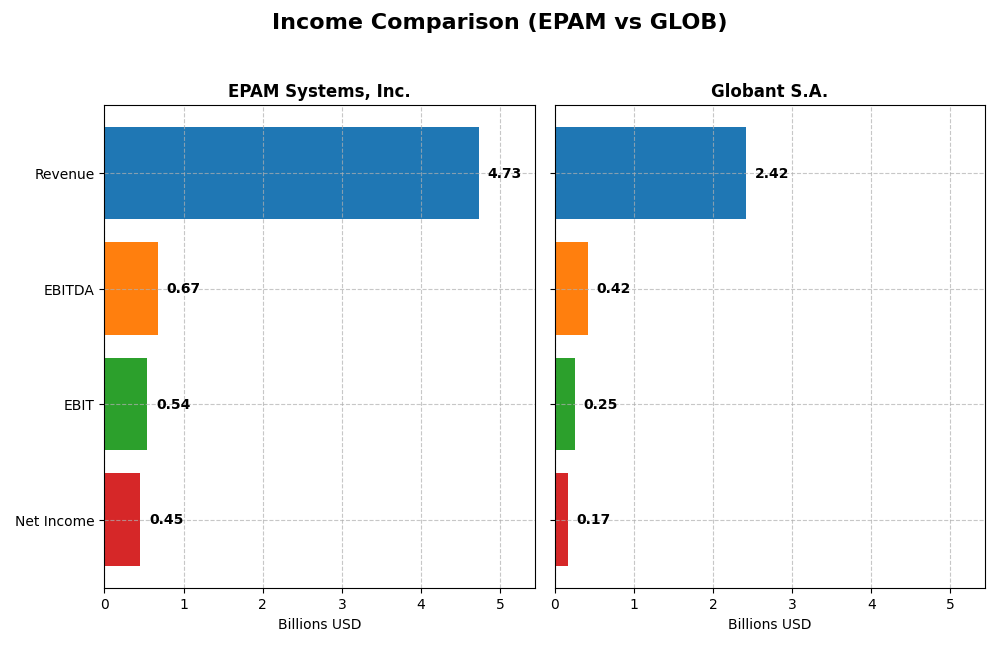
| Metric | EPAM Systems, Inc. | Globant S.A. |
|---|---|---|
| Market Cap | 12.2B | 3.0B |
| Revenue | 4.73B | 2.42B |
| EBITDA | 672M | 417M |
| EBIT | 545M | 254M |
| Net Income | 455M | 166M |
| EPS | 7.93 | 3.82 |
| Fiscal Year | 2024 | 2024 |
Income Statement Interpretations
EPAM Systems, Inc.
EPAM’s revenue showed steady growth from 2020 to 2024, increasing by 77.78%, while net income rose by 38.93% over the same period. Gross and EBIT margins remained favorable, though net margin declined by 21.85%. In 2024, revenue growth slowed to 0.8%, but net margin improved by 8.12%, indicating some margin recovery despite slower top-line expansion.
Globant S.A.
Globant experienced robust revenue growth of 196.72% from 2020 to 2024, with net income surging by 205.68%. Margins, including gross and EBIT, remained favorable and stable, with a slight net margin growth of 3.02% overall. In 2024, revenue grew strongly by 15.26%, but net margin contracted by 9.3%, reflecting margin pressures despite solid top-line expansion.
Which one has the stronger fundamentals?
Both companies display favorable income statements overall, with EPAM showing consistent margins and moderate recent revenue growth, while Globant exhibits higher revenue and net income growth but slight margin compression in 2024. EPAM’s stable margins contrast with Globant’s stronger growth but recent margin squeeze, suggesting differing strengths in fundamentals depending on growth versus profitability focus.
Financial Ratios Comparison
Below is a comparison of key financial ratios for EPAM Systems, Inc. and Globant S.A. based on their most recent fiscal year data (2024).
| Ratios | EPAM Systems, Inc. | Globant S.A. |
|---|---|---|
| ROE | 12.5% | 8.4% |
| ROIC | 10.7% | 6.8% |
| P/E | 29.5 | 57.6 |
| P/B | 3.69 | 4.86 |
| Current Ratio | 2.96 | 1.54 |
| Quick Ratio | 2.96 | 1.54 |
| D/E (Debt-to-Equity) | 0.045 | 0.209 |
| Debt-to-Assets | 3.4% | 13.0% |
| Interest Coverage | 0 | 7.87 |
| Asset Turnover | 1.00 | 0.76 |
| Fixed Asset Turnover | 14.07 | 8.70 |
| Payout Ratio | 0 | 0 |
| Dividend Yield | 0% | 0% |
Interpretation of the Ratios
EPAM Systems, Inc.
EPAM shows a mixed ratio profile with strong liquidity, low leverage, and excellent interest coverage, but faces unfavorable valuations with high PE and PB ratios and underwhelming ROIC below WACC. Its net margin and ROE are neutral, reflecting moderate profitability. EPAM does not pay dividends, likely reinvesting earnings to support growth and maintain operational strength.
Globant S.A.
Globant presents favorable liquidity and leverage ratios with reasonable interest coverage, though profitability ratios like ROE and ROIC are weaker or neutral. Valuation ratios appear stretched, especially PE and PB, signaling high market expectations. The company also pays no dividend, possibly due to reinvestment in innovation and expansion rather than shareholder payouts.
Which one has the best ratios?
Both EPAM and Globant exhibit slightly favorable overall ratio profiles with 42.86% favorable ratios. EPAM’s stronger liquidity and lower debt contrast with Globant’s better interest coverage but weaker profitability metrics. Neither pays dividends, and both show valuation concerns, making their ratio advantages dependent on investor priorities.
Strategic Positioning
This section compares the strategic positioning of EPAM Systems and Globant, including market position, key segments, and exposure to technological disruption:
EPAM
- Large market cap with high beta, facing strong competition in IT services globally.
- Serves multiple sectors including financial services, healthcare, retail, media, and emerging verticals.
- Focuses on digital platform engineering, software development, testing, and smart automation.
GLOB
- Smaller market cap and lower beta, competing in global IT services with diversified offerings.
- Broad technology services spanning e-commerce, healthcare, cloud, data, gaming, and digital platforms.
- Emphasizes digital transformation, cloud services, AI, blockchain, cybersecurity, and metaverse.
EPAM vs GLOB Positioning
EPAM pursues a diversified sector approach with a broad client base, while Globant focuses on a wide array of innovative digital and technology service offerings. EPAM’s scale offers breadth; Globant’s specialization targets emerging tech trends.
Which has the best competitive advantage?
Both companies are shedding value with ROIC below WACC, but Globant shows a slightly unfavorable moat with improving profitability, whereas EPAM has a very unfavorable moat with declining returns and value destruction.
Stock Comparison
The past year saw both EPAM Systems, Inc. and Globant S.A. experience significant price declines with accelerating bearish trends, while recent months indicate a notable short-term price recovery for both stocks.
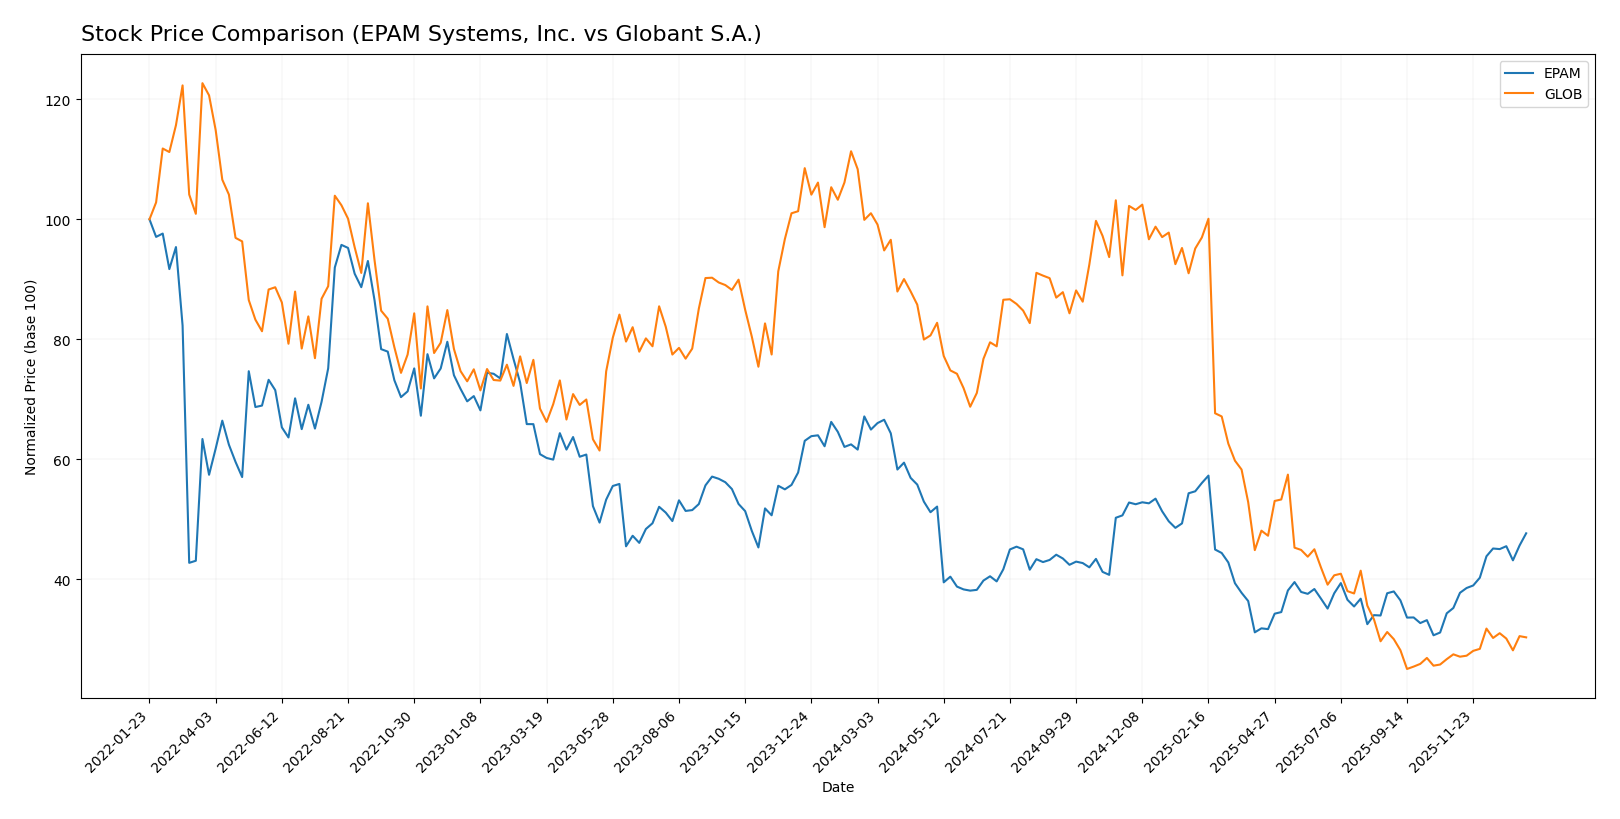
Trend Analysis
EPAM Systems, Inc. posted a 26.64% price decline over the past 12 months, confirming an accelerating bearish trend with high volatility (std deviation 38.96). The stock reached a high of 309.4 and a low of 142.38, followed by a strong recent rebound of 35.38%.
Globant S.A. suffered a more severe 70.01% drop in the same period, also under an accelerating bearish trend with even higher volatility (std deviation 61.44). Its price ranged between 231.36 and 56.11, with a moderate recent recovery of 10.31%.
Comparing both, EPAM Systems, Inc. delivered the highest market performance over the last year despite the bearish trend, supported by a stronger short-term rebound than Globant S.A.
Target Prices
Analysts provide a clear target price consensus for EPAM Systems, Inc. and Globant S.A., reflecting moderate upside potential.
| Company | Target High | Target Low | Consensus |
|---|---|---|---|
| EPAM Systems, Inc. | 247 | 175 | 214 |
| Globant S.A. | 80 | 68 | 72.5 |
The consensus target prices for EPAM and Globant indicate expected gains above current prices of $221.4 and $67.93, respectively, suggesting positive analyst sentiment but with some risk given the ranges.
Analyst Opinions Comparison
This section compares analysts’ ratings and financial scores for EPAM Systems, Inc. and Globant S.A.:
Rating Comparison
EPAM Rating
- Rating: A- indicating a very favorable overall evaluation.
- Discounted Cash Flow Score: 4, favorable indication of valuation.
- ROE Score: 3, moderate efficiency in generating profit from equity.
- ROA Score: 4, favorable use of assets to generate earnings.
- Debt To Equity Score: 4, favorable, showing lower financial risk.
- Overall Score: 4, favorable overall financial standing.
GLOB Rating
- Rating: A- indicating a very favorable overall evaluation.
- Discounted Cash Flow Score: 5, very favorable, suggesting strong valuation.
- ROE Score: 3, moderate efficiency in generating profit from equity.
- ROA Score: 3, moderate effectiveness in utilizing assets for earnings.
- Debt To Equity Score: 3, moderate, indicating higher financial risk.
- Overall Score: 4, favorable overall financial standing.
Which one is the best rated?
Both EPAM and GLOB share the same overall rating of A- and an overall score of 4, indicating favorable financial standings. GLOB has a higher discounted cash flow score, while EPAM scores better on return on assets and debt-to-equity, showing strengths in different financial aspects.
Scores Comparison
Here is a comparison of the Altman Z-Score and Piotroski Score for EPAM and Globant:
EPAM Scores
- Altman Z-Score: 8.83, indicating a safe zone with low bankruptcy risk.
- Piotroski Score: 7, categorized as strong financial health.
GLOB Scores
- Altman Z-Score: 3.05, also in the safe zone but closer to the threshold.
- Piotroski Score: 5, indicating average financial strength.
Which company has the best scores?
EPAM has a higher Altman Z-Score and a stronger Piotroski Score compared to Globant, suggesting better financial stability and strength based on the provided data.
Grades Comparison
Here is the detailed grades comparison for EPAM Systems, Inc. and Globant S.A.:
EPAM Systems, Inc. Grades
The table below summarizes recent grades issued by established grading companies for EPAM Systems, Inc.:
| Grading Company | Action | New Grade | Date |
|---|---|---|---|
| TD Cowen | Maintain | Buy | 2026-01-09 |
| Mizuho | Maintain | Outperform | 2025-11-11 |
| JP Morgan | Maintain | Overweight | 2025-11-07 |
| Morgan Stanley | Maintain | Equal Weight | 2025-09-09 |
| JP Morgan | Maintain | Overweight | 2025-08-20 |
| Barclays | Maintain | Overweight | 2025-05-12 |
| Guggenheim | Maintain | Buy | 2025-05-09 |
| Morgan Stanley | Maintain | Equal Weight | 2025-05-09 |
| Needham | Maintain | Buy | 2025-05-09 |
| Piper Sandler | Maintain | Neutral | 2025-05-09 |
EPAM’s grades show a consistent pattern of positive recommendations, predominantly maintaining Buy, Outperform, or Overweight ratings.
Globant S.A. Grades
The table below summarizes recent grades issued by established grading companies for Globant S.A.:
| Grading Company | Action | New Grade | Date |
|---|---|---|---|
| Jefferies | Downgrade | Hold | 2025-11-20 |
| UBS | Maintain | Neutral | 2025-11-18 |
| JP Morgan | Maintain | Neutral | 2025-11-14 |
| Needham | Maintain | Buy | 2025-11-14 |
| Canaccord Genuity | Maintain | Hold | 2025-11-14 |
| Goldman Sachs | Maintain | Neutral | 2025-10-09 |
| UBS | Maintain | Neutral | 2025-08-20 |
| Goldman Sachs | Maintain | Neutral | 2025-08-18 |
| Needham | Maintain | Buy | 2025-08-15 |
| JP Morgan | Downgrade | Neutral | 2025-08-15 |
Globant’s grades indicate a more cautious stance, with several Neutral and Hold ratings and a recent downgrade from Buy to Hold by Jefferies.
Which company has the best grades?
EPAM Systems, Inc. has received generally stronger grades than Globant S.A., with more Buy and Outperform ratings compared to Globant’s Neutral and Hold consensus. This suggests that EPAM’s perceived growth potential and risk profile are viewed more favorably by analysts, which may influence investor confidence accordingly.
Strengths and Weaknesses
Below is a comparative table highlighting the key strengths and weaknesses of EPAM Systems, Inc. and Globant S.A. based on recent financial and operational data.
| Criterion | EPAM Systems, Inc. | Globant S.A. |
|---|---|---|
| Diversification | Highly diversified across sectors including Financial Services (1.02B), Consumer Goods (1.01B), Software & Hi-Tech (702M), Healthcare (575M), and Emerging Verticals (741M) | Moderate diversification, focused on digital consulting and software services but less segmented data available |
| Profitability | Neutral net margin (9.61%), ROE 12.52%, but unfavorable ROIC (10.67%) below WACC (11.76%) indicating value shedding | Neutral net margin (6.86%), lower ROE (8.44%), neutral ROIC (6.82%) below WACC (8.92%), slightly unfavorable profitability |
| Innovation | Strong in software development and technology infrastructure with high fixed asset turnover (14.07) | Innovative digital service offerings with growing ROIC trend, indicating improving profitability |
| Global presence | Established global player with broad sector coverage and strong liquidity ratios (current & quick ratio 2.96) | Global presence with solid liquidity (current & quick ratio 1.54) and improving interest coverage |
| Market Share | Large market share in IT services with consistent revenue growth in multiple sectors | Growing market share in digital services but higher valuation multiples (PE 57.64) suggest premium pricing |
Key takeaways: EPAM demonstrates strong diversification and liquidity but struggles with profitability and value creation, reflected in declining ROIC and unfavorable valuation multiples. Globant shows improving profitability with a growing ROIC trend, though it remains slightly unprofitable with premium market valuations. Investors should weigh EPAM’s broad sector coverage against its value destruction and consider Globant’s potential for profitability improvement despite current challenges.
Risk Analysis
Below is a comparative overview of key risk factors for EPAM Systems, Inc. and Globant S.A. as of 2026.
| Metric | EPAM Systems, Inc. | Globant S.A. |
|---|---|---|
| Market Risk | High beta (1.73) indicates higher sensitivity to market fluctuations. | Moderate beta (1.20) shows relatively lower market volatility exposure. |
| Debt level | Very low debt-to-equity ratio (0.04), low debt-to-assets (3.44%) – low leverage risk. | Moderate debt-to-equity ratio (0.21), debt-to-assets (12.95%) – manageable leverage. |
| Regulatory Risk | US-based, exposed to stringent tech and data regulations. | Luxembourg-based, subject to EU regulations, which can be complex and evolving. |
| Operational Risk | Large workforce (61.2K), complex service delivery may pose integration and execution risks. | Smaller workforce (31.3K), diversified tech services but operational complexity in multiple domains. |
| Environmental Risk | Limited direct environmental impact; risk mainly reputational in tech sector. | Similar limited direct impact; growing focus on sustainable business solutions. |
| Geopolitical Risk | US headquarters but global operations; exposed to geopolitical tensions affecting outsourcing. | HQ in Luxembourg with global reach; EU geopolitical dynamics and global market exposure relevant. |
The most impactful and likely risks for both companies are market volatility and regulatory challenges. EPAM’s higher beta signals greater market sensitivity, while Globant faces somewhat higher leverage and moderate geopolitical uncertainties tied to EU policies. Both maintain strong balance sheets, mitigating financial distress risks as reflected in their safe Altman Z-scores.
Which Stock to Choose?
EPAM Systems, Inc. shows a favorable income statement with strong gross and EBIT margins, 9.61% net margin, and steady profitability growth despite a slight revenue slowdown. Its financial ratios reveal a low debt level, solid liquidity, and a mixed rating profile with some unfavorable valuations but a very favorable overall rating. However, the company’s declining ROIC relative to WACC signals value destruction.
Globant S.A. displays robust income growth with 15.26% revenue increase and favorable gross and EBIT margins, though its net margin is lower at 6.86%. Financial ratios indicate moderate leverage and liquidity with a slightly favorable rating, supported by a positive ROIC trend despite ROIC still below WACC, suggesting improving but challenged profitability.
For investors, the choice might depend on risk tolerance and investment focus: those favoring stable profitability and stronger balance sheets could lean toward EPAM’s consistent margins and ratings, while growth-oriented investors might find Globant’s rapid revenue expansion and improving ROIC trend more appealing. Both companies carry risks related to value creation as indicated by their moat evaluations.
Disclaimer: Investment carries a risk of loss of initial capital. The past performance is not a reliable indicator of future results. Be sure to understand risks before making an investment decision.
Go Further
I encourage you to read the complete analyses of EPAM Systems, Inc. and Globant S.A. to enhance your investment decisions: