Home > Comparison > Technology > EPAM vs G
The strategic rivalry between EPAM Systems, Inc. and Genpact Limited shapes the evolution of the global information technology services sector. EPAM operates as a digital platform engineering powerhouse with a focus on software development and engineering consulting. Genpact excels as a business process outsourcing leader emphasizing finance, supply chain, and IT transformation services. This analysis will assess which company’s operational model presents a superior risk-adjusted opportunity for a diversified portfolio.
Table of contents
Companies Overview
EPAM Systems and Genpact Limited stand as influential players in the global information technology services market.
EPAM Systems, Inc.: Digital Platform Engineering Leader
EPAM Systems dominates the digital platform engineering and software development sector worldwide. Its core revenue arises from engineering services, infrastructure management, and comprehensive software testing solutions. In 2026, EPAM emphasizes integrated engineering practices and smart automation to enhance client software ecosystems across industries like financial services and healthcare.
Genpact Limited: Business Process and IT Services Specialist
Genpact Limited excels in business process outsourcing and IT services across diverse sectors including banking, consumer goods, and manufacturing. Its revenue streams stem from finance and accounting services, supply chain advisory, and transformation solutions. In 2026, Genpact focuses on ESG services and digital transformation to optimize client operations globally.
Strategic Collision: Similarities & Divergences
Both companies operate in information technology services but diverge in approach: EPAM leads with platform engineering and automation, while Genpact prioritizes business process outsourcing and ESG integration. Their primary battleground lies in digital transformation services for enterprise clients. EPAM offers a tech-centric growth profile; Genpact appeals through operational efficiency and sustainability expertise.
Income Statement Comparison
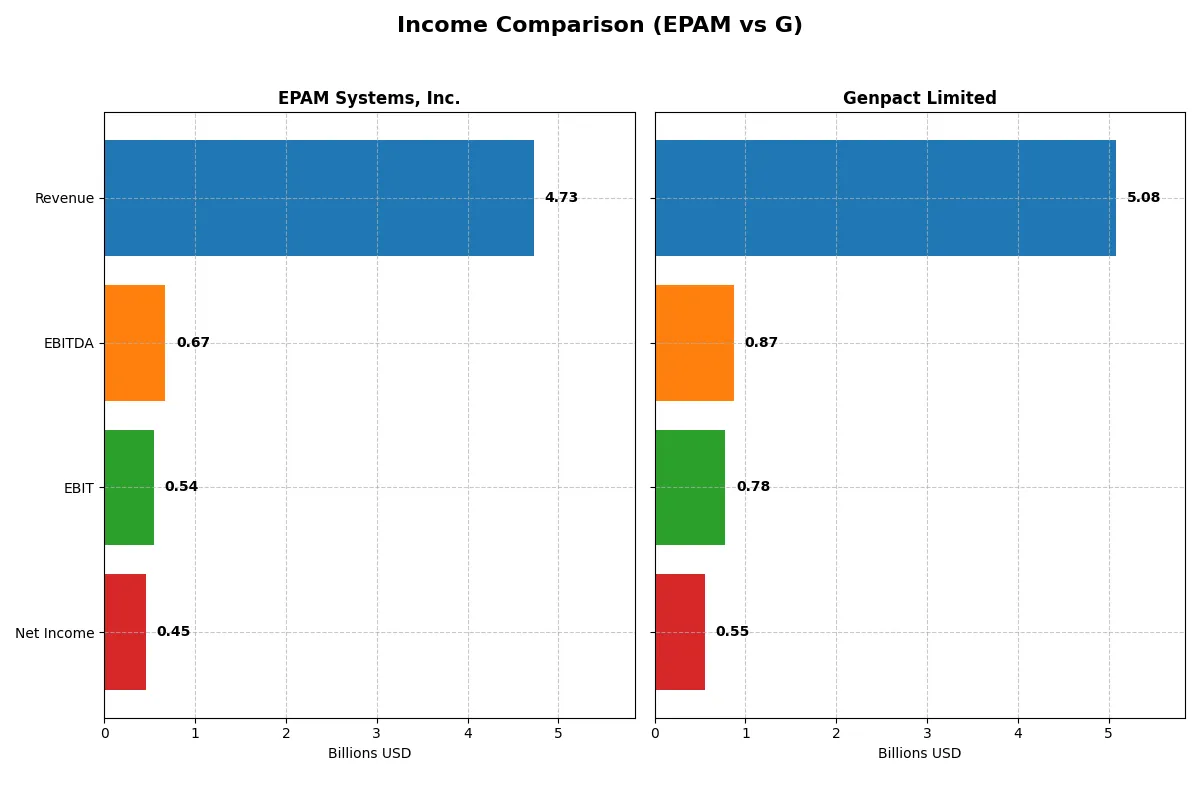
This data dissects the core profitability and scalability of both corporate engines to reveal who dominates the bottom line:
| Metric | EPAM Systems, Inc. (EPAM) | Genpact Limited (G) |
|---|---|---|
| Revenue | 4.73B | 4.77B |
| Cost of Revenue | 3.28B | 3.08B |
| Operating Expenses | 906M | 988M |
| Gross Profit | 1.45B | 1.69B |
| EBITDA | 672M | 853M |
| EBIT | 545M | 756M |
| Interest Expense | 0 | 79.5M |
| Net Income | 455M | 514M |
| EPS | 7.93 | 2.88 |
| Fiscal Year | 2024 | 2024 |
Income Statement Analysis: The Bottom-Line Duel
The following income statement comparison reveals the true efficiency and profitability dynamics of two leading corporate engines over recent years.
EPAM Systems, Inc. Analysis
EPAM’s revenue grew steadily from 2.7B in 2020 to 4.7B in 2024, showing a 77.8% increase overall. Net income rose from 327M to 455M, but net margin slipped slightly to 9.6%, reflecting tighter profitability. Its gross margin of 30.7% and EBIT margin of 11.5% remain solid, with momentum in net income and EPS growth signaling operational efficiency despite modest revenue stagnation in 2024.
Genpact Limited Analysis
Genpact expanded revenue from 4.0B in 2021 to 5.1B in 2025, a 26.3% increase. Net income surged from 369M to 552M, improving net margin to 10.9%. Its gross margin outperforms EPAM at 36.0%, coupled with a stronger EBIT margin of 15.4%. Growth accelerated notably in 2025, with favorable trends in revenue, gross profit, and EPS growth, indicating robust operating leverage and capital allocation.
Margin Power vs. Revenue Scale
Genpact leads in margin strength and recent growth acceleration, delivering higher profitability ratios and more consistent expansion. EPAM boasts larger revenue scale and impressive net income gains over five years but faces margin pressure. For investors prioritizing margin resilience and efficiency, Genpact’s profile appears more attractive, while EPAM offers scale with steady bottom-line improvement.
Financial Ratios Comparison
These vital ratios act as a diagnostic tool to expose the underlying fiscal health, valuation premiums, and capital efficiency of the companies compared below:
| Ratios | EPAM Systems, Inc. (EPAM) | Genpact Limited (G) |
|---|---|---|
| ROE | 12.5% | 21.7% |
| ROIC | 10.7% | 12.3% |
| P/E | 29.5x | 14.7x |
| P/B | 3.69x | 3.19x |
| Current Ratio | 2.96 | 1.66 |
| Quick Ratio | 2.96 | 1.66 |
| D/E (Debt-to-Equity) | 0.045 | 0.23 |
| Debt-to-Assets | 3.4% | 9.9% |
| Interest Coverage | 0 (not reported) | 15.3x |
| Asset Turnover | 1.00 | 0.87 |
| Fixed Asset Turnover | 14.1 | 13.6 |
| Payout ratio | 0% | 21.3% |
| Dividend yield | 0% | 1.45% |
| Fiscal Year | 2024 | 2025 |
Efficiency & Valuation Duel: The Vital Signs
Ratios act as a company’s DNA, revealing hidden risks and operational excellence that numbers alone cannot fully explain.
EPAM Systems, Inc.
EPAM shows moderate profitability with a 12.5% ROE and a net margin near 9.6%, signaling stable but unspectacular returns. Its P/E ratio at 29.5 suggests the stock is somewhat expensive. The company reinvests earnings rather than paying dividends, focusing on operational efficiency and maintaining a strong current ratio of 2.96, which supports liquidity.
Genpact Limited
Genpact posts a stronger 21.7% ROE and a higher net margin of 10.9%, reflecting superior profitability. Its P/E of 14.7 denotes a more attractive valuation compared to EPAM. Genpact balances growth with shareholder returns, offering a 1.45% dividend yield and robust liquidity at a current ratio of 1.66, indicating solid operational management.
Valuation Stretch vs. Robust Profitability
Genpact offers a better blend of profitability and valuation, with a lower P/E and higher returns. EPAM’s premium multiples reflect operational stability but come with less attractive risk-reward metrics. Investors seeking growth with income might prefer Genpact, while those favoring operational safety may lean toward EPAM.
Which one offers the Superior Shareholder Reward?
EPAM Systems, Inc. pays no dividends but reinvests heavily in R&D and growth, with zero payout and no buybacks, preserving robust free cash flow (9.2/share in 2024). Genpact Limited offers a modest 1.4% dividend yield, with a sustainable 21% payout ratio and active buybacks boosting total returns. I see Genpact’s balanced dividend and buyback approach as more attractive in 2026, delivering steady income plus capital appreciation, while EPAM’s zero distribution heightens risk despite growth potential.
Comparative Score Analysis: The Strategic Profile
The radar chart reveals the fundamental DNA and trade-offs of EPAM Systems, Inc. and Genpact Limited, highlighting their strategic strengths and vulnerabilities:
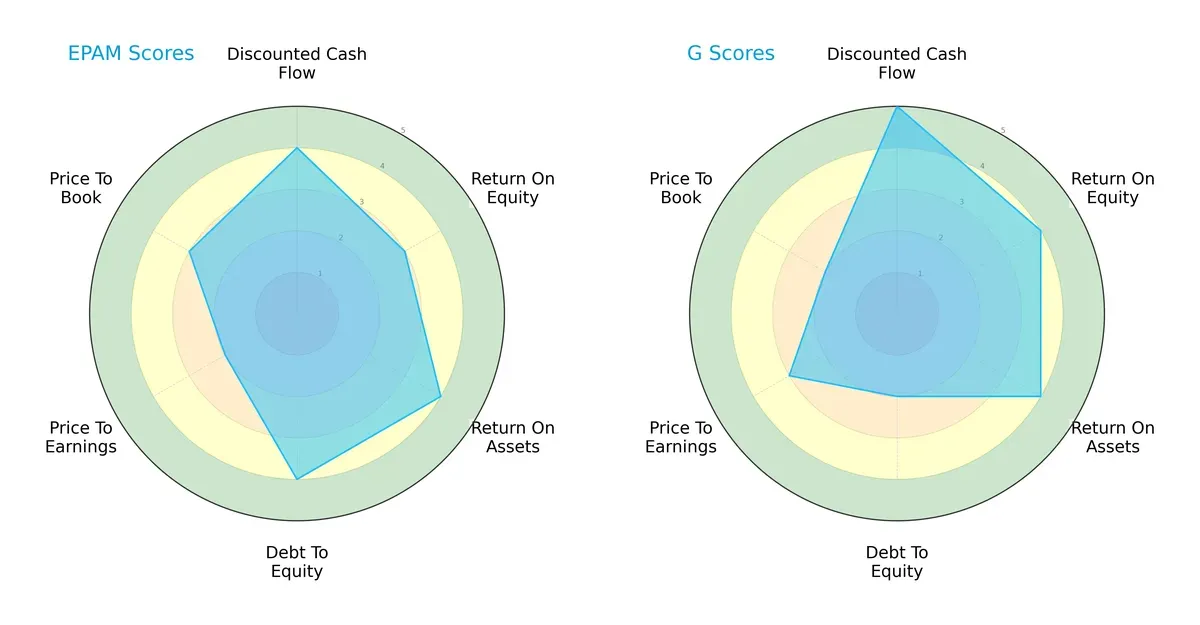
EPAM shows a balanced profile with solid scores in discounted cash flow (4), return on assets (4), and debt-to-equity (4), indicating financial stability and efficient asset use. However, its price-to-earnings score (2) signals valuation risk. Genpact excels in discounted cash flow (5) and return on equity (4), reflecting superior profitability but suffers from weaker debt-to-equity (2) and price-to-book (2) scores, suggesting higher leverage and valuation concerns. Overall, EPAM maintains steadier financial health, while Genpact relies more on cash flow strength.
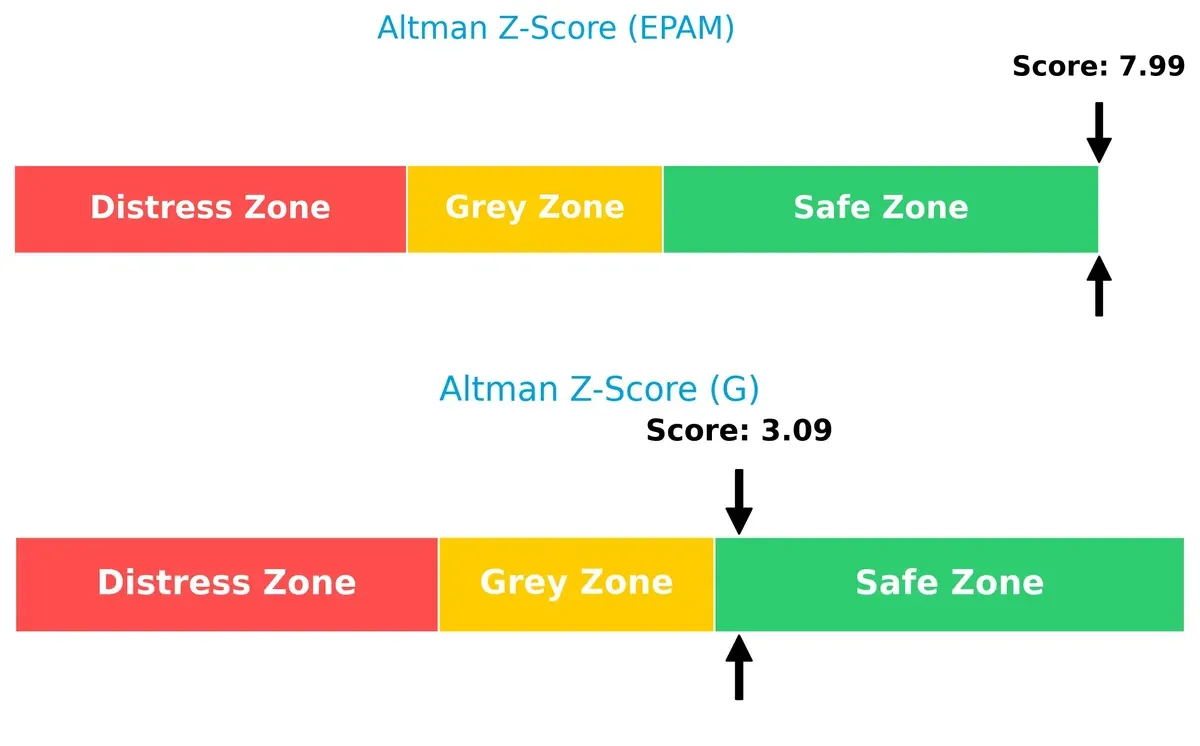
Bankruptcy Risk: Solvency Showdown
The Altman Z-Score gap between EPAM (7.99) and Genpact (3.09) indicates both are in the safe zone, but EPAM’s score is substantially higher, implying stronger long-term survival prospects in this cycle:
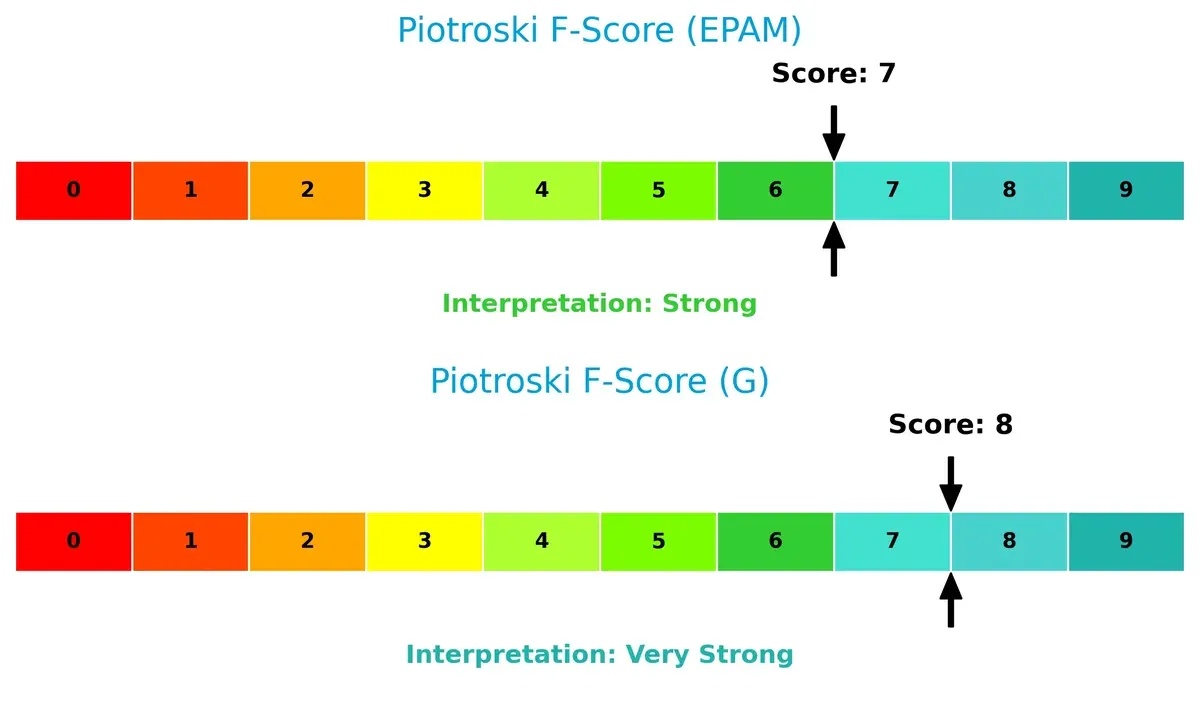
Financial Health: Quality of Operations
Genpact’s Piotroski F-Score of 8 surpasses EPAM’s 7, signaling very strong internal financial health versus EPAM’s strong but slightly less robust operational quality. Neither firm shows red flags, though Genpact edges ahead on internal metrics:
How are the two companies positioned?
This section dissects EPAM and Genpact’s operational DNA by comparing revenue distribution and internal dynamics, including strengths and weaknesses. The ultimate goal is to confront their economic moats to determine which model delivers the most resilient and sustainable competitive advantage today.
Revenue Segmentation: The Strategic Mix
This visual comparison dissects how EPAM Systems, Inc. and Genpact Limited diversify their income streams and where their primary sector bets lie:
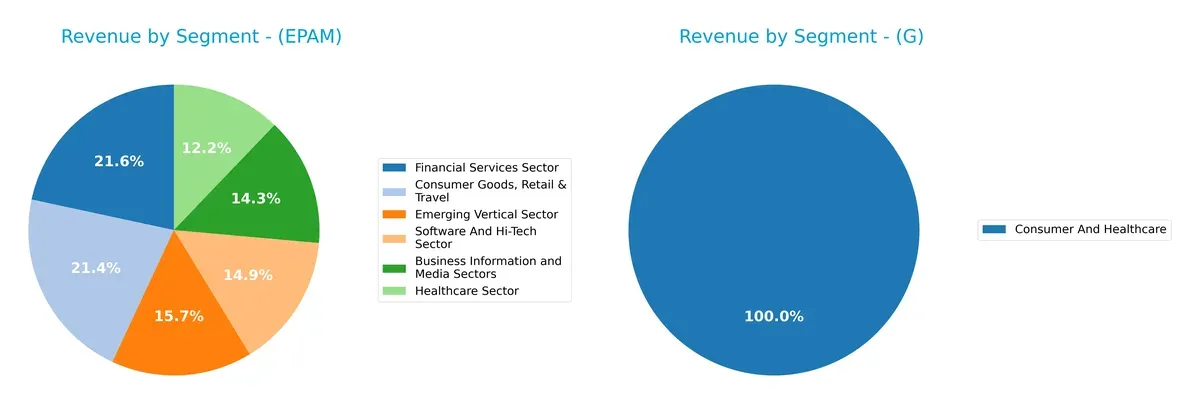
EPAM reveals a balanced revenue spread across six sectors, with Consumer Goods, Retail & Travel ($1.01B) and Financial Services ($1.02B) anchoring its mix. Genpact leans heavily on Consumer and Healthcare ($1.69B in 2024), showing less diversification. EPAM’s multi-sector approach mitigates concentration risk, while Genpact’s focus suggests strong expertise but potential vulnerability to sector-specific downturns. This mix reflects EPAM’s strategy to build ecosystem lock-in, contrasting with Genpact’s infrastructure dominance in its niche.
Strengths and Weaknesses Comparison
This table compares the Strengths and Weaknesses of EPAM Systems, Inc. and Genpact Limited:
EPAM Strengths
- Strong diversification across six vertical sectors
- Favorable liquidity ratios with current and quick ratios near 3.0
- Very low leverage with debt-to-equity at 0.04
- High fixed asset turnover at 14.07
- Large U.S. market presence with $2.68B revenue
- Slightly favorable overall financial ratios
Genpact Strengths
- Favorable profitability with net margin 10.88% and ROE 21.67%
- ROIC exceeds WACC indicating value creation
- Favorable capital structure and interest coverage
- Global presence spanning Americas, Europe, Asia, and India
- Significant revenue concentration in India at $2.76B
- Very favorable overall financial ratios
EPAM Weaknesses
- ROIC below WACC signals operational inefficiency
- Unfavorable valuation metrics with PE 29.47 and PB 3.69
- No dividend yield limits income investors
- Net margin and ROE only neutral
- Moderate asset turnover at 1.0
- Concentrated revenues in U.S. and Europe, less emerging markets
Genpact Weaknesses
- PB ratio unfavorable at 3.19
- Dividend yield neutral at 1.45%
- Lower asset turnover at 0.87
- Moderate revenue concentration in India may limit diversification
- Neutral net margin and asset turnover
EPAM’s financial strength lies in liquidity and low leverage but shows operational efficiency concerns. Genpact excels in profitability and global diversification but carries valuation and concentration risks. These contrasts highlight each company’s strategic financial positioning in their sectors.
The Moat Duel: Analyzing Competitive Defensibility
A structural moat is the sole barrier protecting long-term profits from relentless competition erosion. Let’s dissect how moats shape these firms’ futures:
EPAM Systems, Inc.: Innovation-Driven Engineering Moat
EPAM leverages intangible assets and engineering expertise to maintain high service quality, reflected in stable 11.5% EBIT margins. However, its declining ROIC signals weakening profitability, risking moat erosion without strategic innovation in 2026.
Genpact Limited: Operational Excellence and Scale Moat
Genpact’s cost advantage and scale in business process outsourcing deliver superior 15.3% EBIT margins and a growing ROIC. This financial strength underpins its moat, positioning Genpact to expand in digital transformation services through 2026.
Scale and Profitability: Engineering Talent vs. Operational Efficiency
Genpact holds a deeper moat with a 5.1% ROIC premium over WACC and consistent growth, while EPAM’s negative spread and shrinking returns expose value destruction. Genpact is better equipped to defend and grow its market share in the evolving IT services landscape.
Which stock offers better returns?
The past year reveals contrasting price movements: EPAM Systems, Inc. saw a sharp decline with recent recovery signs, while Genpact Limited exhibited steady gains despite a recent downturn.
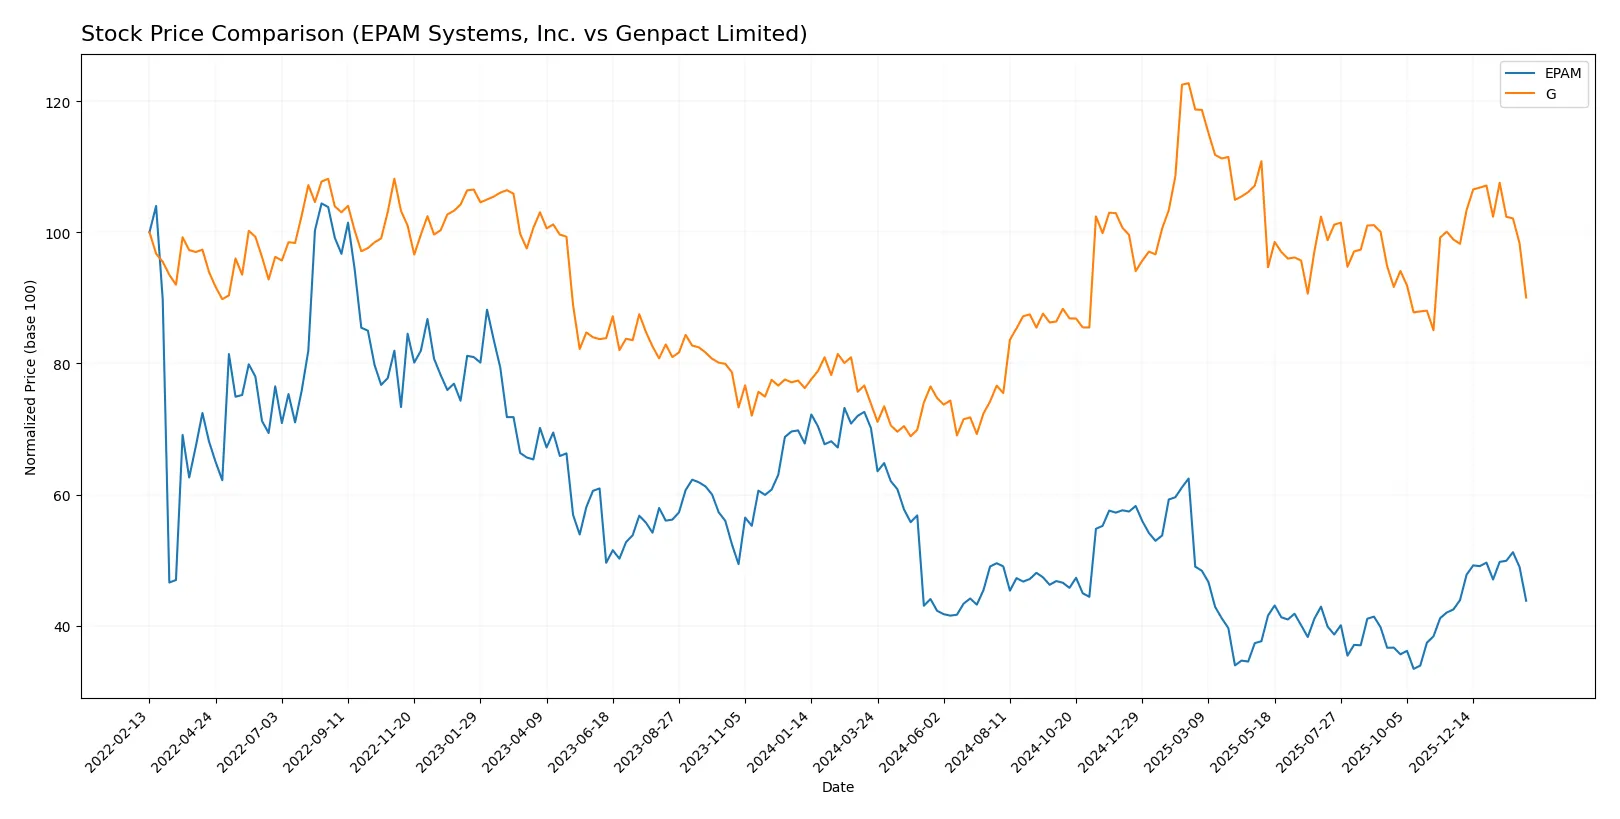
Trend Comparison
EPAM’s stock fell 37.54% over the past 12 months, marking a bearish trend with accelerating decline and high volatility between $142.38 and $298.89.
Genpact’s stock rose 21.95% over the same period, showing a bullish trend with decelerating gains and lower volatility, peaking at $55.05 and bottoming at $30.9.
Genpact outperformed EPAM with a solid positive return, while EPAM’s heavy loss outweighed its recent modest rebound.
Target Prices
Analysts show a clear bullish consensus for EPAM Systems, Inc. and Genpact Limited.
| Company | Target Low | Target High | Consensus |
|---|---|---|---|
| EPAM Systems, Inc. | 175 | 247 | 214 |
| Genpact Limited | 42 | 50 | 46 |
EPAM’s consensus target price of 214 represents a 15% upside from its 186.68 current price. Genpact’s 46 target implies a 14% gain over the 40.39 stock price.

Don’t Let Luck Decide Your Entry Point
Optimize your entry points with our advanced ProRealTime indicators. You’ll get efficient buy signals with precise price targets for maximum performance. Start outperforming now!
How do institutions grade them?
Here are the latest institutional grades for EPAM Systems, Inc. and Genpact Limited:
EPAM Systems, Inc. Grades
The following table summarizes recent grades from major financial institutions for EPAM Systems, Inc.:
| Grading Company | Action | New Grade | Date |
|---|---|---|---|
| Citigroup | Maintain | Neutral | 2026-01-29 |
| Wells Fargo | Maintain | Overweight | 2026-01-14 |
| TD Cowen | Maintain | Buy | 2026-01-09 |
| Mizuho | Maintain | Outperform | 2025-11-11 |
| JP Morgan | Maintain | Overweight | 2025-11-07 |
| Morgan Stanley | Maintain | Equal Weight | 2025-09-09 |
| JP Morgan | Maintain | Overweight | 2025-08-20 |
| Barclays | Maintain | Overweight | 2025-05-12 |
| Guggenheim | Maintain | Buy | 2025-05-09 |
| Piper Sandler | Maintain | Neutral | 2025-05-09 |
Genpact Limited Grades
This table lists recent institutional grades for Genpact Limited from recognized firms:
| Grading Company | Action | New Grade | Date |
|---|---|---|---|
| Needham | Maintain | Buy | 2026-02-06 |
| JP Morgan | Maintain | Neutral | 2025-08-20 |
| Needham | Maintain | Buy | 2025-08-08 |
| Mizuho | Maintain | Neutral | 2025-07-01 |
| Needham | Maintain | Buy | 2025-06-30 |
| TD Cowen | Maintain | Buy | 2025-06-27 |
| Baird | Maintain | Neutral | 2025-05-08 |
| Needham | Maintain | Buy | 2025-05-08 |
| Mizuho | Maintain | Neutral | 2025-02-10 |
| Needham | Maintain | Buy | 2025-02-07 |
Which company has the best grades?
Genpact Limited consistently receives “Buy” ratings from Needham and TD Cowen, indicating strong analyst confidence. EPAM Systems shows a mix of “Overweight,” “Buy,” and “Neutral,” with less consensus on strong upside. Investors may interpret Genpact’s stronger buy recommendations as a sign of higher expected performance, though the mixed grades for EPAM reflect varied analyst views.
Risks specific to each company
The following categories identify critical pressure points and systemic threats facing EPAM Systems, Inc. and Genpact Limited in the 2026 market environment:
1. Market & Competition
EPAM Systems, Inc.
- Faces intense competition in digital engineering; requires continuous innovation to maintain market share.
Genpact Limited
- Competes in BPO and IT services with pricing pressure; differentiation driven by service breadth and ESG offerings.
2. Capital Structure & Debt
EPAM Systems, Inc.
- Maintains a low debt-to-equity ratio (0.04), signaling strong financial stability and conservative leverage.
Genpact Limited
- Higher debt-to-equity ratio (0.23) increases financial risk despite manageable interest coverage.
3. Stock Volatility
EPAM Systems, Inc.
- Exhibits high beta (1.72), indicating significant stock price volatility relative to the market.
Genpact Limited
- Lower beta (0.74) suggests more stable stock price behavior amid market fluctuations.
4. Regulatory & Legal
EPAM Systems, Inc.
- Exposure to global data privacy and IT compliance regulations; risk of costly breaches remains.
Genpact Limited
- Faces regulatory scrutiny in multiple jurisdictions, particularly around outsourcing and ESG compliance.
5. Supply Chain & Operations
EPAM Systems, Inc.
- Relies on skilled IT professionals globally; talent retention and operational scalability are challenges.
Genpact Limited
- Operates extensive global delivery network; supply chain disruptions could affect service quality and costs.
6. ESG & Climate Transition
EPAM Systems, Inc.
- ESG initiatives advancing but no dividend yield may concern income-focused investors.
Genpact Limited
- Strong ESG services portfolio supports climate transition; modest dividend yield adds investor appeal.
7. Geopolitical Exposure
EPAM Systems, Inc.
- US-based with global operations; geopolitical tensions could disrupt offshore delivery models.
Genpact Limited
- Bermuda-based with significant exposure in Asia and Americas; geopolitics may affect cross-border workflows.
Which company shows a better risk-adjusted profile?
Genpact’s lower stock volatility, stronger profitability ratios, and very favorable financial scores create a more balanced risk-adjusted profile. EPAM’s high beta and unfavorable ROIC versus WACC ratio raise concerns despite its conservative leverage and strong liquidity. Genpact’s diversified services and strong ESG focus also mitigate risks more effectively. Recent data confirms Genpact’s higher Altman Z-score and Piotroski score, reflecting robust financial health and lower bankruptcy risk.
Final Verdict: Which stock to choose?
EPAM Systems, Inc. stands out for its remarkable operational efficiency and strong liquidity position. Its ability to generate free cash flow consistently makes it a cash machine in the tech services sector. However, its declining ROIC relative to WACC signals a point of vigilance on value creation. EPAM suits aggressive growth portfolios willing to tolerate some value erosion risk.
Genpact Limited boasts a robust strategic moat with a sustainable competitive advantage, evidenced by a growing ROIC well above its cost of capital. Its favorable income growth and prudent debt management offer better stability compared to EPAM. This profile fits well with GARP investors seeking growth combined with reasonable valuation and financial resilience.
If you prioritize rapid cash generation and operational efficiency, EPAM is the compelling choice due to its unmatched liquidity and growth momentum despite some value destruction. However, if you seek sustainable profitability with stronger moat protection and financial stability, Genpact offers better stability and a more attractive risk-reward balance for conservative growth investors. Both stocks warrant careful monitoring of their competitive dynamics and capital efficiency trends.
Disclaimer: Investment carries a risk of loss of initial capital. The past performance is not a reliable indicator of future results. Be sure to understand risks before making an investment decision.
Go Further
I encourage you to read the complete analyses of EPAM Systems, Inc. and Genpact Limited to enhance your investment decisions: