In the dynamic world of information technology services, Fiserv, Inc. and EPAM Systems, Inc. stand out as leaders driving innovation and digital transformation. Both companies serve global markets with cutting-edge solutions—Fiserv in financial technology and payments, EPAM in software engineering and digital platforms. This comparison will help investors understand which company offers the most compelling opportunity for growth and value in 2026. Join me as we explore their strengths and investment potential.
Table of contents
Companies Overview
I will begin the comparison between Fiserv, Inc. and EPAM Systems, Inc. by providing an overview of these two companies and their main differences.
Fiserv Overview
Fiserv, Inc. specializes in payment and financial services technology, operating globally through Acceptance, Fintech, and Payments segments. The company provides solutions such as point-of-sale merchant acquiring, mobile payments, digital banking, and card transaction processing. With a market cap of approximately 36.7B USD and 38K employees, Fiserv primarily serves banks, credit unions, merchants, and corporate clients from its headquarters in Milwaukee, Wisconsin.
EPAM Overview
EPAM Systems, Inc. delivers digital platform engineering and software development services worldwide, including infrastructure management, software testing, and digital design solutions. The firm serves diverse industries such as financial services, healthcare, and media. With a market cap near 12.2B USD and a workforce of 61.2K employees, EPAM focuses on integrating engineering practices and smart automation from its base in Newtown, Pennsylvania.
Key similarities and differences
Both Fiserv and EPAM operate in the technology sector, providing services within information technology, yet they differ in focus areas. Fiserv centers on financial technology solutions with an emphasis on payments and banking, while EPAM emphasizes digital engineering and software development across multiple industries. Fiserv’s business model includes product platforms and payment processing, whereas EPAM’s model revolves around customized engineering and consulting services.
Income Statement Comparison
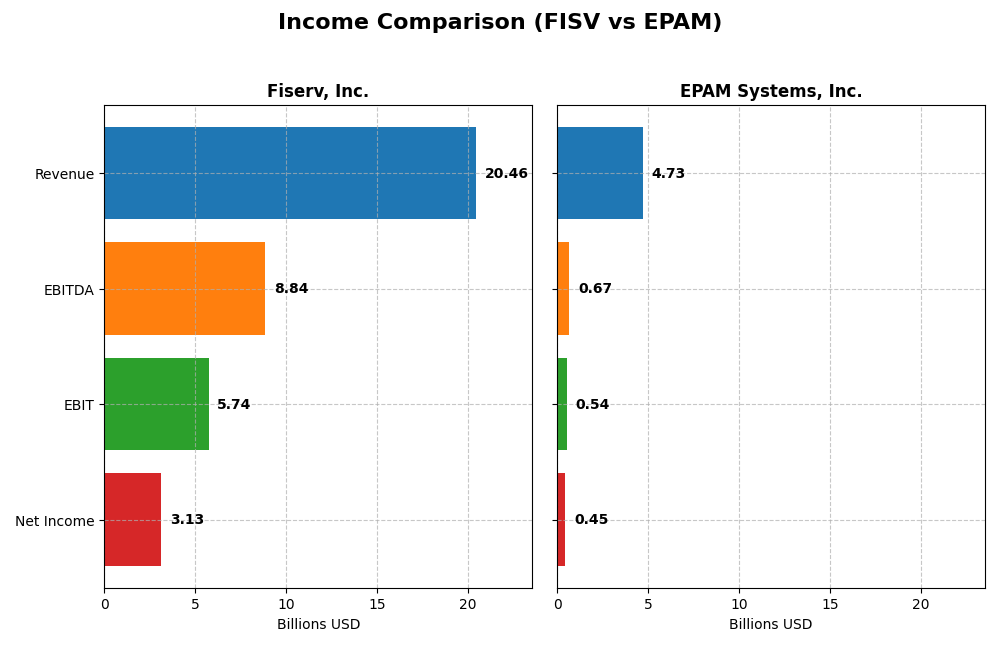
The table below presents a side-by-side comparison of key income statement metrics for Fiserv, Inc. and EPAM Systems, Inc. for the fiscal year 2024.
| Metric | Fiserv, Inc. (FISV) | EPAM Systems, Inc. (EPAM) |
|---|---|---|
| Market Cap | 36.7B | 12.2B |
| Revenue | 20.46B | 4.73B |
| EBITDA | 8.84B | 672M |
| EBIT | 5.74B | 545M |
| Net Income | 3.13B | 455M |
| EPS | 5.41 | 7.93 |
| Fiscal Year | 2024 | 2024 |
Income Statement Interpretations
Fiserv, Inc.
Fiserv, Inc. has shown consistent growth in revenue, reaching $20.46B in 2024, a 7.14% increase from 2023. Net income surged significantly over five years, hitting $3.13B in 2024. Margins remain strong with a favorable gross margin of 60.83% and EBIT margin of 28.08%. Despite a slight net margin decline last year, overall profitability improved with EPS growth of 8.03%.
EPAM Systems, Inc.
EPAM Systems, Inc. experienced steady revenue growth over the period, though only a 0.8% increase to $4.73B in 2024. Net income rose modestly to $455M, supported by a favorable net margin of 9.61% and EBIT margin of 11.52%. While one-year revenue growth was weak, net margin and EPS improved in 2024, reflecting operational efficiency gains.
Which one has the stronger fundamentals?
Fiserv displays stronger fundamentals with higher absolute revenue and net income, superior margins, and significant net income growth over five years. EPAM shows solid growth but with lower margins and a weaker recent revenue trend. Both companies have favorable overall income statement evaluations, yet Fiserv’s larger scale and margin improvements suggest more robust financial health.
Financial Ratios Comparison
Below is a comparison of key financial ratios for Fiserv, Inc. (FISV) and EPAM Systems, Inc. (EPAM) based on their most recent full-year data for 2024.
| Ratios | Fiserv, Inc. (FISV) | EPAM Systems, Inc. (EPAM) |
|---|---|---|
| ROE | 11.57% | 12.52% |
| ROIC | 8.70% | 10.67% |
| P/E | 37.97 | 29.47 |
| P/B | 4.39 | 3.69 |
| Current Ratio | 1.06 | 2.96 |
| Quick Ratio | 1.06 | 2.96 |
| D/E (Debt-to-Equity) | 0.92 | 0.045 |
| Debt-to-Assets | 32.34% | 3.44% |
| Interest Coverage | 4.75 | 0 (not available) |
| Asset Turnover | 0.27 | 1.00 |
| Fixed Asset Turnover | 8.62 | 14.07 |
| Payout Ratio | 0 | 0 |
| Dividend Yield | 0 | 0 |
Interpretation of the Ratios
Fiserv, Inc.
Fiserv shows a mixed ratio profile with a favorable net margin of 15.31% and solid quick ratio at 1.06, indicating reasonable liquidity. However, high price-to-earnings (PE) and price-to-book (PB) ratios suggest valuation concerns. The zero dividend yield reflects no dividend payments, likely indicating reinvestment or other capital priorities rather than shareholder returns through dividends.
EPAM Systems, Inc.
EPAM presents stronger liquidity ratios with a current and quick ratio of 2.96, and very low debt levels, signaling financial stability. Its return on equity is neutral at 12.52%, but weighted average cost of capital (WACC) and return on invested capital (ROIC) are unfavorable, hinting at efficiency issues. Like Fiserv, EPAM pays no dividends, consistent with a growth or reinvestment strategy.
Which one has the best ratios?
EPAM’s ratios are slightly more favorable overall, driven by stronger liquidity, low leverage, and higher fixed asset turnover. Fiserv’s solid profitability is offset by valuation concerns and weaker asset turnover. Both companies do not currently offer dividend returns, focusing instead on growth or other financial strategies.
Strategic Positioning
This section compares the strategic positioning of Fiserv, Inc. and EPAM Systems, Inc., focusing on market position, key segments, and exposure to technological disruption:
Fiserv, Inc.
- Large market cap of 36.7B; operates in competitive financial technology services with moderate beta.
- Key segments include Acceptance, Fintech, and Payments, driving diverse financial services revenue.
- Exposure to disruption through digital commerce, mobile payments, and security within fintech.
EPAM Systems, Inc.
- Smaller market cap of 12.2B; higher beta reflects more volatility in digital platform engineering services.
- Serves multiple sectors including financial services, healthcare, retail, and software through engineering.
- Faces disruption risks in software development, AI, robotics, and digital transformation services.
Fiserv, Inc. vs EPAM Systems, Inc. Positioning
Fiserv pursues a diversified approach across payment processing, fintech, and merchant services, supporting stable revenue streams. EPAM concentrates on digital engineering and consulting across various industries, potentially increasing sector-specific risks and opportunities.
Which has the best competitive advantage?
Fiserv demonstrates a very favorable moat with growing ROIC above WACC, indicating durable competitive advantage and value creation. EPAM’s declining ROIC below WACC shows value destruction and a very unfavorable moat status.
Stock Comparison
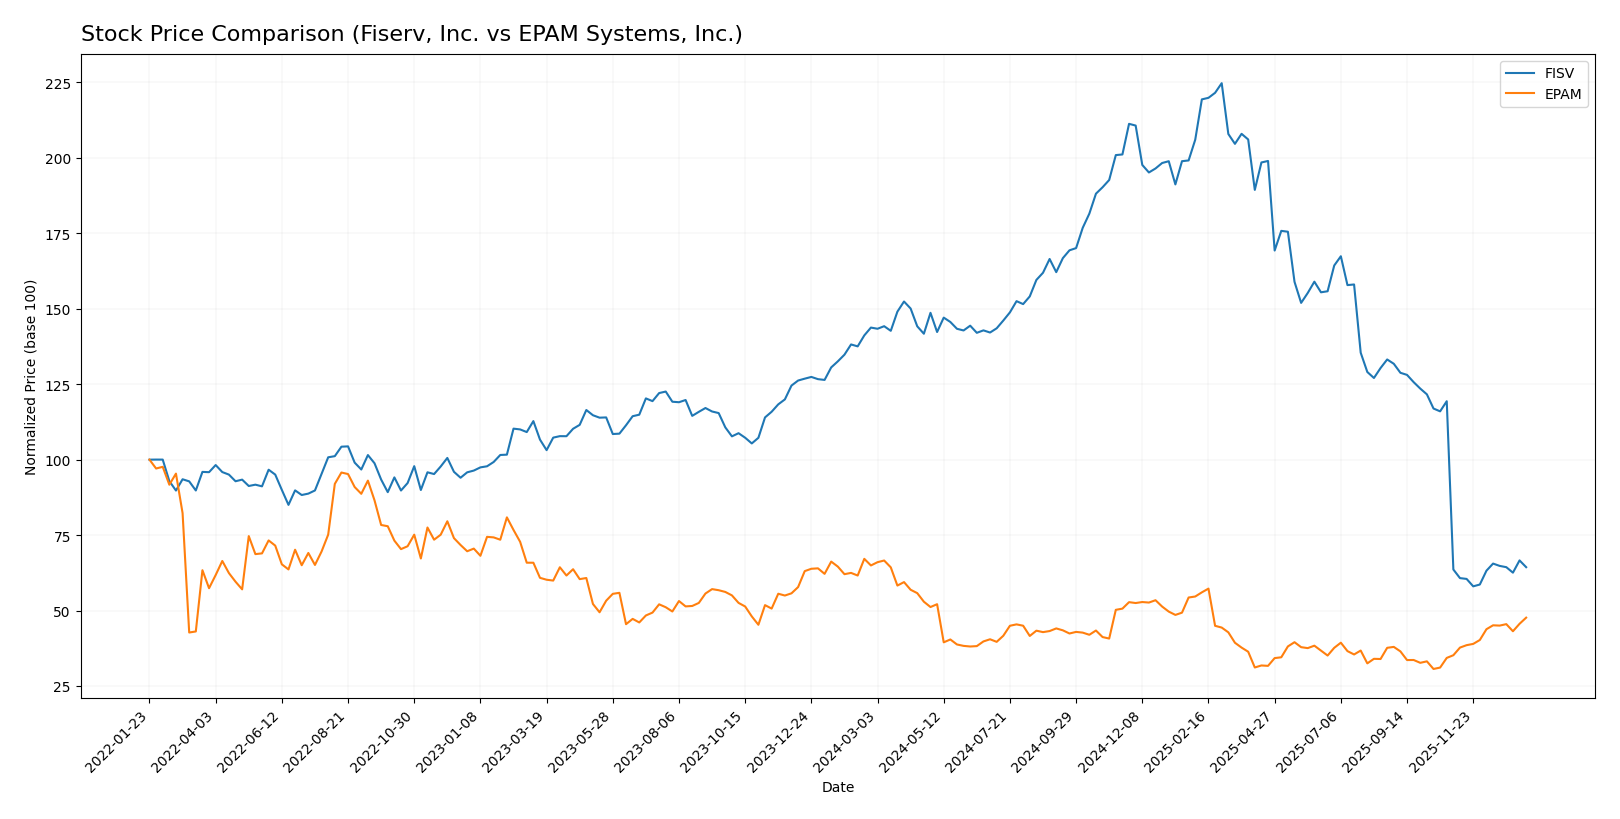
The stock prices of Fiserv, Inc. and EPAM Systems, Inc. have shown pronounced bearish trends over the past year, with significant price declines but contrasting recent recoveries and trading volumes.
Trend Analysis
Fiserv, Inc. experienced a steep bearish trend over the past 12 months with a price drop of -55.23%, showing acceleration and high volatility (std deviation 44.96). Recently, the trend slightly improved with a 1.21% gain but remains neutral.
EPAM Systems, Inc. also faced a bearish trend over 12 months with a -26.64% price decline and acceleration, accompanied by notable volatility (std deviation 38.96). The recent period shows a strong bullish recovery of +35.38% with increased buyer dominance.
Comparing both, EPAM Systems delivered the highest market performance recently, reversing its longer-term losses more effectively than Fiserv, which remains largely bearish despite a mild recent uptick.
Target Prices
Analysts present a wide but confident range of target prices for these technology service providers.
| Company | Target High | Target Low | Consensus |
|---|---|---|---|
| Fiserv, Inc. | 180 | 62 | 111.39 |
| EPAM Systems, Inc. | 247 | 175 | 214 |
Fiserv’s consensus target of 111.39 suggests upside potential from the current 67.5 USD price, indicating a possibly undervalued stock. EPAM’s consensus target of 214 is slightly below the current price of 221.4 USD, signaling cautious optimism among analysts.
Analyst Opinions Comparison
This section compares analysts’ ratings and financial grades for Fiserv, Inc. and EPAM Systems, Inc.:
Rating Comparison
Fiserv, Inc. Rating
- Rating: B+ indicating a very favorable outlook.
- Discounted Cash Flow Score: 5, very favorable DCF.
- ROE Score: 4, favorable efficiency in equity use.
- ROA Score: 3, moderate asset utilization.
- Debt To Equity Score: 1, very unfavorable leverage.
- Overall Score: 3, moderate overall financial health.
EPAM Systems, Inc. Rating
- Rating: A- reflecting a very favorable outlook.
- Discounted Cash Flow Score: 4, favorable DCF.
- ROE Score: 3, moderate efficiency in equity use.
- ROA Score: 4, favorable asset utilization.
- Debt To Equity Score: 4, favorable financial risk.
- Overall Score: 4, favorable overall financial health.
Which one is the best rated?
Based on the provided data, EPAM Systems holds a better overall rating with an A- and a higher overall score of 4 compared to Fiserv’s B+ and score of 3. EPAM also shows stronger debt management and asset utilization scores.
Scores Comparison
Here is a comparison of the Altman Z-Score and Piotroski Score for Fiserv, Inc. and EPAM Systems, Inc.:
Fiserv Scores
- Altman Z-Score: 1.41, in distress zone, high risk of bankruptcy
- Piotroski Score: 7, strong financial health
EPAM Scores
- Altman Z-Score: 8.83, in safe zone, low bankruptcy risk
- Piotroski Score: 7, strong financial health
Which company has the best scores?
EPAM Systems has a substantially higher Altman Z-Score, indicating much lower bankruptcy risk, while both companies share an equal Piotroski Score of 7, reflecting strong financial health.
Grades Comparison
Here is a comparison of the latest reliable grades for Fiserv, Inc. and EPAM Systems, Inc.:
Fiserv, Inc. Grades
The following table summarizes recent analyst grades from recognized financial institutions for Fiserv, Inc.:
| Grading Company | Action | New Grade | Date |
|---|---|---|---|
| Tigress Financial | Maintain | Buy | 2025-12-31 |
| Mizuho | Maintain | Outperform | 2025-12-22 |
| Goldman Sachs | Downgrade | Neutral | 2025-10-30 |
| Bernstein | Downgrade | Market Perform | 2025-10-30 |
| Argus Research | Downgrade | Hold | 2025-10-30 |
| Morgan Stanley | Downgrade | Equal Weight | 2025-10-30 |
| Truist Securities | Downgrade | Hold | 2025-10-30 |
| JP Morgan | Maintain | Overweight | 2025-10-30 |
| Citigroup | Maintain | Neutral | 2025-10-30 |
| RBC Capital | Maintain | Outperform | 2025-10-30 |
Recent grades for Fiserv show a mix of maintained positive ratings and several downgrades from Buy/Outperform to Hold/Neutral, indicating some cautious sentiment among analysts.
EPAM Systems, Inc. Grades
Below is a summary of analyst grades for EPAM Systems, Inc. from reputable firms:
| Grading Company | Action | New Grade | Date |
|---|---|---|---|
| TD Cowen | Maintain | Buy | 2026-01-09 |
| Mizuho | Maintain | Outperform | 2025-11-11 |
| JP Morgan | Maintain | Overweight | 2025-11-07 |
| Morgan Stanley | Maintain | Equal Weight | 2025-09-09 |
| JP Morgan | Maintain | Overweight | 2025-08-20 |
| Barclays | Maintain | Overweight | 2025-05-12 |
| Guggenheim | Maintain | Buy | 2025-05-09 |
| Morgan Stanley | Maintain | Equal Weight | 2025-05-09 |
| Needham | Maintain | Buy | 2025-05-09 |
| Piper Sandler | Maintain | Neutral | 2025-05-09 |
EPAM’s analyst grades have remained stable with no downgrades, mostly in the Buy to Overweight range, reflecting consistent positive sentiment.
Which company has the best grades?
EPAM Systems has maintained more stable and predominantly positive grades, with no downgrades and several Buy and Overweight ratings. By contrast, Fiserv’s grades show mixed signals with notable downgrades. This stability in EPAM’s grades may influence investor confidence differently compared to the more cautious outlook on Fiserv.
Strengths and Weaknesses
Below is a table summarizing the key strengths and weaknesses of Fiserv, Inc. and EPAM Systems, Inc. based on their latest financial and operational data.
| Criterion | Fiserv, Inc. (FISV) | EPAM Systems, Inc. (EPAM) |
|---|---|---|
| Diversification | Strong product and processing service segments with revenues of $16.6B and $3.8B respectively, showing a broad fintech and payments focus | Balanced sector exposure including financial services, retail, healthcare, and software, each ranging from $0.57B to $1.01B |
| Profitability | Net margin at 15.31% (favorable), ROIC 8.7% (neutral), creating value with ROIC > WACC | Net margin 9.61% (neutral), ROIC 10.67% but below WACC, shedding value with declining profitability |
| Innovation | Moderate asset turnover (0.27, unfavorable) but high fixed asset turnover (8.62, favorable) indicates efficient core asset use | High fixed asset turnover (14.07, favorable) and good asset turnover (1.0, neutral) reflecting operational efficiency |
| Global presence | Large scale with processing and services supporting financial institutions and payments worldwide | Diverse global client base across multiple verticals, including emerging sectors |
| Market Share | Leading market position in payments processing and fintech services, supported by growing ROIC and solid service revenues | Competitive niche in software and IT services, but challenged by declining ROIC and margin pressures |
Key takeaways: Fiserv demonstrates a durable competitive advantage with strong profitability and value creation, driven by a diversified fintech portfolio. EPAM shows operational efficiency but faces profitability challenges and value destruction, indicating higher investment risk.
Risk Analysis
Below is a comparative table highlighting key risk factors for Fiserv, Inc. and EPAM Systems, Inc. based on recent 2024 data:
| Metric | Fiserv, Inc. (FISV) | EPAM Systems, Inc. (EPAM) |
|---|---|---|
| Market Risk | Beta 0.80 – lower volatility, but wide price range (59.61-238.59) | Beta 1.73 – higher volatility, range (138.15-269) |
| Debt level | Moderate debt-to-equity 0.92, debt/assets 32.34% | Low debt-to-equity 0.04, debt/assets 3.44% |
| Regulatory Risk | Moderate; financial services tech with compliance demands | Moderate; global IT services, sensitive to data/privacy laws |
| Operational Risk | Exposure to payment processing disruptions | Reliant on digital platform engineering and global delivery |
| Environmental Risk | Moderate; increasing emphasis on sustainable tech operations | Moderate; focus on operational efficiency and sustainability |
| Geopolitical Risk | Moderate; operates worldwide, sensitive to global financial regulations | Elevated; global presence including Eastern Europe exposes to geopolitical tensions |
Fiserv’s moderate leverage and stable beta suggest manageable market and debt risks, but its Altman Z-score in the distress zone signals caution on financial stability. EPAM shows stronger financial health with a safe zone Z-score and low debt, though higher market volatility and geopolitical exposure increase risk. The most impactful risks currently are EPAM’s geopolitical tensions and Fiserv’s financial distress signals, requiring close monitoring.
Which Stock to Choose?
Fiserv, Inc. (FISV) shows a strong income evolution with a favorable gross margin of 60.83% and EBIT margin of 28.08%. Its profitability is solid, with a return on equity of 11.57% and a growing ROIC above WACC, indicating value creation. Debt metrics are neutral, but the Altman Z-Score signals some financial distress. The overall rating is very favorable (B+).
EPAM Systems, Inc. (EPAM) has a favorable income statement with a 30.68% gross margin and 11.52% EBIT margin. It maintains a strong liquidity position and low debt, reflected in a safe-zone Altman Z-Score. However, its ROIC is below WACC with a declining trend, indicating value erosion. EPAM’s overall rating is very favorable (A-), supported by strong financial scores.
Investors focused on stability and durable value creation might find FISV’s growing profitability and economic moat appealing, despite some financial risk signals. Conversely, those seeking companies with strong liquidity and less leverage might view EPAM’s profile as slightly more favorable, though its declining ROIC could be a concern for long-term value investors.
Disclaimer: Investment carries a risk of loss of initial capital. The past performance is not a reliable indicator of future results. Be sure to understand risks before making an investment decision.
Go Further
I encourage you to read the complete analyses of Fiserv, Inc. and EPAM Systems, Inc. to enhance your investment decisions: