Fidelity National Information Services, Inc. (FIS) and EPAM Systems, Inc. (EPAM) are two prominent players in the information technology services sector, each offering unique solutions that drive innovation in financial technology and digital engineering. While FIS focuses heavily on banking and capital markets technology, EPAM excels in software development and digital platform engineering. This article will analyze both companies to identify the most compelling investment opportunity for your portfolio.

Table of contents
Companies Overview
I will begin the comparison between Fidelity National Information Services, Inc. (FIS) and EPAM Systems, Inc. by providing an overview of these two companies and their main differences.
Fidelity National Information Services, Inc. Overview
FIS specializes in technology solutions for merchants, banks, and capital markets firms worldwide. Operating through Merchant Solutions, Banking Solutions, and Capital Market Solutions segments, it delivers services such as payment processing, core banking applications, fraud management, and securities processing. Founded in 1968 and based in Jacksonville, Florida, FIS holds a strong position in the financial technology sector with 50K employees.
EPAM Systems, Inc. Overview
EPAM Systems offers digital platform engineering and software development services globally, including software customization, infrastructure management, and smart automation. It serves diverse sectors like financial services, healthcare, and technology. Founded in 1993 and headquartered in Newtown, Pennsylvania, EPAM employs about 61K people and focuses on digital transformation, advisory consulting, and advanced technology solutions.
Key similarities and differences
Both FIS and EPAM operate in the technology sector, providing IT services to financial and other industries. FIS is more focused on financial technology solutions with a broad range of banking and capital market services, while EPAM emphasizes software engineering, digital platform development, and consulting across multiple industries. EPAM’s business model leans heavily on digital transformation and automation, contrasting with FIS’s integrated payment and banking processing solutions.
Income Statement Comparison
The table below compares key income statement metrics for Fidelity National Information Services, Inc. and EPAM Systems, Inc. for the fiscal year 2024.

| Metric | Fidelity National Information Services, Inc. | EPAM Systems, Inc. |
|---|---|---|
| Market Cap | 33.1B | 12.2B |
| Revenue | 10.1B | 4.73B |
| EBITDA | 3.39B | 672M |
| EBIT | 1.65B | 545M |
| Net Income | 1.45B | 455M |
| EPS | 1.42 | 7.93 |
| Fiscal Year | 2024 | 2024 |
Income Statement Interpretations
Fidelity National Information Services, Inc.
FIS showed a mixed revenue trend with a 19.32% decline over five years but a 3.01% increase in 2024, alongside a strong net income rebound from significant losses in prior years to $1.45B in 2024. Margins improved notably, with a 14.32% net margin and 16.27% EBIT margin in 2024, reflecting a turnaround and operational efficiency gains.
EPAM Systems, Inc.
EPAM’s revenue grew 77.78% over 2020-2024 but slowed to 0.8% in 2024, signaling a deceleration. Net income rose 38.93% overall, reaching $455M in 2024, with a 9.61% net margin. Margins remain favorable but showed some pressure, with net margin growth declining over the period, despite a modest EBIT margin of 11.52%.
Which one has the stronger fundamentals?
Both companies present favorable income statement evaluations with 71.43% favorable metrics. FIS benefits from stronger margins and a robust net margin recovery, while EPAM excels in revenue growth but faces margin compression. FIS’s margin improvement and net income turnaround contrast with EPAM’s slower recent growth and margin challenges, highlighting differing fundamental strengths.
Financial Ratios Comparison
The table below presents the most recent financial ratios for Fidelity National Information Services, Inc. (FIS) and EPAM Systems, Inc. (EPAM) as of fiscal year 2024, allowing for a direct comparison of their key financial metrics.
| Ratios | Fidelity National Information Services, Inc. (FIS) | EPAM Systems, Inc. (EPAM) |
|---|---|---|
| ROE | 9.24% | 12.52% |
| ROIC | 3.99% | 10.67% |
| P/E | 30.80 | 29.47 |
| P/B | 2.85 | 3.69 |
| Current Ratio | 0.85 | 2.96 |
| Quick Ratio | 0.85 | 2.96 |
| D/E (Debt-to-Equity) | 0.74 | 0.045 |
| Debt-to-Assets | 34.16% | 3.44% |
| Interest Coverage | 4.87 | 0 |
| Asset Turnover | 0.30 | 1.00 |
| Fixed Asset Turnover | 11.56 | 14.07 |
| Payout Ratio | 55.17% | 0 |
| Dividend Yield | 1.79% | 0 |
Interpretation of the Ratios
Fidelity National Information Services, Inc. (FIS)
FIS shows a mixed ratio profile with a strong net margin of 14.32% but weaker returns on equity (9.24%) and invested capital (3.99%). Its current ratio is below 1 at 0.85, indicating short-term liquidity concerns. Dividend yield stands at 1.79%, with a neutral payout supported by manageable debt levels, but some caution is warranted due to asset turnover weakness and a slightly unfavorable overall rating.
EPAM Systems, Inc. (EPAM)
EPAM presents a more favorable liquidity position with a current ratio of 2.96 and low debt-to-equity at 0.04, reflecting conservative leverage. Profitability ratios like ROE (12.52%) and asset turnover (1.0) are neutral, while valuation multiples such as PE (29.47) and PB (3.69) are less attractive. The company does not pay dividends, likely focusing on growth and reinvestment, with a slightly favorable overall ratio evaluation.
Which one has the best ratios?
EPAM’s ratios suggest stronger liquidity, lower leverage, and a slightly favorable overall profile, despite some valuation concerns and lack of dividends. FIS, while profitable with a decent net margin and dividend yield, faces challenges in returns, liquidity, and asset efficiency, leading to a slightly unfavorable overall assessment. Thus, EPAM’s ratios appear comparatively more robust.
Strategic Positioning
This section compares the strategic positioning of Fidelity National Information Services, Inc. (FIS) and EPAM Systems, Inc., focusing on Market position, Key segments, and Exposure to technological disruption:
FIS
- Large market cap of 33B; operates in global financial technology with competitive pressures.
- Diverse segments: Banking, Capital Markets, Merchant Solutions driving revenue growth.
- Exposure through core processing, digital banking, and payment solutions to fintech disruption.
EPAM
- Market cap of 12B; focuses on digital platform engineering and software development services.
- Serves multiple sectors including financial services, healthcare, retail, and software hi-tech.
- Faces disruption via digital transformation, AI, automation, and emerging technologies focus.
FIS vs EPAM Positioning
FIS adopts a diversified financial technology approach across banking, merchant, and capital markets, offering broad market coverage. EPAM concentrates on digital engineering and consulting services across various industries, emphasizing technology innovation but with narrower financial services focus.
Which has the best competitive advantage?
Both companies are shedding value with ROIC below WACC; however, FIS shows growing profitability, while EPAM’s profitability declines, indicating FIS has a slightly stronger competitive advantage despite current value destruction.
Stock Comparison
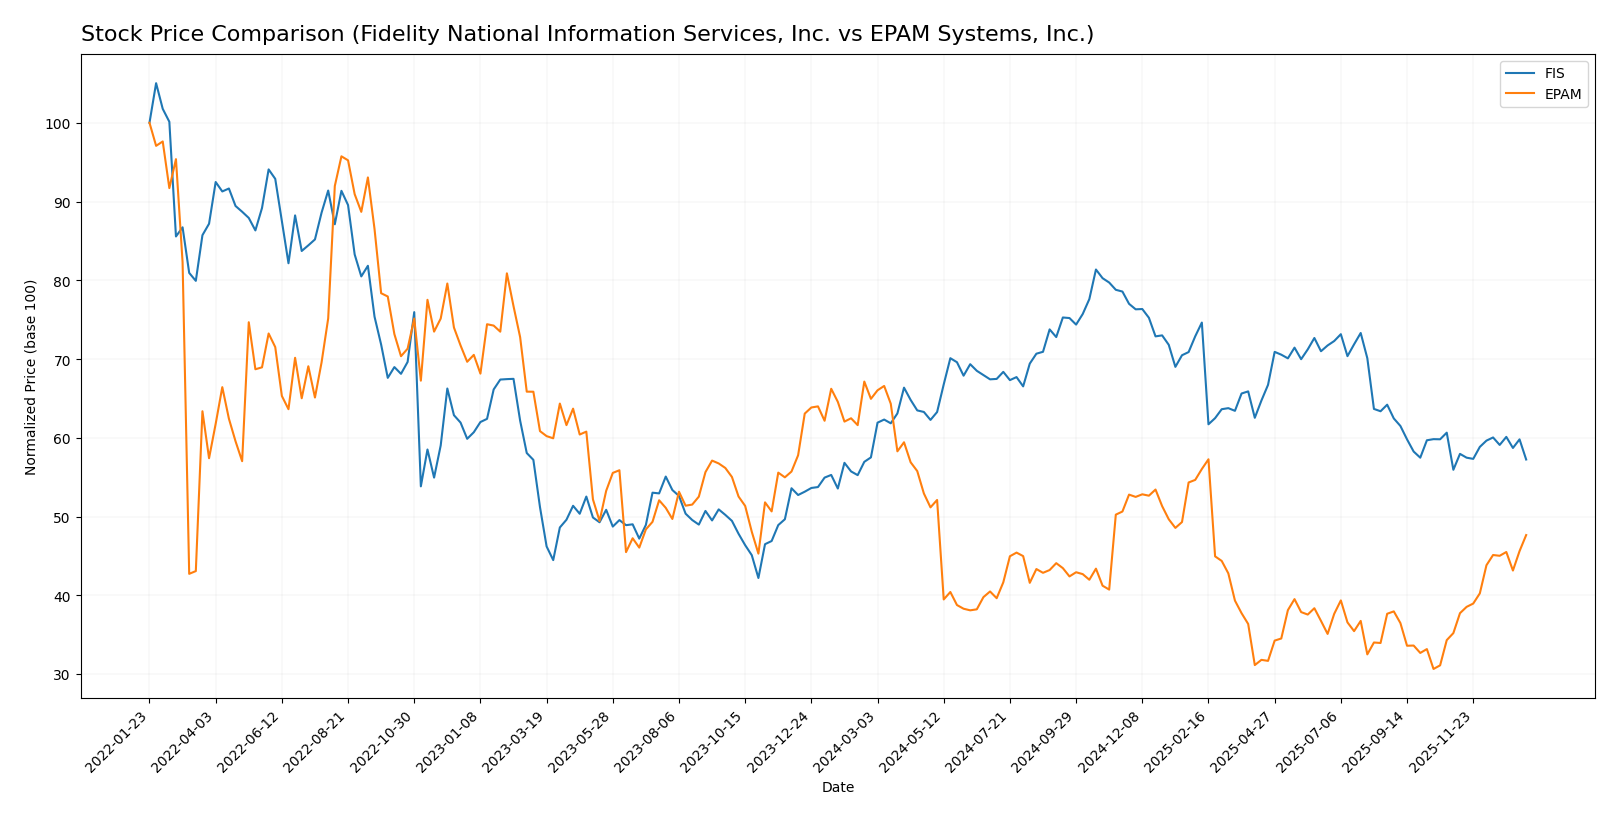
The stock price trajectories of Fidelity National Information Services, Inc. (FIS) and EPAM Systems, Inc. over the past year reveal contrasting dynamics, with FIS showing a slight overall decline and EPAM experiencing a pronounced decrease followed by recent strong recovery.
Trend Analysis
Fidelity National Information Services, Inc. (FIS) exhibited a slight bearish trend over the past 12 months with a -0.47% price change, showing acceleration and moderate volatility. Recent weeks indicate a mild bullish reversal, gaining 2.34%.
EPAM Systems, Inc. (EPAM) posted a significant bearish trend with a -26.64% decline over the year, accompanied by high volatility and acceleration. The recent period marks a strong bullish surge, increasing 35.38% with notable buyer dominance.
Comparing these trends, EPAM delivered the highest market performance recently due to its sharp recovery, despite a larger annual decline than FIS.
Target Prices
Analysts present a cautiously optimistic consensus on target prices for Fidelity National Information Services, Inc. and EPAM Systems, Inc.
| Company | Target High | Target Low | Consensus |
|---|---|---|---|
| Fidelity National Information Services, Inc. | 82 | 69 | 75.5 |
| EPAM Systems, Inc. | 247 | 175 | 214 |
The consensus targets for FIS and EPAM indicate upside potential compared to their current prices of 63.98 and 221.4 respectively, suggesting moderate to strong growth expectations from analysts.
Analyst Opinions Comparison
This section compares analysts’ ratings and financial scores for Fidelity National Information Services, Inc. (FIS) and EPAM Systems, Inc. (EPAM):
Rating Comparison
FIS Rating
- Rating: C+ indicating a very favorable status overall.
- Discounted Cash Flow Score: 4, considered favorable for valuation.
- ROE Score: 2, a moderate efficiency in generating profit from equity.
- ROA Score: 2, moderate asset utilization efficiency.
- Debt To Equity Score: 1, very unfavorable, indicating higher financial risk.
- Overall Score: 2, moderate overall financial standing.
EPAM Rating
- Rating: A- reflecting a very favorable overall status.
- Discounted Cash Flow Score: 4, also favorable for valuation.
- ROE Score: 3, moderate but higher efficiency than FIS.
- ROA Score: 4, favorable utilization of assets compared to FIS.
- Debt To Equity Score: 4, favorable, indicating lower financial risk.
- Overall Score: 4, favorable overall financial standing.
Which one is the best rated?
Based strictly on the data, EPAM holds higher ratings and scores across most metrics, including overall score, ROA, and debt to equity, suggesting a stronger financial profile compared to FIS.
Scores Comparison
Here is a comparison of the Altman Z-Score and Piotroski Score for the two companies:
FIS Scores
- Altman Z-Score: 0.46, in distress zone, indicating high bankruptcy risk.
- Piotroski Score: 8, very strong financial health and value potential.
EPAM Scores
- Altman Z-Score: 8.83, in safe zone, indicating low bankruptcy risk.
- Piotroski Score: 7, strong financial health and value potential.
Which company has the best scores?
EPAM has a substantially higher Altman Z-Score, placing it in the safe zone versus FIS in distress. FIS, however, has a slightly stronger Piotroski Score. Overall, EPAM’s scores suggest greater financial stability.
Grades Comparison
Here is a detailed comparison of the latest grades from recognized grading companies for the two companies:
Fidelity National Information Services, Inc. Grades
This table summarizes recent grades and rating actions from well-known grading firms for Fidelity National Information Services, Inc.:
| Grading Company | Action | New Grade | Date |
|---|---|---|---|
| Truist Securities | Maintain | Hold | 2025-11-19 |
| RBC Capital | Maintain | Outperform | 2025-11-06 |
| JP Morgan | Maintain | Overweight | 2025-11-06 |
| UBS | Maintain | Buy | 2025-11-06 |
| Truist Securities | Maintain | Hold | 2025-10-24 |
| Keefe, Bruyette & Woods | Maintain | Outperform | 2025-10-01 |
| UBS | Upgrade | Buy | 2025-09-30 |
| UBS | Maintain | Neutral | 2025-08-06 |
| Keefe, Bruyette & Woods | Maintain | Outperform | 2025-08-06 |
| Truist Securities | Maintain | Hold | 2025-07-17 |
Grades for FIS show a consistent pattern of Hold to Buy ratings, with multiple maintains and a recent upgrade by UBS.
EPAM Systems, Inc. Grades
This table presents recent grades and rating actions from reputable grading companies for EPAM Systems, Inc.:
| Grading Company | Action | New Grade | Date |
|---|---|---|---|
| TD Cowen | Maintain | Buy | 2026-01-09 |
| Mizuho | Maintain | Outperform | 2025-11-11 |
| JP Morgan | Maintain | Overweight | 2025-11-07 |
| Morgan Stanley | Maintain | Equal Weight | 2025-09-09 |
| JP Morgan | Maintain | Overweight | 2025-08-20 |
| Barclays | Maintain | Overweight | 2025-05-12 |
| Guggenheim | Maintain | Buy | 2025-05-09 |
| Morgan Stanley | Maintain | Equal Weight | 2025-05-09 |
| Needham | Maintain | Buy | 2025-05-09 |
| Piper Sandler | Maintain | Neutral | 2025-05-09 |
EPAM maintains a steady flow of Buy and Overweight ratings, with some Equal Weight and Neutral opinions sustained over time.
Which company has the best grades?
Both companies have a consensus “Buy” rating, but EPAM Systems shows a higher frequency of strong Buy and Overweight grades from multiple firms, suggesting a slightly more favorable outlook. Investors might interpret this as EPAM having stronger analyst endorsement, potentially influencing portfolio decisions more positively.
Strengths and Weaknesses
Below is a comparison of key strengths and weaknesses for Fidelity National Information Services, Inc. (FIS) and EPAM Systems, Inc. (EPAM) based on the most recent financial and operational data.
| Criterion | Fidelity National Information Services, Inc. (FIS) | EPAM Systems, Inc. (EPAM) |
|---|---|---|
| Diversification | Broad product mix with strong Banking and Capital Market Solutions segments generating $9.87B in 2024 | Diverse sector exposure including Financial Services, Consumer Goods, Healthcare, and Technology with revenues spread across six verticals |
| Profitability | Net margin solid at 14.32%, but ROIC at 3.99% below WACC (6.54%) indicates value destruction | Net margin moderate at 9.61%, ROIC of 10.67% below high WACC (11.76%), showing value erosion and declining profitability trend |
| Innovation | Moderate innovation, with a slightly unfavorable economic moat but improving ROIC trend (+210%) | Innovation-driven but with a very unfavorable moat and declining ROIC (-25%), signaling challenges in maintaining competitive advantage |
| Global presence | Strong global footprint through multiple financial solutions segments | Global services company with broad vertical coverage but smaller scale compared to FIS |
| Market Share | Leading position in financial technology with stable revenue growth in core segments | Growing presence in IT services with expanding verticals, but profitability pressures exist |
Key takeaways: FIS demonstrates strong diversification and improving profitability trends despite currently destroying value, while EPAM faces challenges with declining profitability and a weaker economic moat, though it benefits from broad sector exposure and favorable liquidity ratios. Investors should weigh FIS’s improving operational efficiency against EPAM’s innovation potential tempered by financial caution.
Risk Analysis
Below is a comparative risk overview for Fidelity National Information Services, Inc. (FIS) and EPAM Systems, Inc. based on the latest 2024 data.
| Metric | Fidelity National Information Services, Inc. (FIS) | EPAM Systems, Inc. |
|---|---|---|
| Market Risk | Moderate, beta 0.94, stable but sensitive to tech sector | High, beta 1.73, more volatile due to tech exposure |
| Debt level | Moderate, Debt/Equity 0.74, neutral risk | Low, Debt/Equity 0.04, favorable low leverage |
| Regulatory Risk | Moderate, operates globally in financial tech | Moderate, global services with compliance demands |
| Operational Risk | Moderate, complex service segments, efficiency concerns | Moderate, relies on digital platform engineering |
| Environmental Risk | Low, limited direct environmental footprint | Low, mainly software services, minimal direct impact |
| Geopolitical Risk | Moderate, US-based but global client exposure | Moderate to high, global service delivery risks |
The most impactful risks center on EPAM’s higher market volatility and geopolitical exposure due to its global operations, while FIS faces moderate operational and regulatory challenges with a heavier debt load. EPAM’s strong financial health and low leverage mitigate some risks, whereas FIS’s financial distress signals caution for risk-averse investors.
Which Stock to Choose?
Fidelity National Information Services, Inc. (FIS) shows a favorable income evolution with strong net margin growth and profitability, yet its financial ratios are slightly unfavorable overall. The company carries moderate debt, reflected in a neutral debt-to-equity ratio, and holds a very favorable C+ rating despite some risk indicators.
EPAM Systems, Inc. (EPAM) exhibits favorable income statement metrics with solid revenue growth over the period, though some ratios like ROIC and WACC are unfavorable. EPAM maintains low debt levels and strong liquidity, supported by a very favorable A- rating and scores indicating financial stability and strength.
Considering ratings and financial evaluations, FIS might appear suitable for investors prioritizing improving profitability despite moderate leverage, while EPAM could be more appealing to those valuing strong financial health and liquidity. Risk-averse investors might lean towards EPAM’s stable position, whereas risk-tolerant investors might see potential in FIS’s profitability growth trajectory.
Disclaimer: Investment carries a risk of loss of initial capital. The past performance is not a reliable indicator of future results. Be sure to understand risks before making an investment decision.
Go Further
I encourage you to read the complete analyses of Fidelity National Information Services, Inc. and EPAM Systems, Inc. to enhance your investment decisions: