In the fast-evolving technology landscape, EPAM Systems, Inc. and Asana, Inc. stand out as influential players with distinct yet overlapping roles. EPAM excels in digital platform engineering and comprehensive IT services, while Asana leads in work management software designed for team productivity. Comparing their innovation strategies and market positions offers valuable insights. Join me as we explore which company presents the more compelling opportunity for investors in 2026.

Table of contents
Companies Overview
I will begin the comparison between EPAM Systems and Asana by providing an overview of these two companies and their main differences.
EPAM Overview
EPAM Systems, Inc. is a global provider of digital platform engineering and software development services. Founded in 1993 and headquartered in Newtown, Pennsylvania, EPAM serves diverse industries including financial services, healthcare, and software. Its offerings span engineering, infrastructure management, maintenance, testing, consulting, and advanced digital solutions such as AI and robotics, positioning it as a comprehensive technology services provider.
Asana Overview
Asana, Inc., based in San Francisco and founded in 2008, operates a work management platform designed to help teams coordinate tasks and strategic initiatives. The company targets industries like technology, retail, education, and healthcare. Asana’s cloud-based software enables organizations to manage projects, campaigns, and goals, focusing on improving team productivity and collaboration across various sectors globally.
Key similarities and differences
Both EPAM and Asana operate in the technology sector and offer software-related services, but their business models differ significantly. EPAM delivers broad IT services including engineering, infrastructure, and consulting across multiple industries, emphasizing customized solutions. In contrast, Asana focuses on a single cloud-based application platform that streamlines work management and collaboration, targeting team productivity rather than infrastructure or engineering services.
Income Statement Comparison
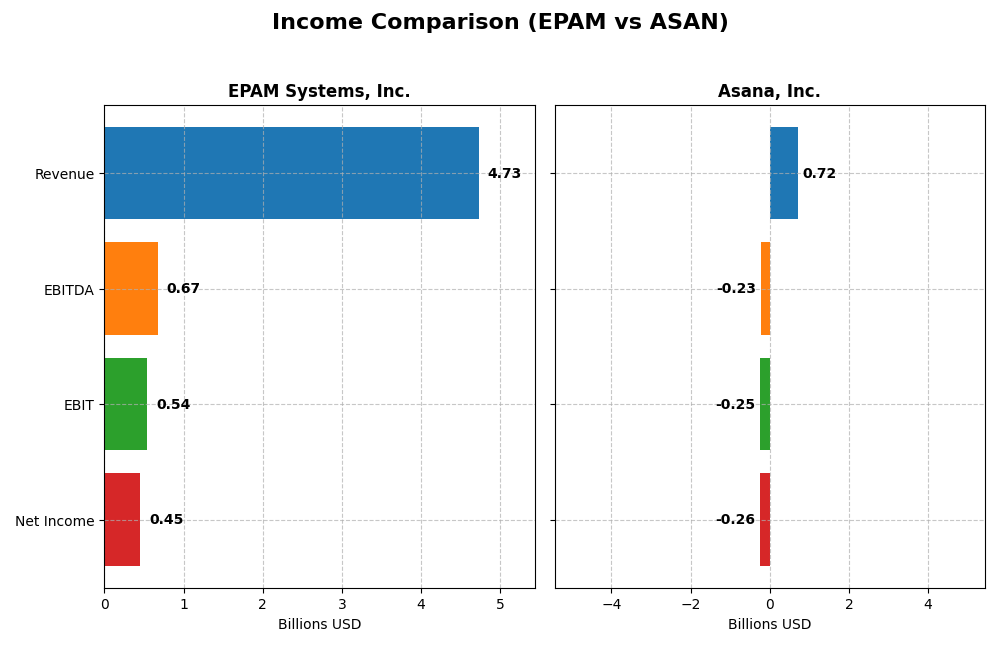
The table below compares key income statement metrics for EPAM Systems, Inc. and Asana, Inc. for their most recent fiscal years, highlighting differences in revenue, profitability, and earnings per share.
| Metric | EPAM Systems, Inc. (2024) | Asana, Inc. (2025) |
|---|---|---|
| Market Cap | 11.1B | 3.1B |
| Revenue | 4.73B | 724M |
| EBITDA | 672M | -230M |
| EBIT | 545M | -247M |
| Net Income | 455M | -256M |
| EPS | 7.93 | -1.11 |
| Fiscal Year | 2024 | 2025 |
Income Statement Interpretations
EPAM Systems, Inc.
EPAM’s revenue rose steadily from $2.66B in 2020 to $4.73B in 2024, marking a 77.78% increase overall. Net income also grew from $327M to $455M, reflecting a 38.93% rise. Margins remained generally stable, with a gross margin near 30.7% and net margin around 9.6%. In 2024, growth slowed to 0.8% in revenue, but net margin improved 8.12%, signaling efficiency gains despite softer top-line expansion.
Asana, Inc.
Asana’s revenue surged from $227M in 2021 to $724M in 2025, a 218.88% increase. However, net income remained negative, though losses narrowed from -$212M to -$256M. The company shows a high gross margin of 89.3%, but operating and net margins stayed deeply negative, near -34% and -35% respectively. In 2025, revenue growth accelerated 10.94%, with net margin and EPS improvements indicating gradual operational progress.
Which one has the stronger fundamentals?
EPAM presents stronger fundamentals with consistent profitability, positive net income growth, and stable margins, despite a modest slowdown in revenue growth last year. Asana’s rapid revenue growth is offset by persistent losses and negative margins, though recent improvements may hint at a path toward profitability. EPAM’s financial stability contrasts with Asana’s ongoing investment phase and operating deficits.
Financial Ratios Comparison
Below is a comparison of key financial ratios for EPAM Systems, Inc. and Asana, Inc. based on their most recent fiscal year data.
| Ratios | EPAM Systems, Inc. (2024) | Asana, Inc. (2025) |
|---|---|---|
| ROE | 12.5% | -112.3% |
| ROIC | 10.7% | -54.0% |
| P/E | 29.5 | -19.2 |
| P/B | 3.69 | 21.52 |
| Current Ratio | 2.96 | 1.44 |
| Quick Ratio | 2.96 | 1.44 |
| D/E (Debt-to-Equity) | 0.045 | 1.18 |
| Debt-to-Assets | 3.4% | 30.1% |
| Interest Coverage | 0 | -72.4 |
| Asset Turnover | 1.00 | 0.81 |
| Fixed Asset Turnover | 14.07 | 2.76 |
| Payout Ratio | 0 | 0 |
| Dividend Yield | 0 | 0 |
Interpretation of the Ratios
EPAM Systems, Inc.
EPAM presents a mixed ratio profile with strengths in liquidity and low leverage, as indicated by a current ratio of 2.96 and debt-to-equity at 0.04, both favorable. However, valuation multiples like P/E at 29.47 and P/B at 3.69 are unfavorable, alongside a return on invested capital below the weighted average cost of capital. The company does not pay dividends, reflecting a possible focus on reinvestment or growth priorities.
Asana, Inc.
Asana shows predominantly unfavorable profitability ratios, with a net margin of -35.3% and return on equity at -112.31%, signaling operating losses. Liquidity remains neutral to favorable with a quick ratio of 1.44, but leverage is high with debt-to-equity at 1.18. Asana also does not distribute dividends, likely due to its negative income and ongoing investment in research and development.
Which one has the best ratios?
EPAM’s ratios are generally more favorable, especially in liquidity, leverage, and operational efficiency, despite some valuation concerns and a neutral return on equity. Asana’s profile is burdened by negative profitability and higher debt, with fewer favorable metrics. Therefore, EPAM exhibits a stronger overall financial ratio standing compared to Asana.
Strategic Positioning
This section compares the strategic positioning of EPAM Systems, Inc. and Asana, Inc. including Market position, Key segments, and disruption:
EPAM Systems, Inc.
- Established global player in IT services facing competitive pressure in multiple sectors
- Diverse revenue streams across financial, consumer, healthcare, software, and media sectors
- Exposure to disruption through emerging technologies like AI, robotics, and virtual reality
Asana, Inc.
- Work management platform provider with niche focus on team and executive collaboration software
- Concentrated on software application for work orchestration across various industries
- Operates in a software segment vulnerable to rapid innovation but specifics on disruption not given
EPAM vs Asana Positioning
EPAM pursues a diversified business model across multiple industry verticals, offering broad engineering and consulting services. Asana focuses narrowly on work management software, targeting specific organizational workflows. EPAM’s scale contrasts with Asana’s specialized platform approach.
Which has the best competitive advantage?
Both companies show very unfavorable MOAT evaluations with declining ROIC and value destruction. Neither EPAM nor Asana currently demonstrates a sustainable competitive advantage based on profitability trends.
Stock Comparison
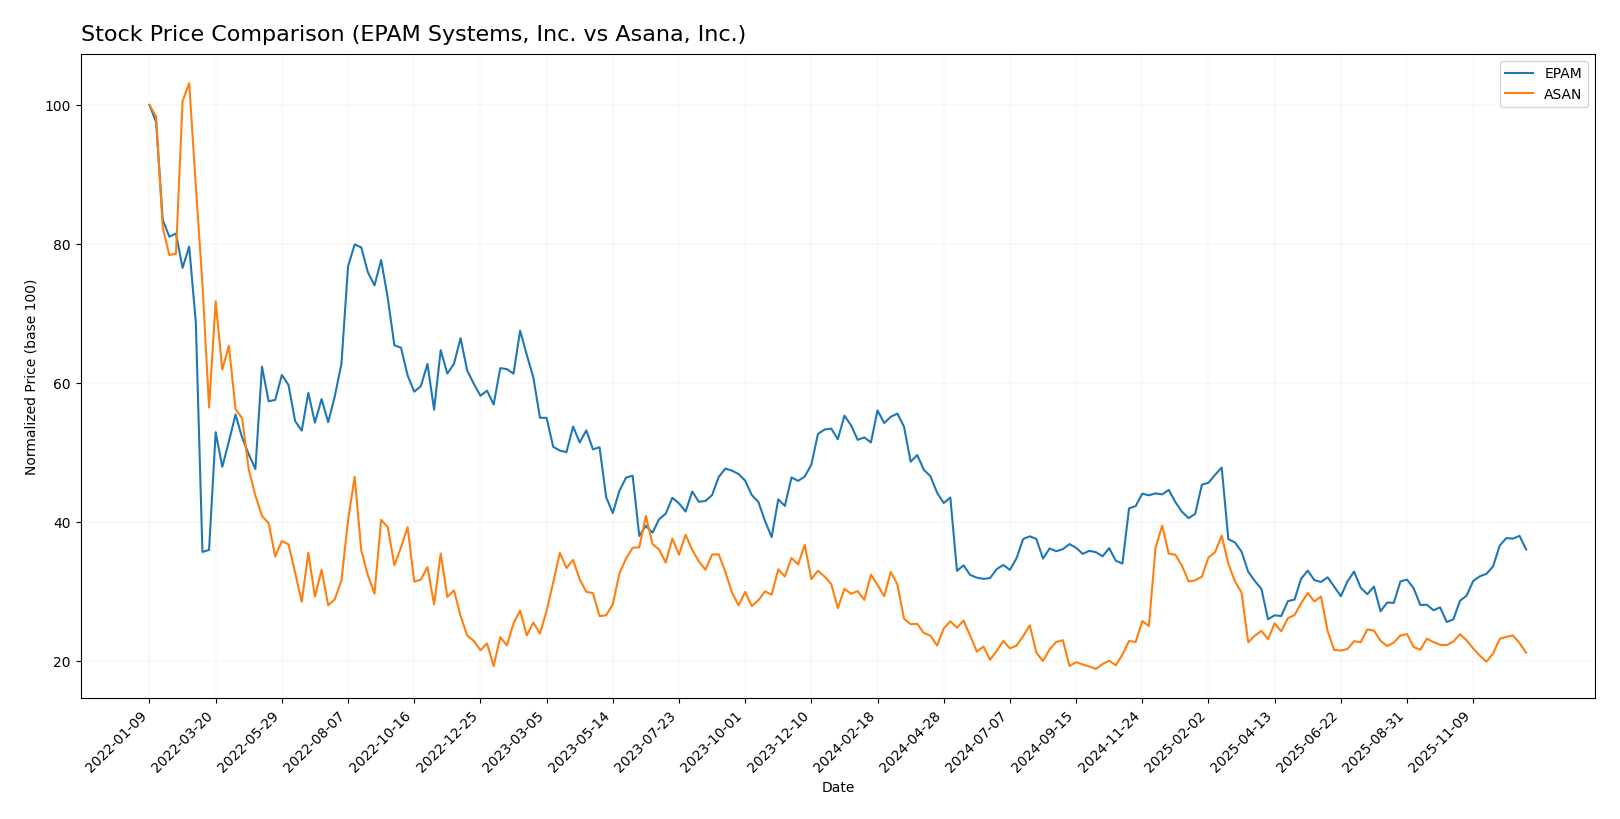
The stock price chart highlights significant declines for both EPAM Systems, Inc. and Asana, Inc. over the past year, with contrasting recent trading dynamics and volume patterns that reflect differing investor sentiment.
Trend Analysis
EPAM Systems, Inc. experienced a bearish trend over the past 12 months with a price drop of 29.98%, showing acceleration in its decline. Recently, however, it reversed with a 38.71% gain over the last two and a half months.
Asana, Inc. also had a bearish trend over the past year with a 34.64% decrease, but the trend showed deceleration. Its recent performance remained negative, declining 7.03% from October 2025 to January 2026.
Comparing the two, EPAM delivered higher market performance recently with strong buyer dominance, while Asana continued to decline, resulting in a less favorable short-term trend.
Target Prices
The current analyst consensus presents a mixed outlook for EPAM Systems, Inc. and Asana, Inc.
| Company | Target High | Target Low | Consensus |
|---|---|---|---|
| EPAM Systems, Inc. | 185 | 175 | 180 |
| Asana, Inc. | 18 | 14 | 15.75 |
Analysts expect EPAM to trade below its current price of 200.46 USD, indicating potential downside risk. Meanwhile, Asana’s consensus target of 15.75 USD suggests moderate upside from its current price of 12.96 USD.
Analyst Opinions Comparison
This section compares analysts’ ratings and grades for EPAM Systems, Inc. and Asana, Inc.:
Rating Comparison
EPAM Rating
- Rating: A-, classified as Very Favorable.
- Discounted Cash Flow Score: 4, Favorable.
- ROE Score: 3, Moderate.
- ROA Score: 4, Favorable.
- Debt To Equity Score: 4, Favorable.
- Overall Score: 4, Favorable.
ASAN Rating
- Rating: D+, classified as Very Unfavorable.
- Discounted Cash Flow Score: 1, Very Unfavorable.
- ROE Score: 1, Very Unfavorable.
- ROA Score: 1, Very Unfavorable.
- Debt To Equity Score: 1, Very Unfavorable.
- Overall Score: 1, Very Unfavorable.
Which one is the best rated?
Based on the provided data, EPAM Systems, Inc. is significantly better rated than Asana, Inc. EPAM holds favorable to moderate scores across key metrics, whereas Asana scores are very unfavorable throughout.
Scores Comparison
The scores comparison between EPAM and ASAN highlights their financial stability and strength as follows:
EPAM Scores
- Altman Z-Score: 7.96, indicating strong safety zone.
- Piotroski Score: 7, reflecting strong financial health.
ASAN Scores
- Altman Z-Score: -0.20, indicating financial distress.
- Piotroski Score: 4, showing average financial strength.
Which company has the best scores?
Based strictly on the provided data, EPAM exhibits a much stronger financial position with a high Altman Z-Score in the safe zone and a strong Piotroski score. ASAN’s scores indicate financial distress and average strength, respectively.
Grades Comparison
Here is the latest available grading data for EPAM Systems, Inc. and Asana, Inc.:
EPAM Systems, Inc. Grades
The following table summarizes recent grades from reputable grading companies for EPAM Systems, Inc.:
| Grading Company | Action | New Grade | Date |
|---|---|---|---|
| Mizuho | Maintain | Outperform | 2025-11-11 |
| JP Morgan | Maintain | Overweight | 2025-11-07 |
| Morgan Stanley | Maintain | Equal Weight | 2025-09-09 |
| JP Morgan | Maintain | Overweight | 2025-08-20 |
| Barclays | Maintain | Overweight | 2025-05-12 |
| Needham | Maintain | Buy | 2025-05-09 |
| Guggenheim | Maintain | Buy | 2025-05-09 |
| Morgan Stanley | Maintain | Equal Weight | 2025-05-09 |
| Piper Sandler | Maintain | Neutral | 2025-05-09 |
| Stifel | Maintain | Buy | 2025-05-02 |
Overall, EPAM Systems has consistently received mostly positive grades, ranging from Neutral to Buy and Outperform, with no downgrades in the recent period.
Asana, Inc. Grades
The following table summarizes recent grades from reputable grading companies for Asana, Inc.:
| Grading Company | Action | New Grade | Date |
|---|---|---|---|
| Keybanc | Upgrade | Overweight | 2025-12-15 |
| DA Davidson | Maintain | Neutral | 2025-12-04 |
| RBC Capital | Maintain | Underperform | 2025-12-03 |
| UBS | Maintain | Neutral | 2025-12-03 |
| Citigroup | Maintain | Neutral | 2025-12-03 |
| Piper Sandler | Maintain | Overweight | 2025-09-04 |
| Baird | Maintain | Neutral | 2025-09-04 |
| Morgan Stanley | Maintain | Underweight | 2025-09-04 |
| B of A Securities | Maintain | Buy | 2025-06-04 |
| JP Morgan | Maintain | Underweight | 2025-06-04 |
Asana, Inc. presents a mixed rating picture with grades ranging from Underperform and Underweight to Buy and Overweight, indicating some divergence of opinions among analysts.
Which company has the best grades?
EPAM Systems, Inc. has received more consistently positive grades with several Buy and Outperform ratings, while Asana, Inc. has a wider range of ratings including several Underperform and Underweight grades. This suggests EPAM’s ratings are more favorable, potentially implying greater analyst confidence and stability for investors.
Strengths and Weaknesses
Below is a comparison table highlighting the key strengths and weaknesses of EPAM Systems, Inc. and Asana, Inc. based on the latest available data as of 2026.
| Criterion | EPAM Systems, Inc. | Asana, Inc. |
|---|---|---|
| Diversification | Strong sector diversification: Financial Services (1.02B), Consumer Goods & Retail (1.01B), Software & Hi-Tech (702M) | Limited product diversification, focused mainly on project management software |
| Profitability | Moderate net margin (9.61%), neutral ROE (12.52%), but ROIC (10.67%) below WACC (11.89%), indicating value destruction | Negative net margin (-35.3%), very negative ROE (-112.31%), and ROIC (-54.04%), reflecting poor profitability and value destruction |
| Innovation | Established in software development with evolving business verticals, but declining ROIC trend (-24.6%) signals challenges | High innovation in collaboration tools but unable to translate into profits; steeply declining ROIC (-76%) |
| Global presence | Strong global footprint with multiple sector revenues across regions | Primarily North American market focus with growing international presence but limited scale |
| Market Share | Well-established in IT services with diversified client base | Growing market share in SaaS collaboration but facing intense competition |
Key takeaways: EPAM benefits from broad sector exposure and solid financial footing despite a declining profitability trend, warranting cautious monitoring. Asana shows strong innovation potential but struggles significantly with profitability and value creation, suggesting higher investment risk.
Risk Analysis
Below is a comparative table highlighting key risk metrics for EPAM Systems, Inc. and Asana, Inc. based on the most recent data from 2025-2026:
| Metric | EPAM Systems, Inc. | Asana, Inc. |
|---|---|---|
| Market Risk | Beta 1.75 (higher volatility) | Beta 0.93 (moderate volatility) |
| Debt level | Low debt-to-equity 0.04 (favorable) | High debt-to-equity 1.18 (unfavorable) |
| Regulatory Risk | Moderate (global IT services exposure) | Moderate (software sector, US focused) |
| Operational Risk | Large scale with 61.2K employees, complex operations | Smaller scale, 1.8K employees, growth stage risks |
| Environmental Risk | Moderate, typical for IT service providers | Low to moderate, mainly digital operations |
| Geopolitical Risk | Significant due to global presence, including Eastern Europe | Moderate, primarily US and international markets |
In synthesis, EPAM faces notable market and geopolitical risks due to its global footprint and heightened beta, yet benefits from a very strong financial position with minimal debt and solid liquidity. Conversely, Asana exhibits elevated financial risks, including high leverage and negative profitability, placing it in a distress zone for bankruptcy risk. The most impactful risks for investors are Asana’s financial instability and EPAM’s exposure to geopolitical tensions, which could affect operational continuity and market valuation.
Which Stock to Choose?
EPAM Systems, Inc. shows a favorable income statement with positive net and EBIT margins and steady profit growth over the past years. Its financial ratios are slightly favorable, marked by strong liquidity and low debt, though some valuation metrics appear less attractive. Despite a very favorable rating of A-, the company’s economic moat assessment signals value destruction with declining ROIC compared to WACC.
Asana, Inc. presents a mixed income evolution with strong revenue growth but persistent negative profitability and margins. Financial ratios are slightly unfavorable, reflecting high debt levels and weak returns, alongside an overall very unfavorable rating of D+. The company’s economic moat is also very unfavorable, indicating ongoing value erosion and decreasing profitability.
Investors prioritizing stability and financial health might find EPAM’s favorable rating and solid income quality more reassuring, despite its value destruction signal. Conversely, those focused on high growth potential could interpret Asana’s revenue expansion and improving income trends as opportunities, albeit with higher risk due to weak profitability and financial ratios.
Disclaimer: Investment carries a risk of loss of initial capital. The past performance is not a reliable indicator of future results. Be sure to understand risks before making an investment decision.
Go Further
I encourage you to read the complete analyses of EPAM Systems, Inc. and Asana, Inc. to enhance your investment decisions: