In the dynamic energy sector, EOG Resources, Inc. and Texas Pacific Land Corporation stand out as influential players with distinct yet overlapping footprints. Both companies operate within oil and gas exploration and production, but with contrasting approaches: EOG focuses on direct resource extraction while Texas Pacific emphasizes land and royalty management. This comparison will guide investors in identifying which company aligns best with their portfolio goals and risk appetite. Let’s explore which is the more compelling investment opportunity.
Table of contents
Companies Overview
I will begin the comparison between EOG Resources, Inc. and Texas Pacific Land Corporation by providing an overview of these two companies and their main differences.
EOG Resources, Inc. Overview
EOG Resources, Inc. explores, develops, produces, and markets crude oil, natural gas, and natural gas liquids. It operates primarily in New Mexico, Texas, and Trinidad and Tobago. With estimated net proved reserves of 3.7B barrels of oil equivalent, EOG is a significant player in the oil and gas exploration and production industry. The company is headquartered in Houston, Texas.
Texas Pacific Land Corporation Overview
Texas Pacific Land Corporation focuses on land and resource management, and water services, managing roughly 880K acres mainly in Texas. It holds various nonparticipating perpetual oil and gas royalty interests and leases land for multiple purposes including hydrocarbon extraction and infrastructure. Additionally, its water services segment provides comprehensive water management solutions in the Permian Basin. The firm is based in Dallas, Texas.
Key similarities and differences
Both companies operate within the energy sector and are listed on the NYSE. EOG concentrates on direct exploration and production of oil and gas, while Texas Pacific Land manages land assets and royalty interests, supplemented by water services. EOG has a larger workforce and market cap of $57.5B versus Texas Pacific’s $21.5B, reflecting their differing business models and operational scopes.
Income Statement Comparison
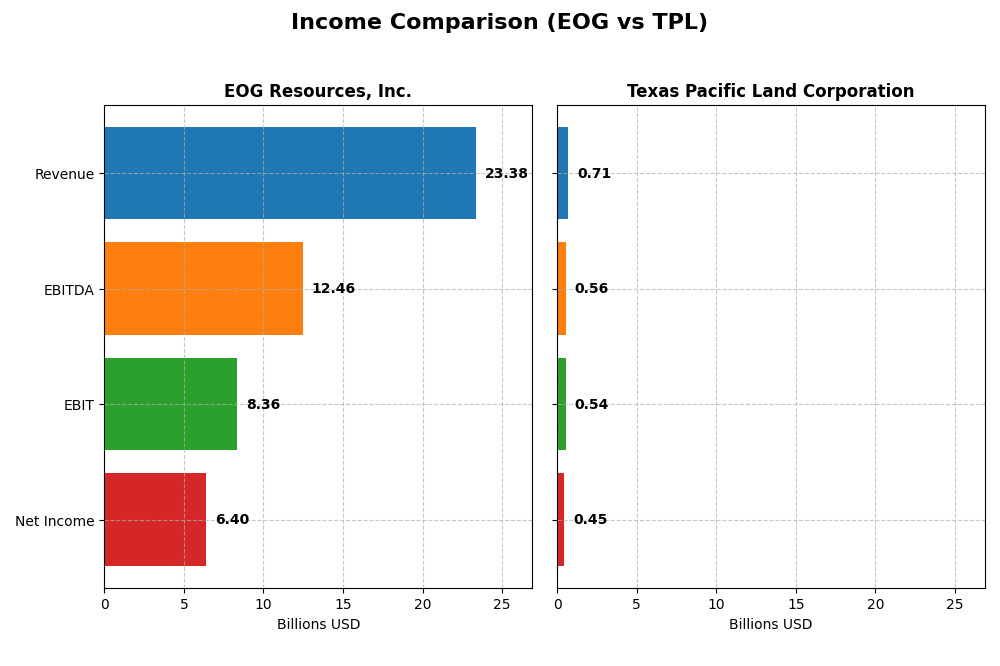
Below is a comparative overview of key income statement metrics for EOG Resources, Inc. and Texas Pacific Land Corporation for the fiscal year 2024.
| Metric | EOG Resources, Inc. | Texas Pacific Land Corporation |
|---|---|---|
| Market Cap | 57.5B | 21.5B |
| Revenue | 23.4B | 706M |
| EBITDA | 12.5B | 564M |
| EBIT | 8.36B | 539M |
| Net Income | 6.40B | 454M |
| EPS | 11.31 | 6.58 |
| Fiscal Year | 2024 | 2024 |
Income Statement Interpretations
EOG Resources, Inc.
EOG Resources showed strong revenue growth of 136.76% from 2020 to 2024, with net income increasing over 11-fold in the same period. Margins remained robust, with a gross margin of 75.7% and net margin near 27.4%. However, in 2024, revenue growth slowed to 0.85%, and profitability margins declined, reflecting a challenging year despite overall favorable fundamentals.
Texas Pacific Land Corporation
Texas Pacific Land exhibited steady revenue growth of 133.29% over 2020-2024, supported by a high gross margin of 89.9% and an impressive net margin above 64%. The latest year marked continued growth, with an 11.75% revenue increase and stable net margins. Operational efficiencies and expanding profitability underpinned a favorable income statement trend throughout the period.
Which one has the stronger fundamentals?
Texas Pacific Land demonstrates stronger fundamentals with higher and more consistent margins, no interest expense, and robust growth metrics in the most recent year. EOG Resources displays strong long-term growth but faces margin pressure and slower recent revenue expansion. The overall income statement evaluation favors Texas Pacific Land for its operational efficiency and margin stability.
Financial Ratios Comparison
The table below presents a comparison of key financial ratios for EOG Resources, Inc. and Texas Pacific Land Corporation based on their most recent fiscal year data from 2024.
| Ratios | EOG Resources, Inc. | Texas Pacific Land Corporation |
|---|---|---|
| ROE | 21.82% | 40.09% |
| ROIC | 14.75% | 35.60% |
| P/E | 10.84 | 18.67 |
| P/B | 2.36 | 7.48 |
| Current Ratio | 2.10 | 8.33 |
| Quick Ratio | 1.91 | 8.33 |
| D/E | 0.17 | 0.00 |
| Debt-to-Assets | 10.74% | 0.04% |
| Interest Coverage | 58.57 | 0 |
| Asset Turnover | 0.50 | 0.57 |
| Fixed Asset Turnover | 0.68 | 1.27 |
| Payout Ratio | 32.59% | 76.51% |
| Dividend Yield | 3.01% | 4.10% |
Interpretation of the Ratios
EOG Resources, Inc.
EOG Resources shows strong financial ratios, with favorable net margin (27.39%), ROE (21.82%), ROIC (14.75%), and a low debt-to-equity ratio (0.17), indicating solid profitability and financial health. Some asset turnover ratios are unfavorable, suggesting efficiency improvement opportunities. The company pays dividends with a 3.01% yield, supported by free cash flow, indicating sustainable shareholder returns.
Texas Pacific Land Corporation
Texas Pacific Land presents very high profitability ratios, including a 64.32% net margin and 40.09% ROE, with zero debt and excellent interest coverage. However, the current ratio is unusually high (8.33), marking possible liquidity inefficiencies. The dividend yield at 4.1% is attractive and appears covered by strong cash flows, though its price-to-book ratio is elevated, implying premium valuation risk.
Which one has the best ratios?
EOG Resources’ ratios are very favorable overall, balancing profitability, leverage, and liquidity efficiently. Texas Pacific Land shows stronger profitability but with more mixed liquidity and valuation signals. EOG’s consistency and lower valuation multiples provide a more balanced financial profile, while Texas Pacific Land’s premium multiples and liquidity raise caution despite high returns.
Strategic Positioning
This section compares the strategic positioning of EOG Resources, Inc. and Texas Pacific Land Corporation, covering Market position, Key segments, and Exposure to technological disruption:
EOG Resources, Inc.
- Large market cap of 57B, operates in oil & gas E&P with moderate beta of 0.5, facing industry competition.
- Key segments include oil and condensate production, natural gas liquids, and gas gathering/processing, driving revenue.
- Exposure to technological disruption is moderate, centered on traditional exploration and production activities.
Texas Pacific Land Corporation
- Mid-size market cap of 21.5B, focused on land/resource management and royalties, with higher beta near 0.94.
- Key revenue from oil and gas royalties, water services, easements, and land sales, emphasizing resource management.
- Exposure to disruption limited, focused on land rights and water services, less reliant on exploration technologies.
EOG vs TPL Positioning
EOG exhibits a diversified upstream production model with multiple hydrocarbon segments generating revenue, while TPL concentrates on land and resource management plus royalties, yielding stable income but less operational diversity. EOG faces typical exploration risks; TPL’s model is less exposed operationally but linked to resource extraction success.
Which has the best competitive advantage?
Both companies show very favorable MOAT evaluations with growing ROIC above WACC. EOG’s ROIC growth is stronger in percentage terms, while TPL has higher excess returns over WACC, indicating efficient capital use and durable competitive advantages for both.
Stock Comparison
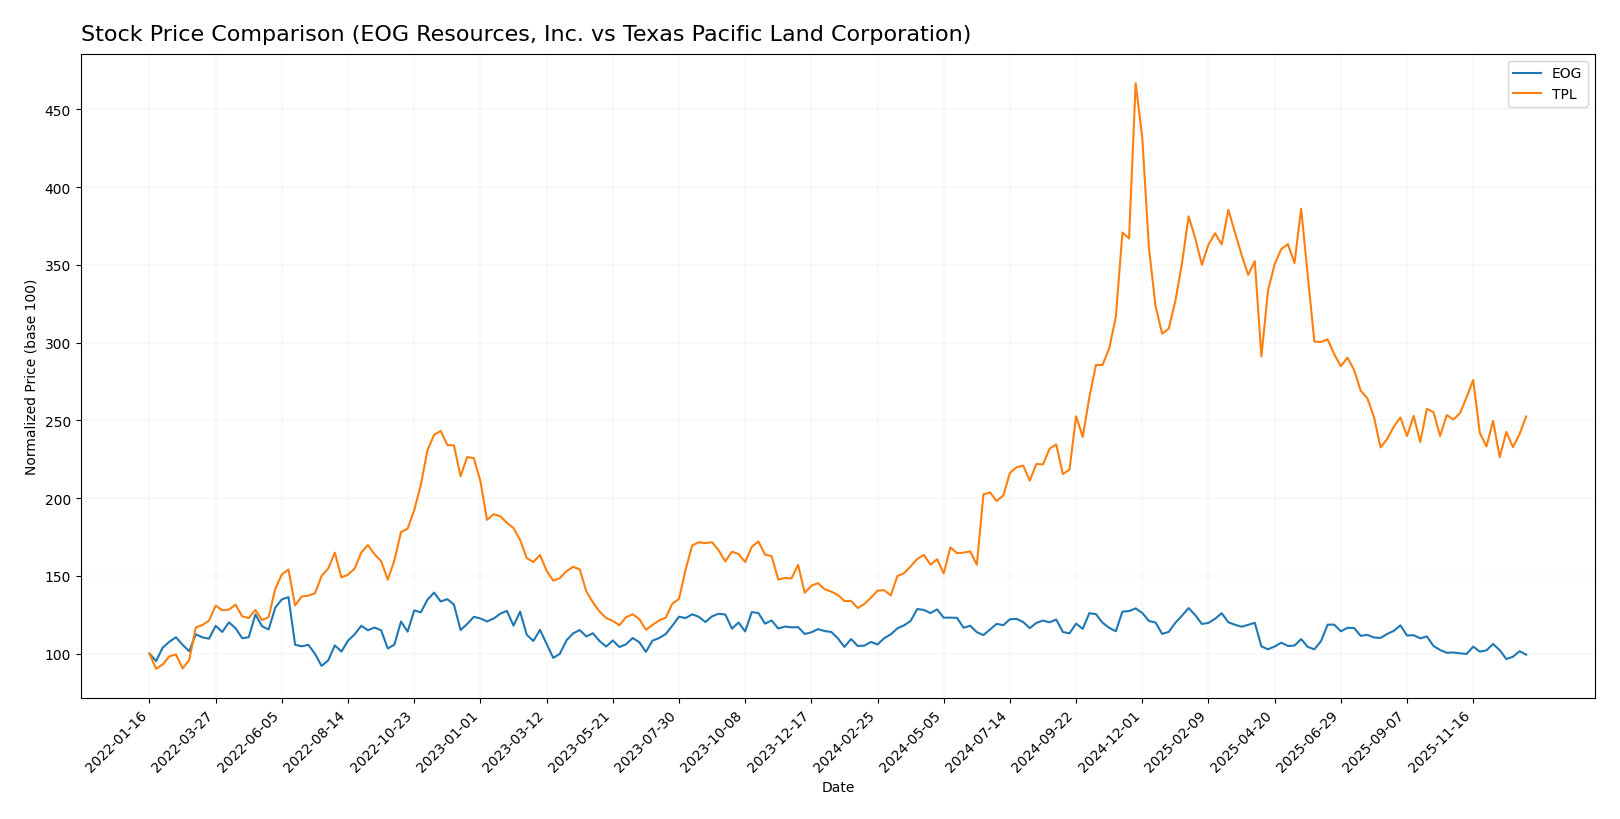
The stock prices of EOG Resources, Inc. and Texas Pacific Land Corporation over the past 12 months reveal contrasting trajectories, with EOG exhibiting a bearish trend and TPL showing strong bullish momentum despite recent deceleration.
Trend Analysis
EOG Resources, Inc. experienced a 7.61% price decline over the past year, indicating a bearish trend with accelerating downward momentum. The stock traded between a high of 136.58 and a low of 101.93, with volatility measured by an 8.9 standard deviation.
Texas Pacific Land Corporation posted an 85.66% gain over the same period, reflecting a bullish trend with decelerating growth. Price swings were highly volatile, evidenced by a 91.94 standard deviation, with a high of 576.67 and a low of 167.98.
Comparing the two, Texas Pacific Land Corporation delivered substantially higher market performance than EOG Resources, Inc., maintaining a strong upward trend throughout the year despite some recent slowing.
Target Prices
The current analyst consensus presents a bullish outlook for both EOG Resources, Inc. and Texas Pacific Land Corporation.
| Company | Target High | Target Low | Consensus |
|---|---|---|---|
| EOG Resources, Inc. | 170 | 124 | 139.45 |
| Texas Pacific Land Corporation | 1050 | 1050 | 1050 |
Analysts expect EOG’s stock to appreciate from its current price of 104.92 USD toward a consensus target of 139.45 USD. Texas Pacific Land’s target of 1050 USD significantly exceeds its current price of 311.87 USD, indicating strong growth expectations.
Analyst Opinions Comparison
This section compares analysts’ ratings and grades for EOG Resources, Inc. and Texas Pacific Land Corporation:
Rating Comparison
EOG Rating
- Rating: A-, classified as Very Favorable by analysts.
- Discounted Cash Flow Score: 5, indicating a very favorable valuation outlook.
- ROE Score: 5, reflecting very efficient profit generation from equity.
- ROA Score: 5, demonstrating excellent asset utilization for earnings.
- Debt To Equity Score: 2, suggesting moderate financial risk with some leverage.
- Overall Score: 4, rated as favorable overall financial standing.
TPL Rating
- Rating: A-, also classified as Very Favorable by analysts.
- Discounted Cash Flow Score: 4, showing a favorable but slightly lower valuation.
- ROE Score: 5, equally strong in generating profit from shareholders’ equity.
- ROA Score: 5, also excellent in utilizing assets effectively.
- Debt To Equity Score: 3, indicating moderate financial risk but slightly higher debt.
- Overall Score: 4, also rated favorable overall.
Which one is the best rated?
Both EOG and TPL share the same overall rating of A- and an overall score of 4. EOG scores higher on discounted cash flow and has a lower debt to equity score, while TPL has a slightly better debt to equity score but a lower DCF score, making their ratings closely matched.
Scores Comparison
Here is a comparison of the Altman Z-Score and Piotroski Score for EOG Resources and Texas Pacific Land:
EOG Scores
- Altman Z-Score: 3.34, indicating a safe zone with low bankruptcy risk.
- Piotroski Score: 5, reflecting average financial strength.
TPL Scores
- Altman Z-Score: 29.77, indicating a safe zone with very low bankruptcy risk.
- Piotroski Score: 4, reflecting average financial strength.
Which company has the best scores?
Based solely on the provided data, TPL has a significantly higher Altman Z-Score, implying stronger financial stability, while both companies show average Piotroski Scores, with EOG slightly ahead.
Grades Comparison
Here is the comparison of recent grades and ratings from reputable grading companies for the two companies:
EOG Resources, Inc. Grades
The table below summarizes recent grades from major financial institutions for EOG Resources, Inc.:
| Grading Company | Action | New Grade | Date |
|---|---|---|---|
| Bernstein | Maintain | Market Perform | 2026-01-05 |
| Citigroup | Maintain | Neutral | 2025-12-17 |
| Mizuho | Maintain | Neutral | 2025-12-12 |
| UBS | Maintain | Buy | 2025-12-12 |
| Piper Sandler | Maintain | Neutral | 2025-11-18 |
| Wells Fargo | Maintain | Overweight | 2025-11-11 |
| Piper Sandler | Maintain | Neutral | 2025-10-21 |
| Susquehanna | Maintain | Positive | 2025-10-20 |
| Wells Fargo | Maintain | Overweight | 2025-10-17 |
| Morgan Stanley | Maintain | Equal Weight | 2025-10-14 |
EOG Resources, Inc. shows a generally stable outlook with multiple “Neutral” and “Market Perform” grades, alongside several “Buy” and “Overweight” ratings, indicating a broadly positive but cautious sentiment.
Texas Pacific Land Corporation Grades
The table below presents recent grades from recognized financial institutions for Texas Pacific Land Corporation:
| Grading Company | Action | New Grade | Date |
|---|---|---|---|
| BWS Financial | Maintain | Buy | 2024-08-12 |
| BWS Financial | Maintain | Buy | 2024-05-10 |
| BWS Financial | Maintain | Buy | 2024-04-02 |
| Stifel | Maintain | Hold | 2024-01-23 |
| Stifel | Maintain | Hold | 2023-11-30 |
| Stifel | Maintain | Hold | 2023-05-22 |
| Stifel | Maintain | Hold | 2023-05-21 |
| Stifel | Maintain | Hold | 2023-04-27 |
| Stifel | Maintain | Hold | 2023-04-26 |
| Stifel | Maintain | Hold | 2023-04-12 |
Texas Pacific Land Corporation’s grades show a consistent “Buy” rating from BWS Financial, supported by multiple “Hold” ratings from Stifel, reflecting a mixed but stable investor outlook.
Which company has the best grades?
EOG Resources, Inc. has received a broader range of positive grades, including multiple “Buy” and “Overweight” ratings, compared to Texas Pacific Land Corporation’s mix of “Buy” and predominantly “Hold” grades. This contrast suggests that EOG’s outlook is somewhat more favorable, which may influence investors seeking a blend of stability and growth potential.
Strengths and Weaknesses
Below is a comparative overview of the key strengths and weaknesses for EOG Resources, Inc. (EOG) and Texas Pacific Land Corporation (TPL) based on the most recent financial and operational data.
| Criterion | EOG Resources, Inc. | Texas Pacific Land Corporation |
|---|---|---|
| Diversification | Moderate diversification in oil, natural gas, and related services with strong U.S. focus | Focused primarily on land royalties and sales, limited product diversification |
| Profitability | Net margin 27.39%, ROIC 14.75%, favorable profitability ratios | Exceptional profitability with 64.32% net margin and 35.6% ROIC |
| Innovation | Moderate innovation in energy extraction and commodity risk management | Limited innovation; business model relies on land asset management |
| Global presence | Strong presence in the United States with some international operations | Primarily U.S.-based with no significant international footprint |
| Market Share | Significant market share in U.S. oil and gas production | Niche market leader in land royalty management in Texas |
Key takeaways: EOG Resources offers strong profitability and a moderate level of diversification with a growing ROIC, reflecting efficient capital use in energy production. Texas Pacific Land stands out with superior profitability and a very favorable economic moat, though its focus is narrower and tied to land asset management. Both companies show durable competitive advantages but differ in business scope and innovation focus.
Risk Analysis
Below is a comparative overview of key risks for EOG Resources, Inc. and Texas Pacific Land Corporation as of 2026.
| Metric | EOG Resources, Inc. | Texas Pacific Land Corporation |
|---|---|---|
| Market Risk | Moderate (Beta 0.50, stable oil prices) | Higher (Beta 0.94, more volatile) |
| Debt level | Low (Debt/Equity 0.17, favorable) | Very low (Debt/Equity 0.0, favorable) |
| Regulatory Risk | Moderate (Energy sector scrutiny) | Moderate (Land and resource management regulations) |
| Operational Risk | Moderate (Oil & gas production complexities) | Low (Land management and water services) |
| Environmental Risk | High (Fossil fuel extraction impact) | Moderate (Water management focus) |
| Geopolitical Risk | Moderate (US and Trinidad operations) | Low (Primarily Texas-based assets) |
The most impactful risks are environmental and regulatory for EOG, given its fossil fuel operations and international presence, while Texas Pacific Land faces less operational and geopolitical risk but must manage regulatory scrutiny and market volatility carefully. Both companies maintain strong balance sheets, reducing financial risk significantly.
Which Stock to Choose?
EOG Resources, Inc. shows a strong income evolution with a 5-year revenue growth of 137% and net income growth exceeding 1150%, though recent one-year figures are slightly unfavorable. Its financial ratios are largely favorable with a very favorable global view, supported by solid profitability, low debt with net debt-to-EBITDA negative, and an A- rating indicating very favorable financial health. The company demonstrates a durable competitive advantage with a very favorable moat rating.
Texas Pacific Land Corporation exhibits favorable income growth both over five years and the last year, with a particularly high net margin of 64.3% and strong profitability metrics. Its financial ratios are favorable overall but include some neutral and unfavorable aspects such as a high price-to-book ratio and a very high current ratio. The company holds a similar A- rating and a very favorable moat, indicating efficient capital use and strong competitive advantages.
Considering ratings and the overall financial and income evaluations, EOG might appear suited for investors valuing a strong balance of profitability and financial stability with consistent value creation. In contrast, TPL could appeal to those favoring high profitability and growth potential despite some valuation concerns. Risk-averse investors might lean towards EOG’s stability, while risk-tolerant investors seeking growth could find TPL’s profile more attractive.
Disclaimer: Investment carries a risk of loss of initial capital. The past performance is not a reliable indicator of future results. Be sure to understand risks before making an investment decision.
Go Further
I encourage you to read the complete analyses of EOG Resources, Inc. and Texas Pacific Land Corporation to enhance your investment decisions: